Rochester Institute of Technology
RIT Scholar Works
Theses
Thesis/Dissertation Collections
2003
JAVA software for LiBr-water absorption
refrigeration system evaluation
Indraneel Samanta
Follow this and additional works at:
http://scholarworks.rit.edu/theses
This Thesis is brought to you for free and open access by the Thesis/Dissertation Collections at RIT Scholar Works. It has been accepted for inclusion
in Theses by an authorized administrator of RIT Scholar Works. For more information, please contact
Recommended Citation
JAVA software for LiBr-Water Absorption Refrigeration
System Evaluation
By
Indraneel Samanta
A thesis submitted in partial fulfillment of the requirement for the Degree of
Master of Science in Mechanical Engineering
Approved
by:
Dr
.
Ali Ogut
Ali Ogut
Department Of Mechanical Engineering
Thesis Advisor
Dr. Jian Yu
Jian Yu
Department Of Mechanical Engineering
Dr. Jeffery Kozak
Department Of Mechanical Engineering
Jeffery Kozak
Dr
.
Edward C. Hensel
Department Head Of Mechanical Engineering
Edward C. Hensel
PERMISSION
TO REPRODUCE THE THESIS
Title
ofThesis
JAVA
software
for
LiBr
-Water Absorption
Refrigeration
System
Evaluation
I,
IndraneelSamanta,
hereby
grantpermission to theWallace Memorial
Library
ofRochester Institute
of
Technology
to reproducemy
thesisin
whole onin
part.Any
reproduction will notbe for
DEDICATION
'/
amagreatbeliever
in
luck,
andIfind
theharder
I
work, themoreI
have
of
it"-Thomas
Jefferson
(1743-1826)
I
also am afirm believer in hard
work, andmy inspiration is my father. He is
amanof greatvision;his
wordsmotivateme morethan
anything
else.I
wouldlike
todedicate
this work tomy father S.K. Samanta
andmy
motherT.K. Samanta. I
thankthem
for providing
melove
and support,for
inculcating
in
me thehabit
ofworking
hard,
for
being
there whenever
I
felt lost
anddepressed in my
life,
andfor
helping
me realizemy dream
ofgetting
aACKNOWLEDGEMENTS
I
wouldlike
to thank all the people who supported mein
this project and worked as a team towardsachieving
the goal of this project.I
wouldlike
to thankmy
thesis advisorDr. Ali
Ogut,
for his
academic guidance and support ofthis
thesis,
sinceits
inception.
Without Dr. Ali Ogut's
support thiswork would
be impossible
to accomplish.Thank
youDr. Ali Ogut for
being
available at all the timesI
needed youthemost.
I
would alsolike
to thankDr. Jian
Yu for his
valuableinputs
to this thesis work.Thank
youDr. Jian
Yu
for
yourassistanceandspending
timefor
thedevelopment
this work.I
wouldlike
to thankDepartment Head
ofMechanical
Engineering
Dr. Edward
C.
Hensel,
for
admitting
me as a studentinto
theMaster
ofScience
programin Mechanical
Engineering
atRochester
Institute
ofTechnology
and thusproviding
me with a chancetodevelop
my
skills andapply
themin
thisthesiswork.
ABSTRACT
The energy
consumption per capita per year throughout the worldis
increasing.
With
anincrease in
standard of
living
and world population, thedemand
for
totalenergy
is
increasing
rapidly
andit is
anticipatedthat the
existing fossil
fuels
willbe
exhaustedbefore
the end ofthis century.More
attentionis
being
focused
by
the scientists and engineersthroughout the worldtodevelop
potential methods thatwould use waste
heat.
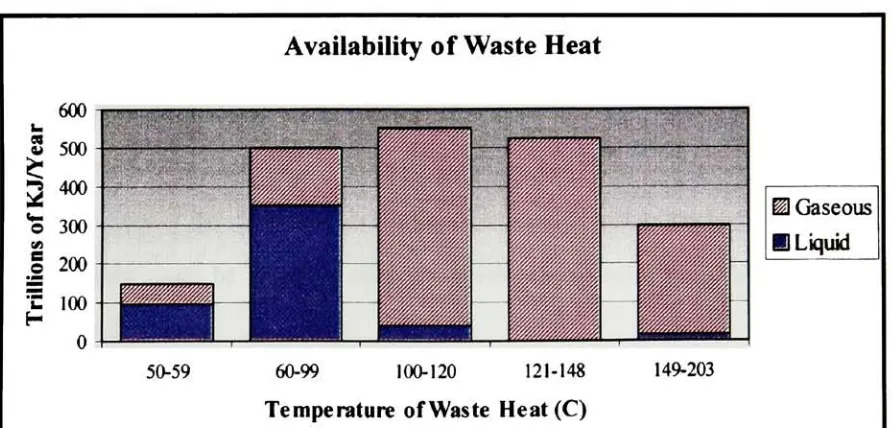
A
significant amount oflow
temperature(between
60C
and 99C)
heat is
wastedannually in
industrial
process[1]. This
wasteheat
couldbe
usedtodrive
absorptionchillers,but it is
not used sinceit lowers
theCoefficient
ofPerformance
(C.O.P)
of the system.One
approach to alower
generatortemperature
involves
thelowering
of generator pressure.The dual-chamber
vortex generator(DCVG)
described in
this thesislowers
the generator pressure as a consequence oftheconservation ofrotationalmomentum and permits an absorption chiller to
function
withimproved capacity
withrelatively
coolersources of waste
heat. DCVG is designed
to replace currenthigh
temperature generatorsin
commercialabsorption chillers.
For
a proof ofconcept, a test standhas been designed
and constructedfor
testing
theperformance of a vortex-assistedgenerator
for
usein
absorptionrefrigerationsystems.The
scope of this thesisis
todevelop
Absorption
Refrigeration Evaluation Software
(ARES)
whichwould provide a performance evaluation
for
the test stand,based
on experimentaldata
taken.ARES
also
helps
in
thedesign
and analysis of aconventional andconventional/vortex absorption refrigerationsystem and makes
it
possible toinvestigate
various cycle configurations, to predict theirperformanceandtocomparethemwitheach other on auniform
basis. ARES
requires simpleinputs
consisting
oftheminimum
information
needed todefine
the system,based
on theseinput
values otheroperating
TABLE
OF CONTENTS
LIST
OF FIGURES
IXLIST
OF SYMBOLS
IXCHAPTER 1 :INTRODUCTION
1
1.1 PROJECT BACKGROUND 1
1.2PROJECT OBJECTIVES AND GOAL
3
CHAPTER2:ABSORPTION REFRIGERATION 4
2.1 DESCRIPTION OF ABSORPTION REFRIGERATION CYCLE 4
2.1.1ComponentsofAbsorption Refrigeration Cycle 7
2.2 INTRODUCTION
TO
VORTEXASSISTED GENERATOR10
2.3 VORTEX FLOW THEORY 1 1
2.3. 1 Velocity Distributions 14
2.3.2 Tangential Velocity 15
CHAPTER3:SOFTWARE DEVELOPMENT 18
3.1 COMPONENT MODELLING
18
3.1.1 Absorber 19
3.1.2 Generator 20
3. 1.3 Solution Heat Exchanger 21
3.1.4 Condenser 22
3. 1.5 Evaporator
23
3. 1.6 Valve 24
3.1.7 Pump 25
3.2 NUMERICAL SCHEMES FOR
PROPERTIES
OF LlBR SOLUTION27
3.2.1 Enthalpy
27
3.2.2 Saturation Temperature 29
3.2.3 Saturation Pressure 3 1
3.2.4 Solution Density 32
3.2.5 Solution Specific Heat 34
3.2.6
Solution Composition 353.3
Numerical Schemes ForProperties
ofSteamandWater37
3.3.1 Enthalpy 37
3.3.2 Saturation Temperature
38
3.3.3
Saturation Pressure40
3.4.3
FlowMeters45
3.4.4
TemperatureSensors 463.5
PERFORMANCE OF TEST STAND 463.5.1 Condenser 46
3.5.2 Mixer 47
3.5.3 Vortex Generator 48
3.6 MODELING
ACONVENTIONAL ABSORPTION
CHILLER 493.6.1 Assumptions 49
3.6.2 Required Input Values 5 1
3.6.3 Pump 52
3.6.4 Solution Heat Exchanger
53
3.6.5 GeneratorandAbsorber
53
3.6.6 Condenser
55
3.6.7 Evaporator
55
3.7
MODELING OF
CONVENTIONAL/VORTEXSYSTEM
573.7.1 Assumptions 57
3.7.2 Input Values RequiredbyARES 58
3.7.3 Pump 59
3.7.4 Solution Heat Exchanger 60
3.7.5 Generator 60
3.7.6
Condenser 613.7.7 Evaporator 62
CHAPTER 4 :
APPLICATIONS
OF ARES 644.1 INTRODUCTION TO
ARES
644.2LABVIEW
65
4.2. 1 Main Pressure Measurement
66
4.2.2 Vacuum Pressure Measurement 67
4.2.3 Main Solution Flow
68
4.2.4 Condenser Flow
69
4.2.5 Input File 70
4.3 Starting ARES
714.3.1 Collect Data 73
4.3.2 Output File 74
4.3.3
Performance75
4.3.4 Save 78
4.4 Performance of
Conventional Absorption
RefrigerationSystem
80
4.5
Performance ofConventional/Vortex
Absorption RefrigerationSystem
84
CHAPTER
5
:RESULTS ANDDISCUSSIONS
89
5.1
EES Results
For Conventional Absorption System89
5.2
ARES
ResultsforConventional Absorption System
92
REFERENCES
96
APPENDIXA 98
APPENDIX B 99
B.l Equilibrium
Charts
For LiBr WaterSolution
99B.2 EnthalpyConcentration Chart For LiBr Water
Solution
100APPENDIX
C
101LIST OF
FIGURES
FIGURE 1-1 AVAILABLE WASTE ENERGY 2
FIGURE 2-1 CONVENTIONAL ABSORPTION CHILLER (YORK
INTL)
5FIGURE2-2 SOLUTION PUMP (YORK
INTL)
7FIGURE2-3CONVENTIONAL GENERATOR 8
FIGURE 2-4 CONDENSER (YORK
INTL)
8FIGURE2-5 EVAPORATOR (YORK
INTL)
9FIGURE 2-6 ABSORBER (YORK
INTL)
10FIGURE 2-7 SIMPLE SCHEMATIC OF VORTEX GENERATOR 1 1
FIGURE
2-8(A)
FORCED VORTEX(B)
FREE VORTEX 12FIGURE 2-9 PRESSURE AND VELOCITY DISTRIBUTION IN VORTEX FLOW 13
FIGURE 2-10 VELOCITIES IN A VORTEX FLOW 14
FIGURE 2-1 1 ELEMENT OF FLUID IN A ROTATING BODY 15
FIGURE3-1 ABSORBER MASS AND ENERGY BALANCE 20
FIGURE 3-2 GENERATOR MASS AND ENERGY BALANCE 21
FIGURE3-3 SHX MASS AND ENERGY BALANCE 22
FIGURE3-4 CONDENSER MASS AND ENERGY BALANCE 23
FIGURE 3-5 EVAPORATOR MASS AND ENERGY BALANCE 24
FIGURE 3-6 EXPANSION VALVE 25
FIGURE 3-7SOLUTIONPUMP 26
FIGURE 3-8 T-X-PAPPROXIMATION 36
FIGURE 3-9 SCHEMATIC OF THE TEST STAND 44
FIGURE 3-10 CONVENTIONAL ABSORPTION CHILLER 50
FIGURE3-11 VORTEX/CONVENTIONAL SYSTEM 57
FIGURE 4-1 THERMOCOUPLE OUTPUT 66
FIGURE4-2 MAIN PRESSURE MEASUREMENT OUTPUT SCREEN 67
FIGURE4-3 VACUUM MEASUREMENT OUTPUT SCREEN 68
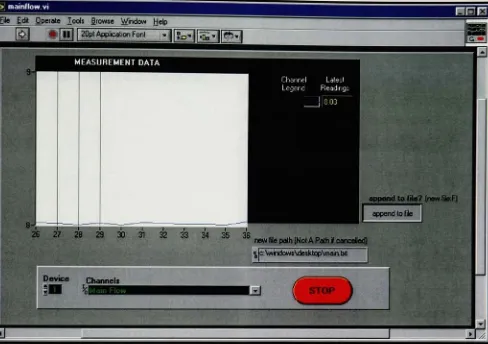
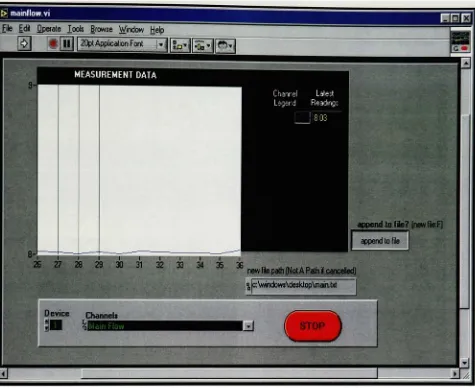
FIGURE 4-4 MAIN SOLUTION FLOW OUTPUT SCREEN 69
FIGURE4-5 CONDENSER FLOW METER OUTPUT SCREEN 70
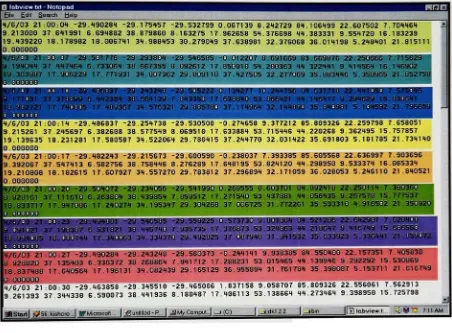
FIGURE4-6 LAB VIEW OUTPUT FILE 71
FIGURE4-7 LOGIN SCREEN FOR ARES 72
FIGURE4-8 MENU SCREEN FOR ARES 73
FIGURE 4-9 INPUT SCREEN FOR ARES 74
FIGURE4-10OUTPUT FILE SCREEN FOR ARES 75
FIGURE 4-1 1 CHOOSE TYPE OF SYSTEM OPTION 76
FIGURE 4-12 CHOOSE INPUT FILE SCREEN FOR ARES 77
FIGURE4-13CYCLE SCREEN FOR ARES 77
FIGURE 4-14 TABULAR CYCLE ANALYSISSCREENFOR ARES 78
FIGURE 4-15FILE SAVING SCREEN FOR ARES 79
FIGURE4-16INPUTSCREEN FOR ARES 81
FIGURE4-17 FILE INPUT SCREEN FOR ARES 81
FIGURE 4-18 SAVE INPUT DATA TO A FILESCREENFOR ARES 82
FIGURE 4-19 CONVERGED SOLUTION FRAME FOR ARES 82
FIGURE4-20 CONVENTION SYSTEMCYCLEDIAGRAM SCREEN FOR ARES 83
FIGURE4-21 CONVENTIONALSYSTEM-TABULAROUTPUT SCREEN FOR ARES 83
FIGURE 4-22 CONVENTIONAL/VORTEXSYSTEMINPUT SCREEN 85
FIGURE 4-23 CONVENTIONAL/VORTEX FILE INPUT SCREEN 86
FIGURE 4-24 CONVENTIONAL/VORTEX SAVE INPUT AS FILE SCREEN 86
FIGURE4-25CONVERGEDSOLUTIONFRAMEFORCONVENTIONAL/VORTEXSYSTEM 87
FIGURE4-26TABULAR OUTPUTFRAME FORCONVENTIONAL/VORTEXSYSTEM 87
LIST OF
SYMBOLS
COP
Coefficient
ofPerformance
Cp
Specific Heat
D
Diameter
E
Energy
e
Effectiveness
h
Specific
Enthalpy
m,
M,
M
Mass flow-rate
n
Index
ofVorticity
P
Pressure
Q
Heating/Cooling
Loads
p
Density
R
Radius
R0,
Re
Overflow Radius
andCyclone
Radius
RE
Refrigeration
Capacity
T
Temperature
V
Velocity
W
Pump
Work
X
Weak Solution
Concentration
1
CHAPTER
ONE
INTRODUCTION
1.1 PROJECT BACKGROUND
Concerns
about the greenhouse
effect causedby
chloro-fluro-carbons(CFCs)
and electriccapacity
shortageduring
mid-day in hot
summerdays,
have brought growing interests in
absorption chillers.
Absorption
refrigerationtechnology
cameinto
use about150
years agoand
is
a mature technology.Since its inception intensive
researchis
being
done
toimprove
its efficiency
and expand the temperature range ofits energy
sources.Heat
sourcesfrom
approximately
99C
and abovehave
proven tobe
successful.However,
a significantamount of thermal resources are available
in
theform
oflow
temperature(between 60
C
and
99
C)
industrial
wasteheat,
approximately 500
trillionkJ
per annumis known
tobe
wasted
every
year as shownin Figure 1-1 [1].
Conventional
absorption chillers can usethislower
temperatureheat
sourcein
the generatorbut
with thepenalty
oflowering
both
theCoefficient
ofPerformance
(C.O.P)
and therefrigeration effect
[2]. An
absorption chillerusing
a vortex-assisted generator wouldA
vortex generator produces a reduction of pressuredue
to a vortex motion.The
saturationtemperature of refrigerant-absorbent
liquid
mixtureis lowered
as the pressure reduces.The
reduction of pressure
due
to the vortex motion producedby
the vortex generator wouldcause the evolution of the refrigerant vapor at a
lower
temperaturefrom
theabsorbent-refrigerant
liquid
mixture.The
benefit from
such an operationis
that thelower
temperaturewaste
heat
couldbe
utilized as anenergy
sourcefor
absorption chillers.An improved
capacity
andCoefficient
ofPerformance
(COP)
couldbe
obtained when compared toconventional absorption chillers
using low
temperaturewasteheat.
600i
2
500Availability
ofWaste Heat
r-: n : :
50-59 60-99 100-120 121-148 149-203
Temperature
ofWaste
Heat(C)
[image:13.508.34.480.338.552.2]1.2 PROJECT OBJECTIVES AND GOAL
As
a proof of concept a test stand wasdeveloped
and adata
acquisition systemdesigned in
Labview
was usedtoobtain the values ofpressure,temperature andflow
rateatdifferent
pointson this test stand.
The
purpose of this thesis work was todevelop
a software, which wouldprovide a simultaneous performance analysis
using
the averaged values oflive
data
obtainedfrom
the experimentalsetup
and also wouldhave
thecapability
ofdesigning
andproviding
analysis ofthe
designed
conventional and vortex absorption refrigeration systems.The
software wasdeveloped using JAVA
asprogramming
language,
it is PC based
andcould
be loaded
on toany
computer.JAVA
was usedprimarily because
ofits
platformindependence,
which meansthat the software couldbe
used onany
computerirrespective
ofits operating
system(OS). Data from
the pressure sensors, temperature sensors andflow
meters are recorded and stored
in
theform
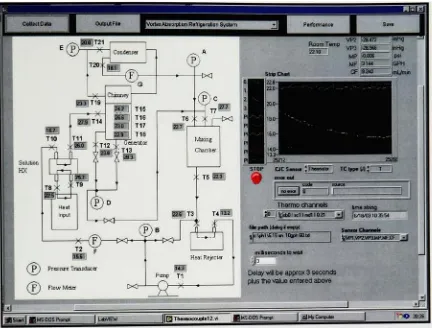
of a textfile using Labview. The developed
software provides an analysis of the vortex generator, condenser and mixer
based
on theaveraged values ofthe
steady
statedata
takenfrom
the experiment.The
bottlenecks in
thewhole system could
be identified using
thedeveloped
software, which shouldhelp
in
optimizing
the system.Conservation
ofmass,momentum andenergy
when appliedto theindividual
components ofabsorption refrigeration system with appropriate assumptions resulted
in
the mathematicalmodels
for
theconventional and vortex absorption refrigeration system.These
models were2
CHAPTER
TWO
ABSORPTION
REFRIGERATION
2.1
DESCRIPTION
OF ABSORPTION REFRIGERATION CYCLE
Absorption
refrigeration wasfirst developed in
19thcentury, and
is very
reliable as allits
componentsare static with theexception of a solution pump.
Its dynamic
characteristics arevery
stablebecause heat
and mass transfer govern thedynamics. Conventional
absorptionrefrigeration system
has
six major componentsnamely
evaporator, absorber, generator,condenser,
heat
exchangerand asolution pump.An
absorption refrigeration cycleis defined
as"heat-operated
cyclesin
whichsecondary
fluid (the absorbent)
absorbstheprimary fluid (gaseous
refrigerant)thathas been
vaporizedin
theevaporator"
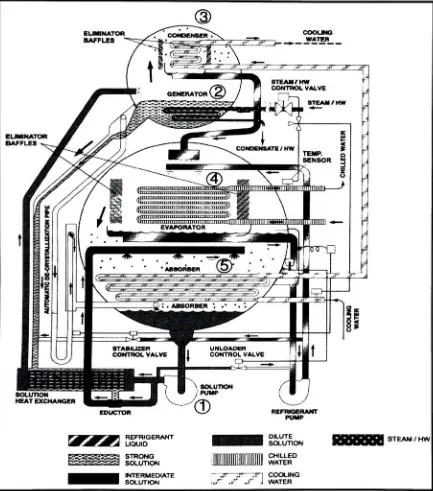
[3]. In
conventionalLithium
Bromide- water(LiBr-water)
absorptionrefrigeration cycle, as shown
in Figure
2-1,
the refrigerantis
water and the absorbentis
Lithium Bromide. The four
components that exchangeheat energy
outside the system arethe condenser, generator, evaporator and absorber.
The
system operatesbetween
twoworking
pressures thehigh-pressure
side and thelow-pressure
side.The
generator andapproximately
close to6 kPa
at thehigh-pressure
side and0.8 kPa
at thelow-pressure
endfor
a solution concentrationbetween 40%
to60% Lithium Bromide-water
solutionentering
theabsorberthen
leading
to thegenerator.ELIMINATOR
BAFFLES
COOUNO WATER
ELIMINATOR
BAFFLES
EDUCTOR
REFRIGERANT
LIQUID
INTERMEDIATE SOLUTION
PUMP
DILUTE SOLUTION
CHILLED WATER
COOLING WATER
[image:16.508.40.473.155.646.2]Liquid LiBr
solution presentin
the absorber atlow
pressurehas
high affinity for
watervapor and absorbs water vapor
emerging
out of the evaporator.Absorption
being
anexothermic process triggers phase change
from
vapor toliquid (takes
placesin
theabsorber).
This
absorbent-refrigerantliquid
solutionis
then pumped to the generator afterbeing
heated
through aheat
exchanger.In
the generator, wateris
separatedfrom LiBr
athigh
pressureusing
an externalheat
source toboil
water to steam,hence it is
ahighly
endothermic process.
Steam
goes to the condenser and theliquid LiBr hot
solution returnsback
to the absorber afterpassing
through an expansion valve andloosing
heat
to therelatively
coldincoming
solution, thuspreheating
theincoming
solution.In
the condenser,refrigerant vapor
is
condensed to a saturatedliquid
stateby loosing
heat
to thecooling
water.
The
saturatedliquid
refrigerantin
the condenser enters the evaporator afterpassing
throughan expansion valve.
Heat
sourcefor
the generatoris generally high
temperatureheat. Generator heat
shouldbe
supplied above a temperature of
approximately 90C [4].
During
the separation of therefrigerant
from
theabsorbentin
the generatortheremaybe someoftheabsorbentmoleculeswith the refrigerant vapor evolved.
However,
thepossibility
of this phenomenaoccurring
with pure
LiBr is unlikely
sincetheboiling
point ofpureLiBr
is 1282C
[4],
andhence
canbe
neglected.Since LiBr
crystallizes at moderate temperatures and wateris
the refrigerant,the system cannot
be
usedfor
applicationsbelow
0C.
Typically
these systemshave
a2.1.1
Components
ofAbsorption Refrigeration Cycle
Solution
Pump
-A dilute lithium bromide
solution
is
collectedin
thebottom
of theabsorber shell.
From
here,
a solutionpump
moves the solution through aheat
exchangerfor
preheating.
Figure 2-2
shows such a solution pump.SOLUTION HEAT EXCHANGER
Figure
2-2 Solution
Pump
(York
Intl)
Generator
-After exiting
theheat
exchanger, thedilute
solution movesinto
theupper shell.The
solutionsurroundsabundle
oftubes,
which carries eithersteamorhot
water.The
steamor
hot
water transfersheat into
the pool ofdilute lithium bromide
solution.The
solutionboils,
sending
refrigerant vapor upwardinto
thecondenser andleaving
behind
concentratedlithium bromide. The
concentratedlithium bromide
solution movesdown
to theheat
exchanger, where
it
is
cooledby
theweak solutionbeing
pumpedup
tothegenerator.Figure
STEAM/HW
CONTROL
VALVESTEAM/HW
Figure 2-3
Conventional Generator
Condenser
-The
refrigerant vapor migrates to the condenser tube
bundle. The
refrigerantvapor condenses on the tubes.
The heat is
removedby
thecooling
water, which movesthrough the
inside
of the tubes.As
the refrigerant condenses,it
collectsin
a trough at thebottom
ofthecondenser asis
shownin Figure 2-4.
1
*COOUNO
WATER
STEAM/HW CONTROLVALVE
STEAM/HW
Figure
2-4 Condenser (York
Intl)
Evaporator
-The
refrigerant
liquid
movesfrom
the condenserin
the upper shelldown
toliquid boils
atapproximately
3.6C,
creating
the refrigeration effect.Figure
2-5
representssuch an evaporator.
EUMMATOK BAFFLE!
Figure 2-5 Evaporator (York
Intl)
Absorber
-As
the refrigerant vapor migrates to the absorberfrom
the evaporator, thestrong lithium bromide
solutionfrom
the generatoris
sprayed over thetop
ofthe absorbertube
bundle
as shownin Figure 2-6. The strong lithium bromide
solution pulls therefrigerant vapor
into
solution,creating
the extreme vacuumin
the evaporator.The
absorption of the refrigerant vapor
into
thelithium
bromide
solution also generatesheat,
which
is
removedby
thecooling
water.The
nowdilute lithium bromide
solution collectsin
the
bottom
ofthelower
shell, whereit flows down
tothe solution pump.The chilling
cycleFigure
2-6 Absorber (York
Intl)
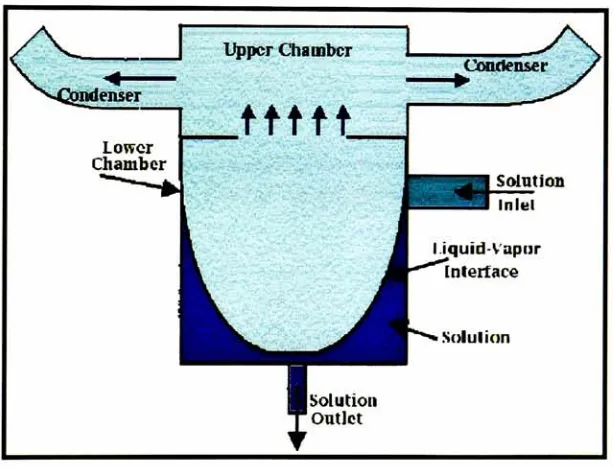
2.2 INTRODUCTION TO VORTEX ASSISTED GENERATOR
The
schematic of the proposed vortex generatoris
shownin Fig.2-7. It
comprised of twochambers, the
lower
and upper chambers.The lower
chamberis
cylindrical with a tangentialinlet
and tangential and a central outlet atbottom
of the cylinder.The
refrigerant-absorbentliquid
solutionis
pumpedat ahigh velocity
ofapproximately30m/s
throughthe tangentialinlet
nozzle at a pressureclosetosaturationpressure, the
fluid
undergoes aswirling
motioninside
thechamber.
Due
to theconservation ofrotationalmomentum, thepressureis
reducedatthecenterat the chamber.
As
thereis
a reduction of pressure at the center,hence
the refrigerant vaporemerges out of the solution at a
lower
temperature.The
refrigerant-depleted solutionin
thelower
chamberflows
throughthe central outlet to theabsorber.After
therefrigerant vapor getsseparated
from
the refrigerant-absorbent solutionit
enters the upper chamber.The
absorbentthe
bottom
part and radial outlet atthe top.The
refrigerant vapor evolvedin
thelower
chamberenterstheupper chamber through thiscentral
inlet
and undergoes a pressure recovery.After
thepressure
recovery
in
the upper chamber the refrigerant vapor enters the condenser through theoutlet
in
theupper chamber ofthe vortex-assistedgenerator.enser
Lower Chamber
Upper Chamber
ttttt
Condenser
Solution Inlei
Iiquid-Vapur Interface
Solution
Figure
2-7
Simple Schematic
ofVortex
Generator
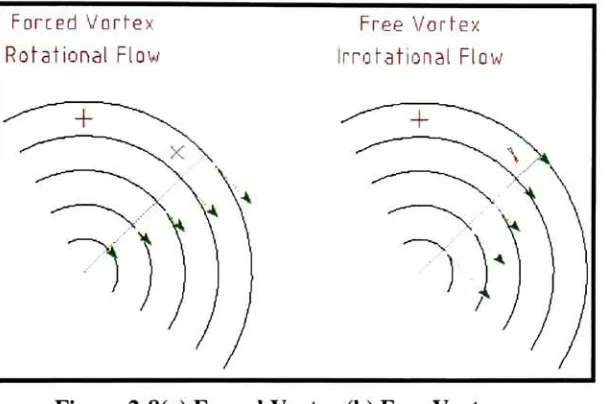
2.3
VORTEX FLOW THEORY
Ideally
there are twodifferent
types of vortexflow,
namely forced
vortex andfree
vortex.A
forced
vortexinduces
aflow in
thesurrounding
fluids,
which movesin
concentric circles about [image:22.508.108.415.208.442.2]vortex core and
in
which thefluid velocity
inversely
proportional to radius.Fig.
2-8(b)
illustrates
afree
vortexflow.
Forced
Vorfex
Rotational Flow
Free Vortex
Irrofational Flow
Figure
2-8(a)
Forced Vortex
(b)
Free Vortex
In many
applications vortexdue
to tangentialentry
of ahighly
viscousfluid
at avelocity
approximately 30
m/sinto
thechamber[6],
is
acombination offorced
andfree
vortex.LiBr-Water
solutionis
highly
viscous and theflow
producedby
tangentialinjection
in
to thevortex chamber produces a combination of
free
andforced
vortex(Appendix
C)
[7]. In
thevortex generator the
velocity increases
with radiusup
to a critical radius, anddecreases
from
[image:23.508.109.412.101.303.2]<L>
ITi Xfl
t-i
Ph
4
Free Vortex Region
Forced
Vortex
Region
1
1
1
1
1
1
1
Pressure
r
o o
TJ
V
>
Forced
Vortex
Region
V=w*r
Free Vortex Region
Transition
Radius,
r
2.3.1
Velocity
Distributions
Velocity
in
a vortex motion couldbe
resolved underthree componentsnamely
vertical or axialvelocity, radial
velocity
andtangentialvelocity
as shownin Figure 2-10. The
most significantcomponent
among
theseandhence
subjectedtomoststudy is
thetangential velocity.At
the point ofentry in
to the vortex chamberfluid
particle's motionis entirely
tangentialhowever
afterwardsit
startsmoving radialy inward due
to the pressuredifferential. As
aresult of this
radialy inward
movement towards the vortex core the particle's tangentialvelocity decreases
asit begins
to pickup
some axial velocity.At
some timeduring
it's
inward
travel the particle crosses a threshold where the centrifugalforce pushing
outis
equal to the pressure
pushing
in,
this thresholdis
called theinner
radius.By
the time thefluid
particle reachestheinner
radiusboundary
it
has
circledthecoredozens
oftimes.AxialVelocity
2.3.2 Tangential
Velocity
The
tangentialvelocity
of thefluid
in
afree
vortexincreases
as the radiusdecreases
whenstarting from
thefree
vortex wall.Assuming
thereis
complete conservation of momentum andthe axial
velocity
is negligible,
from continuity
equation we get.VR
=constantHowever
whenthefluid
is
liquid
therelationship
changesto(1.1)
VRn
=constant V.
Rn
(1.2)
Here
thevalue of n rangesfrom
0.5
to1.
Thus it
canbe
seen that asR
approaches zeroV
approachesinfinity. This does
not occurin
practice as
velocity
obtains a maximum value at a centralR
andbegins
tofall
withfurther
decrease
in
radius.The relationship in
this casebecomes corresponding
to constant angularvelocity,that
is
solidbody
rotation.^
1
)
r.d*
|
Y
^
\
1
r+dr)d<
I
1
\
\
\
In Fig.2-11
[8],
if
the pressure at the radius ris P
hence
the at radius r = r +dr the pressuref
dP
^becomes
Pr+dr
=P
+dr orThe
net pressuredrop Pr
r+drHF*
(r dcp
+dx
dip)-p.r.dy balances
thecentrifugal(
l
acceleration oftheelement p r+
dr
A
2
dq>dr.
V2
1
,r+-dr
2
Neglecting
second orderterms thisbecomes
=-.
dr
rIntegrating
the above equation overr=R0andr=Rc
andusing
therelationship
VRn
=C
(constant
)
andAssuming
p=constant.CV2 RCC2
Jap=pJ^=pJ^
R-P=-P-C2 Lc *02xnxD
2n 2nAlso C
=VRn=V'AV V J if
a=-V:
=axV; x ,2,AP
2xn
'D
^2n,
D0
,This
equationis
applicableonly in
situations ofsteady
state andinviscid flows. However
LiBr-water solution
is
avery
viscous solution,hence
to calculate the pressuredrop
in
thevortex-assisted generator will not give accurate results.
To
get a more accurate valuefor
the pressuredrop
toward thecenterin
thevortex-assisted generator combined model offorce
andfree
vortexmust
be investigated. No
such experimentalinvestigation has been
carried outbefore for
theflow
characteristics ofLiBr
solutionin
a vortex chamber.Developing
a modelfor
a complexcombined vortex
flow
woulddepend
heavily
on use ofexperimentaldata. Restrictions due
tothe complex nature of the problem and
lack
ofany
exhaustive experimentalinformation
3
CHAPTER
THREE
SOFTWARE
DEVELOPMENT
3.1
COMPONENT MODELLING
The
objective of this workis
todevelop
aflexible
user-oriented application, thus the codedeveloped had
tobe
modularin
nature, to enable the user tospecify different
cycleconfigurations and
hence different operating
conditions.A
typical absorption refrigerationsystem
is
comprised of a number of standard componentslike
absorber, evaporator,generator, condenser, solution
heat
exchanger and solution pump.Each
of thesebasic
components
is
simulatedby
providing
the mathematical expressionsgoverning
the processcharacteristics
in
that component.Equations
such as conservation of mass ofeach species,momentum and
energy
were used todevelop
anunderstanding
of processin
each of theabove mentioned components.
The
thermodynamic properties of theworking fluids
areevaluated
using different
functions,
depending
upon thegoverning
equationsprevailing in
thecomponentthese
function
are called upon.Each
oftheabovementioned componentsis
treated as a control volume, withits
owninputs
and outputs.
The governing
equations that were applied to each of these components toConservation
ofTotal Mass:
EMi=
(3.1)
i
Conservation
ofMass for
eachspecie(LiBr, Water,
Steam):
EMiXi=0
(3.2)
i
Conservation
ofEnergy:
Mihi=
(3.3)
i
Shown below is detailed
explanation ofhow
thesegoverning
equation were appliedto eachofthe
individual
components.3.1.1
Absorber
A strong liquid
solutionrich in
absorbent concentrationby
weight enters the absorber asrepresented
by
state point6
in Fig. 3-1. This strong
solution comesin
contact with therefrigerant vapor
coming from
theevaporator representedby
state point10 in Fig. 3-1
andabsorbsthisrefrigerant vapor.
Since
absorptionis
an exothermic processcooling is
providedin
theabsorberby
shownin Fig.
3-1
asQ. After getting
cooledthe solution exits absorber as6J
1
10
?
ABSORBER
1
Q
rFigure 3-1 Absorber Mass
andEnergy
balance
Mass Balance:
overallM6+M10-M,
=0species
M6X6
+M10X10
-M,X,
=0
Energy
Balance:
M^.
+M.oh.Q-M^^Q
(3.4)
(3.5)
(3.6)
3.1.2 Generator
The
generatoris described schematically in Fig. 3-2. A
weakliquid
refrigerant-absorbentsolution enters the generator as shown
by
state point3. This
weakliquid
solution receivesheat input from any
process exhaust representedby
Qi
in
thefigure. Due
to theheat input in
the generator, refrigerant vapors emerge
from
the solution andleave
the generatorheading
for
condenser, thisis depicted
by
state point7 in
thefigure. This
canbe
more appreciatedby
the
fact
thatboiling
point ofLithium
Bromide(s)
in
1282
C. The strong
absorbentrich
solution returns totheabsorberas shown
by
state point4,
afterpassing
through thesolutionFigure
3-2
Generator Mass
andEnergy
balance
Mass Balance:
overallM7
+M4
-M3
=0
species
M7X7
+M4X4
-M3X3
=0
(3.7)
(3.8)
Energy
Balance:
M7h7+M4h4-M3h3
=Qinput
(3.9)
3.1.3 Solution
Heat Exchanger
The heat
exchangeris
shownin Figure 3-3 is
referred to as solutionheat
exchangerin
absorption refrigeration system's terminology.
The
hot liquid
absorbentrich
solutionreturning from
the generator enters the solutionheat
exchangerat point4 in Figure 3-3
andleaves
at point5
aftertransferring
heat
torelatively
cold absorbent-refrigerantliquid
solution
coming
out ofthe absorber.In
the cold side, the weak absorbent refrigerantliquid
HEAT-
EXCHANGER
Figure 3-3 SHX Mass
andEnergy
balance
Energy
Balance:
M4(
h4
-h5)
=M2(
h3
-h2)
(3.9)
Effectiveness
(e):
s=-P^
OR
)4Tg(
(T4-T2)
(T4-T2)
(3.10)
3.1.4 Condenser
Shown in Figure
3-4,
is
schematicdescription
of acondenser.Water
vapor thatis
saturatedor superheated atthecondenser pressure enters at state
7. If
superheated,it is
first
cooled tothe
condensing temperature,
the condensation process takes placebetween
condensing
temperature and state point
8.
Q
in
theFig.3-4
depicts
thecooling
waterload
for
thisprocessQ
CONDENSER
7
i
8
Figure
3-4
Condenser Mass
andEnergy
balance
Mass Balance:
overallM7
-M8
=0
(3.11)
Energy
Balance:
M7(h7-h8)=Q
(3.12)
3.1.5
Evaporator
Figure 3-5
shows a schematic representation of a typical evaporator.A
subcooledliquid
orsaturated vapor-liquid mixture enters the evaporator at point
9
as shownin
theFig. 3-5. If
subcooledthe
liquid
first
reachestheevaporationtemperature,
the evaporationprocesstakesplace at this temperature.
The heat for
this process of evaporationis
known
as therefrigeration effect and
is depicted in
theFigure
3-5
asRE. After evaporating
water vapor^
9
EVAPORATOR
10
jL
RE
Figure
3-5
Evaporator Mass
andEnergy
balance
Mass
Balance:
overallM9
-M10
=0
(3.13)
Energy
Balance:
M9(h10-h9)=RE
(3.14)
3.1.6
Valve
The
expansion valveis schematically described in Figure 3-6 below. Liquid
orliquid-vapor
mixture enters the expansion valve at state point
5 in
thefigure
and expands to alower
pressure
yielding
saturated vapor orliquid-vapor. After expanding
to alower
pressureit
f(High Pressure)
ILow
Pressure)
Figure 3-6 Expansion Valve
Mass Balance:
overallM6
-M5
=0
(3.15)
Energy
Balance:
M6(h6-h5)=0
(3.16)
3.1.7
Pump
The
solutionpump is schematically described in Figure 3-7 below. Liquid
stream atlow
pressure enters the
pump
at state point 1in
thefigure,
andis
pumpedto ahigher
pressure.After attaining
ahigher
pressuredue
to pumping, theliquid
exitsthepump
at state point2 in
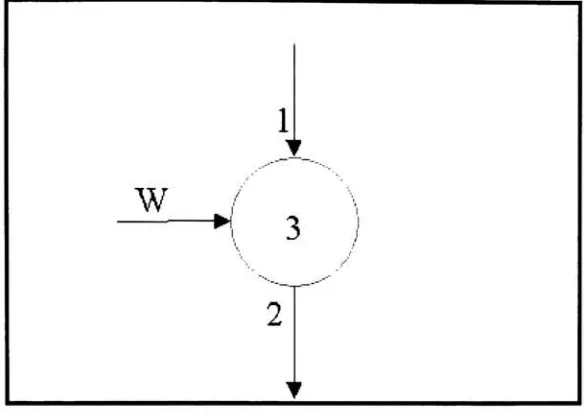
Figure 3-7. M
andW
representthemassflow
rate andthepumping
powerrespectively
for
Figure 3-7 Solution
Pump
3.2 NUMERICAL
SCHEMES
FOR
PROPERTIES
OF LiBr SOLUTION
3.2.1
Enthalpy
Knowing
the solution temperature and solution composition at a given point the saturationenthalpy
of the solution at that pointis
found.
This
correlation was takenfrom
a paper onNumerical Fits
of theProperties
ofLithium Bromide-Water
Solutions,
publishedin ASHRAE
Transactions [9]. It is
an extension ofthe workthatcurrently
appearsin
theRefrigerants
sectionofthe annual
ASHRAE
Fundamentals,
originally
publishedby McNeely
in 1979. Shown below
is
aJAVA
function
which takes two parameters ofJAVA double
type of variablerepresenting
temperature
(TO
in
C
andconcentration(Xi)
in %
by
weight ofthe solutionrespectively
at agivenpoint and returnsthesaturation
enthalpy
(h)
atthatgivenpoint as aString
typevariable.The JAVA function
presentedbelow
representstheformula
shownbelow:-h^^n^+bn^T
+
C.X-T2
(3.18)
n=0
Where h is
thesaturationenthalpy in
U/kg
atgiventemperature(T)
in
C
andconcentration(X)
in %
by
weight.Values
ofan,b
andcnare providedbelow
ao=-2024.33;ai=163.309;a2=-4.88161;a3=0.06302948;a4=-0.0002913705;
bo=18.2829;bi=-1.1691757;b2=0.03248184;b3=-0.0004034184;b4=0.0000018520569;
c0=-0.0370082
14;c
,=0.0028877666;c2=-0.000081313015;c3=0.000000991 16628
;c4=-4.4441207e"09;
double
ah3=0.06302948;
double
ah4=-0.0002913705;
double bh0=l
8.2829;
double bhl=-l.
1691757;
double
bh2=0.03248184;
double
bh3=-0.0004034184;
double
bh4=0.00000
18520569;
double
ch0=-0.037008214;
double
ch1=0.0028877666;
double
ch2=-0.0000813
13015;
double
ch3=0.00000099116628;
double
ch4=-4.4441207e-09;
double ttl=tl;
double
xxl=xl;
double
suma=ahO + ahl * xxl + ah2 *Math.pow(xxl,2)
+ ah3 *Math.pow(xxl,3)
+ah4*Math.pow(xxl,4);
double
sumb=bhO
+bhl
* xxl +bh2
*Math.
pow(xx
1,2)
+bh3
*Math.pow(xxl,3)
+bh4*Math.pow(xx
1
,4);double
sumc=chO + chl * xxl + ch2 *Math.pow(xxl,2)
+ ch3 *Math.pow(xxl,3)
+ ch4*Math.pow(xx1
,4);enthalpy=suma + sumb
*ttl+
sumc*Math.pow(ttl,2);
String
Senthalpy;
Senthalpy=Double.toString(enthalpy);
return
Senthalpy;
}
The
totalenergy
content ofthe saturated solution(E)
in kJ/s
orkW
at a given temperature(T)
and concentration
(X)
is determined
by
multiplying
the specificenthalpy
(h)
calculated aboveby
massflow
rate ofthe solution(m)
in
kg/s
at that point.Shown below is
aJAVA
function
that provides the total
energy
as outputby
taking
twoinput
parameters;first
being
specificenthalpy
in
astring
format
and second as massflow
rate asdouble
type ofdata. This function
returnsthetotal
energy
contentas a string.public
String Energy(String
Senthalpy,double
mass){
Float
fenthalpy=Float.valueOf(Senthalpy);
double energy
.enthalpy;enthalpy=fenthalpy.doubleValue();
return
Senergy;
}
3.2.2 Saturation
Temperature
Knowing
the solution pressure and solution composition at a given point the saturationtemperature ofthesolution at thatpoint
is
found.
This
correlationis
also takenfrom
apaper onNumerical Fits
oftheProperties
ofLithium
Bromide-Water
Solutions,
publishedin ASHRAE
Handbook [9]. It is
also an extension of the work thatcurrently
appearsin
theRefrigerants
section of the annual
ASHRAE
Fundamentals,
originally
publishedby McNeely
in
1979.
Provided below is
aJAVA
function
that takes twoparameters ofJAVA double
typeof variablerepresenting
pressure(P)
in kPa
and concentration(X)
in %
by
weight of the solutionrespectively
at a given point.Based
on theseinput
parameters thefunction
calculates thesaturationtemperature
(Tsat)
in
C
atthatgiven point as adouble
type variable.The JAVA function
presentedbelow
representstheformulas
shownbelow:
-2xe
d
+[d2-4e(C-logP)]u
T'=
, ., , _ , ^l0,
(3-19)
T
=Jb/+anxT
(3.20)
n=0
Where T is
the saturation temperaturein
C
at the given pressure(P)
in kPa
and concentration(x)
in
%
by
weight.Values
ofan,bn
, c,d
ande areprovidedbelow
ao=-2.00755; a,=0.16976; a2=-0.003
133362;
a3=0.0000197668;
public voidtsat(doublep,doublex)
{
double
tsat;
double
c=7.05;double
d=-1596.49;
double
ee=-104095.5;
double a0=-2.00755;
double
a1=0.
16976;
double
a2=-0.003133362;
double
a3=0.0000197668;
double
b0=124.937;
double
bl=-7.71649;
double b2=0.
152286;
double
b3=-0.00079509;
try{
double
suma=a0+ al*x +a2*Math.pow(x,2)
+a3*Math.pow(x,3);
double
sumb=b0+bl*x
+b2*Math.pow(x,2)
+b3*Math.pow(x,3);
double
tp=-(2.0*ee/(d+Math.pow(d*d-4.0*ee*(c-Math.log(p)/Math.log(10.00)),0.5)))-273.15;
tsat=sumb+tp*suma;
}
catch(Exceptione)
{
System.out.println("Error");
}
}
Once
the saturation temperatureis known
at the given pressure and solution composition, wecan calculate the specific
enthalpy
(h)
at the given pointby
calling
theEnthalpy
function
provided
in
the previous section ofthis thesis.After
the specificenthalpy
(h)
ofthe solutionis
found
this valueis
multipliedby
the massflow
rate ofthe solution andtotalenergy is
obtained.Hence,
for
a given solution pressure andconcentration at a pointthe totalenergy is
obtainedby
3.2.3
Saturation
Pressure
If
the solution temperature and solution composition at a given pointis known
the saturationpressure of the solution at that point can
be found.
This
correlation was takenfrom
apaperonNumerical
Fits
oftheProperties
ofLithium Bromide-Water
Solutions,
publishedin ASHRAE
Transactions
[10].
This is
also an extension of the work thatcurrently
appearsin
theRefrigerants
section oftheannualASHRAE
Fundamentals,
originally
publishedby McNeely
in
1979. Shown below is
aJAVA
function
which takes two parameters ofJAVA
double
type ofvariable
representing
temperature(TO
in
C
and concentration(X)
in
%
by
weight of thesolution
respectively
at a given point and returns thePressure
(P)
in kPa
atthat given point as aString
typevariable.Since
the saturation temperature and solution composition areknown,
we can calculate thespecific
enthalpy
(h)
at the given pointby
calling
theEnthalpy
function
providedin
previoussection of this thesis.
After
the specificenthalpy
(h)
of the solutionis found
this valueis
multiplied
by
the massflow
rate ofthe solution and totalenergy is
obtained.Hence,
for
a giventemperature andconcentration ofthe solution at a point the total
energy is
obtainedalong
withthesaturation pressure
by
using
theabove procedure.The JAVA function
presentedbelow
representsthe equations shownbelow
:-(T-JXX")
o(i>nx-)
oWhere P is
thepressurein
kPa,
T
andT'
arethesolution andrefrigeranttemperatures
C
andK
T'=
^
(3.21)
alsoLogP
=C
+ +^j
(3.22)
D
E
+
ao=-2.00755;ai=0.16976;a2=-0.003133362;a3=0.0000197668;
b0=124.937;bi=-7.71649;b2=0.152286;b3=-0.00079509;
c=7.05;d=-1596.49;e=-104095.5;
public
String
pressure(doublet,double x){
double
press;double
a0=-2.00755;double
al=0.16976;
double
a2=-0.003133362;
double
a3=0.0000197668;double
b0=124.937;
double
bl=-7.71649;
double b2=0.
152286;
double
b3=-0.00079509;
double
c=7.05;double
d=-1596.49;
double
ee=-104095.5;double tpk;
String
Spress="";
try{
double
suma=aO+al*x+ a2*Math.pow(x,2)
+a3*Math.pow(x,3);
double
sumb=bO+bl*x
+b2*Mafh.pow(x,2)+
b3*Math.pow(x,3);
double
tp=(t- sumb)/(suma);tpk=tp+273.15;
press=Math.pow(10,(c+d/tpk+ee/(Math.pow(tpk,2))));
Spress=Double.toString(press);
}
catch(Exceptione)
{
System.out.println("ERROR");
}
return
Spress;
}
3.2.4 Solution
Density
of the
Properties
ofLithium
Bromide-Water
Solutions,
publishedin ASHRAE Transactions
[10]. This is
also an extension ofthe work thatcurrently
appearsin
theRefrigerants
section ofthe annual
ASHRAE
Fundamentals,
originally
publishedby McNeely
in 1979. Shown below is
a
JAVA function
which takes two parameters ofJAVA
String
type of variablerepresenting
temperature
(TO
in
C
and concentration(X)
in %
by
weight of the solutionrespectively
at agiven point and returnsthe
density
(p)
in
kg/m3atthatgiven point as a
Double
typeofvariable.Once
thedensity
of solutionis
known,
we can calculatethemassflow
rateatthe givenpointby
multiplying it
with the volumetricflow
rate availablefrom
theflow
meters placedin
the teststand.
After
thespecificenthalpy
(h)
ofthesolutionis
found
thisvalueis
multipliedby
themassflow
rate of the solution and thus the totalenergy is
obtained.Hence,
for
a given solutiontemperature and concentration at a point the total
energy along
with thedensity
is found
by
using
theaboveprocedure.The JAVA function
presentedbelow
representstheequations shownbelow:-p
=a+a,X+a2X2-(b
+cX)
(3.23)
Where
p
is
thedensity
in
kg/m3,
T
andX
are the solution temperatureC
andconcentration(X)
in
%
by
weightrespectively.Values
ofan,b
and c areprovidedbelow
a=1145.36;ai=4.7084;a2=0.
137479;
b=33.3393;c=0.571749;
public
double
LiBr_Density(String t,String
x)density=1145.36+(4.7084*xl)+(0.137479*xl*xl)-(((temp+273)/(100))*(
33.3393+0.571749*xl));
return
density/1000;
}
3.2.5 Solution
Specific
Heat
For
a given solution temperature and composition at a given point, the specificheat
of thesolution at that point can
be
found.
Shown below is
aJAVA function
which takes twoparameters of
JAVA
double
type of variablerepresenting
temperature(T)
in
C
andconcentration
(X)
in %
by
weight ofthe solutionrespectively
at a given point andreturns thespecific
heat
(Cp)
in kJ/kg-C
at that given point as adouble
type of variable.In
thefunction
shown
below,
thefirst
input
parameteris
temperatureat thatgiven point andthesecondinput is
the solution composition at that point.
The
enthalpies of solution are calculated at the givensolution composition
(X)
and attemperaturesof0.00005
C
oftheinput
temperature(T).
Difference
oftheseenthalpy
valuesis
divided
by
0.0001 in
orderto obtainthe rate of change ofenthalpy
with respect to temperature at the given solution composition.This
rate of changerepresentsthespecific
heat
ofthesolution atthatsolution temperature(T)
and composition(X).
The JAVA function
presentedbelow
representsthefollowing
set of equations:AT
=(T
+0.00005)-(T
-0.00005)
andCp
=(EnthalPy)t+o.oooo^(Enthalpy)t_aoooo5
^^
In
the above set of equationsT
represents the temperature of the solutionin
C
and(Cp)
representsthe specific
heat in
kJ/kg-C.Enthalpy
ofthe solutionin
U/kg
is
calculatedby
using
public
double
spheat(doublet,double x){
double dt
=0.0001;
double
tp
= t+dt/2.0;
double
tm=t-dt/2.0;
double
dhdt;
try{
double
hp
=stringconv(Enthalpy(tp,x));
double
hm
=stringconv(Enthalpy(tm,x));
dhdt
=(hp
-hm)/dt;
}
catch(java.lang.NumberFormafExceptione){
dhdt
=0.0;
}
return
dhdt;
}
3.2.6 Solution Composition
For
a given solution temperature and pressure at apoint, the composition ofthe solution atthatpoint can
be found. Shown below is
aJAVA
function
that takes two parameters ofJAVA
double
type ofvariablerepresenting
temperature(T)
in
C
and pressure(P)
in
kPa respectively
at a point andreturnsthe concentration
(X)
in
%
by
weightofthe solution atthatgiven point asa
double
type of variable.In
thefunction
presentedbelow
thefirst input
parameter representsthe temperature of the solution and the second
input is
the pressure of the solution.The
concentration ofthesolution
is
calculatedin
aniterative
manner, theinitial
value chosenfor
theconcentration of the solution
is 55%
by
weight.The initial increment step
sizefor
solutionconcentration
is
chosenas0.001
%
theconvergence criterion wassetfor
a residual value ofless
than
0.0001. At
the given pressure(P)
and a value of55%
solution composition the saturationthe concentrations of
Xi
(55%)
andX2 (X,+0.001)
is
obtainedby dividing
thedifference in
saturation temperatures
by
the changein
composition of solution(X2-X0- The
value ofX2
isstored
in
Xi
andX2
is
incremented
by
0.001. Thus
by keeping
theslopeoftheline
fixed, twenty
such
iterations
are performedin
order to traverse on this constant slope until the third poinlP(T,X)
falls
in between
theline
joining
the pointsPi
(Ti,X0
andP2(T2,X2).i
T
_P2
/TX2.T2)
P1 (X1.T1)
>
X
Figure 3-8 T-X
-PApproximation
The JAVA function
representsthefollowing
equation andis
clarifiedin
Fig
3-8:
JIZII)-^)
orX=X1
+(T-VX(X\"Xl)
(3-25)
(x-x.)
(x2-x,)
(t2-t)
public
double
xmsat(doublet, double
p){
double
n=0.0;
double
xdel=0.001;
double
eps=0.0001;
double
xnl=55.00;
double
txnl,xn2=0,txn2;xn2=xnl
+xdel;
txn2 =
tsat(p,xn2);
//m
xn2=xnl - xdel *
(txnl
-t)/(txn2
-txnl);
while
(Math.abs
(
xn2 - xnl)
>eps)
{
xnl =xn2;n = n+
1;
if(n==20){
xn2 =
-9999.0;
//Did
notconverge}
txnl =tsat(p,xnl);//m
xn2=xnl +
xdel; txn2=
tsat(p,xn2); //m
xn2=xnl +xdel *
(t-txnl)/(txn2
-txnl);
}
}
catch(Exception e)
{ System.out.print("ERROR");
}
returnxn2;}
3.3 Numerical Schemes
For
Properties
ofSteam
andWater
3.3.1
Enthalpy
For
a given temperature of steam at a given point, theenthalpy
of steam at that point canbe
found.
This
correlation was takenfrom
abook
on refrigeration onair-conditioning
by
Dr CP
Arora
[11],
publishedin 1997
by
McGraw-Hill. This
equationis
a numericalfit
of thedata
provided
in
steam tables.Shown below is
aJAVA
function
thathas
a singleinput
parameter ofJAVA double
type of variablerepresenting
temperature(T)
in
C
and returns theenthalpy
ofh
=2501
+(1.88 xT)
(3.26)
Where h is
thespecificenthalpy
in
kJ/kg
andtis
the temperaturein
C.
public
String
EnthalpySteam(double t)
{
double
enthalpy,energy;enthalpy=(2501)+(1.88*t);
String
Senthalpy;
Senthalpy=Double
.toString(enthalpy)
;return
Senthalpy;
}
The
totalenergy
content of steam(E)
in kJ/s
orkW
at a given temperature(t)
is determined
by
multiplying
the specificenthalpy
(h)
in U/s
calculated aboveby
massflow
rate ofthe solution(m)
in kg/s
at thatpoint.Provided below is
aJAVA
function
thatprovides the totalenergy
asoutput andtakes two
input
parametersfirst
being
specificenthalpy in
astring format
and secondas mass
flow
rate asdouble
type variable.This function
returns the totalenergy
content as astring.
public
String
EnergySteam(String
Senthalpy,double
mass){
Float
fenthalpy=Float.valueOf(Senthalpy);
double energy
,enthalpy;enthalpy=fenthalpy.doubleValue();
energy=mass*enthalpy;
String
Senergy;
Senergy=Double.toString(energy);
return
Senergy;
}
3.3.2 Saturation Temperature
provided
by
theInternational Association
for
theProperties
ofWater
andSteam
(IAPWS).The latest IAPWS
release and moreinformation is
available on theIAPWS
website atwww.iapws.org.
These
equations are a numericalfit
of thedata
providedin
regular steamtables.
Shown below is
aJAVA
function
thathas
a singleinput
parameter ofJAVA
String
type of variable
representing
pressure(P)
in
kPa
and returns the saturation temperature ofwater
(T)
in
C
atthatgiven point as aString
typeofvariable.The JAVA function
representstheformula
shownbelow:-T
=;
57-
273.15
(3.27)
d
+[d2-4xex(c-Log10p)]05
Where
tis
thesaturationtemperatureofwaterin
C
atthegiven pressure(P)
representedin kPa.
Corresponding
values ofc,d
and eare providedbelow:
If
the value ofpressure(P)
in
kPa is less
than or equals to the value of0.6108
kPa
then thecorresponding
values ofc,d
and e are c=9.4372027;d=-2609.
14446;
e =-7402.86714.Else,
if
thevalue the value ofpressure(P)
in
kPa is less
than orequalsto the value of101.33 kPa
then thecorresponding
values ofc,d
ande arec=7.08255409;d=-1624.
125012;
e=-100801.502.public
String
SafTempWater(String Sp)
{
double
C=0,D=0,E=0,p;
Float
fp=Float.valueOf(Sp);
p=fp.doubleValue();
p=p-0.008;
if(p<=0.6108)
{
C=9.4372027;
C=7.08255409;
D=-1624.125012;
E=-100801.502;
}
}
double tWat0,tWat;
try{
tWatO=-2*E/(D+Math.pow(Math.pow(D,2)-4*E*(C-Math.log(p)/Math.log(10)),0.5));
tWat=tWatO-273.15;
}
catch(Exception ex){tWat=0.0;}
String
StWat="";
StWat=Double.toString(tWat);
returnStWat;
}
3.3.3
Saturation
Pressure
For
a given temperature of water at a given point, the saturation pressure of water at thatpoint can
be
found. The function
alsouses theformulations
for
general and scientific usageprovided
by
theInternational
Association
for
theProperties
ofWater
andSteam (IAPWS).
As
mentioned above thelatest IAPWS
release and moreinformation is
available on theIAPWS
website atwww.iapws.org.These
equations are a numericalfit
ofthedata
providedin
regular steam tables.Shown below is
aJAVA
function
thathas
a singleinput
parameterof
JAVA
String
type ofvariablerepresenting
pressure(P)
in kPa
and returnsthe saturationtemperatureofwater
(T)
in
C
atthatgivenpointas aString
typeof variable.The JAVA function
representstheformula
shownbelow
:-lp
=Log(10)x c x4e
d2-
(
~2it +
273.15
And
p
= elpWhere P is
the saturation pressure representedin
kPa
at the given saturation temperature(T)
ofwater
in
C.
Corresponding
values ofc,dand
e are providedbelow:
If
the value of temperature(T)
in
C
is less
than or equals to the value of0
C
then thecorresponding
values ofc,d
and e are c=9.4372027;
d
=-2609.14446; e=-7402.86714.
If
the valueoftemperature(T)
in
C
is less
than orequals to the value of100
C
then thecorresponding
values ofc,d
and e are c=7.08255409;
d
=-1624.125012; e= -100801.502.
Else,
if
thevalue the valueoftemperature(T)
in
C
is
greaterthanthe valueof100
C
thenthe
corresponding
values of c,d
and e are c =7.097293315;
d
=-1656.057757; e =
90800.60157.
public
double
pWat(doublet)
{
double
lp,C,D,E;
double p
=0.0;
if (t
<=0.0) {
C
=9.4372027;
D
=-2609.14446;
E
=-7402.86714;
}
else
{
if (t
<=100.0)
{
C
=7.08255409;
D
=-1624.125012;
E
=-100801.502;
}
else
{
try
{
lp
=Math.log(10)*(C-(l/(4*E)*(Math.pow(D,2)-(Math.pow(((-2*E/(t
+273.15))-D),2)))));
p
=Math.exp(lp);
}
catch
(Exception
e){
p
=0.0;
}
return p;
}
3.4
Modeling
Absorption Chiller
withVortex Generator
An
absorption refrigeration system, with a vortex generatorusing
LiBr-Water
has
all thecomponents
in
a conventional absorption chillerexcept the generator.The
vortex generatorreplaces the conventional generator
in
an absorption refrigeration chiller.All
othercomponents arethe same as
in
aconventional refrigeration system.The
solutionis
pumpedin
at ahigh velocity
ofapproximately 30
m/s, enters the vortex chambertangentially.This
causes a
strong swirling flow
of the solutionin
the vortex chamber.This strong swirling
flow in
the generatorcauses a pressuredrop
towards the center ofthe generator.When
thepressure toward the center of the chamber
drops below
the saturation pressure of thesolution the refrigerant vapors emerge, thus the
separating
of the refrigerantfrom
theabsorbent.
In
order to augment the process ofvapor generationin
the generator someheat
energy is
also required.The
saturation temperature ofthe solutionis
afunction
of pressureand
decreases
withreducing
pressure, thus the separation of the refrigerantfrom
theabsorbenttakes place at a
lower
temperature toward the centerofthe vortex chamber.This
allows the use of waste
heat
available at alower
temperaturefor
separating
the refrigerantcomplexities associated
in
the mathematicalmodeling
of vortex generator as explainedin
chapter
2
of thisthesis,
an experimental test stand as explainedin
previous section wasbuild. Analysis
of the system wasdone based
the experimentaldata
obtainedfrom
the teststand.
Live
data
acquiredfrom
the test stand,using
sensors atdifferent
positions, wasfed
into
the computerusing Labview.