Elsevier Editorial System(tm) for Wear Manuscript Draft
Manuscript Number: IH-4416R1
Title: Determination of Surface and Subsurface Fatigue Damage in Dental Composites Article Type: Full-Length Article
Keywords: Composites; Dentistry, Subsurface damage; Fatigue; Microhardness Corresponding Author: Professor Lawrence Mair, BDS, PhD, FDS, FADM, FHEA. Corresponding Author's Institution: University of Central Lancashire
First Author: Pavinee Padipatvuthikul, DDS., MDentSci.
Order of Authors: Pavinee Padipatvuthikul, DDS., MDentSci.; Fadi D Jarad, BDS, PhD, MFDS RCSEng, DRD RCS.; Lawrence Mair, BDS, PhD, FDS, FADM, FHEA.
Abstract: Abstract
Dental filling materials are subjected to cyclic compression in the mouth. Nine resin-based composite filling materials were subjected to 2000 compression cycles between either 0 and 12 kg, or 0 and 40 kg. Surface deformation was measured as the diameter of the compression scar and surface
microhardness determined by a Vickers' microhardness test at 4 sites around the scar. Subsurface damage was stained with silver nitrate and the area of stain determined by image analysis software. Subsurface microhardness was measured at 4 sites around the stained zone. Surface deformation at 12 kg was inversely proportional to the surface microhardness at 12 kg. At both loads subsurface damage was directly proportional to the subsurface microhardness. Samples with small filler particles
We confirm that this paper is an original paper that has not been previously, nor simultaneously, in whole or in part, submitted anywhere else.
Determination of Surface and Subsurface Fatigue Damage in Dental
Composites
Introduction
Teeth and dental restorations are subject to cyclic loading during both eating and
at other times. Human beings often clench or grind their teeth together at times of
mental concentration or stress. The latter often occurs at night and is known as
bruxism. The forces applied to the natural teeth while eating may vary between
0.5 and 25 kg [1-3]; but during nocturnal grinding these forces may reach 80 kg
[4]. Besides causing of abrasion of the surface these forces can also initiate
cracks in the subsurface [5,6]. Today, dental resin composite materials are
commonly used to replace missing tooth tissue that has been worn away by
grinding [7-9]. They have the advantage that they can be directly stuck onto the
surface without requiring physical locking keyways to be drilled into the teeth [10].
Dental resin composite consist of glass filler particles embedded in a polymer
matrix based on an epoxy resin (Bisphenol A glycidyl methacrylate). The
functions of the fillers are to reduce the polymerization shrinkage on setting and
to increase wear resistance. The first composites were introduced in the mid 1960’s and advocated solely for fillings in the front teeth that are not subject to
heavy chewing forces. The fillers were relatively large quartz particles >50 µm in diameter. By the mid 1980’s a new generation of materials became available for
use in the back teeth that are subject to the forces of grinding and clenching.
These materials required radiopaque glass fillers to make them visible on
radiographs. The particle size had decreased to below 10 µm; that was still
relatively large compared to modern materials. Between 1985 and 1990 small amounts of colloidal silica (20 nm dia) were added to “fill in” gaps between the
glass particles. Materials containing glass particles and colloidal silica were called
hybrid composites. Between 1990 and 1995 the size of the glass particles was
reduced to around 1µm in diameter. Again these materials contained some
colloidal silica. They were called microhybrid materials and the majority of dental
composites currently available are of this type. Another type of composite is
based entirely on colloidal silica that has been agglomerated into pre-polymerised *Manuscript
particles during the manufacturing process. The materials are called microfilled
composites.
Dentists place composite fillings by pressing the material into the cavity with
small packing instruments. The packing force bring the resin to the surface so
that the surface layer tends to resin rich compared to the subsurface. Also, the
surface layer does not set as hard as the underlying material because free
radicals generated from the initiator system compete with oxygen in the
atmosphere giving rise to an oxygen inhibited layer on the surface [11, 12].
In 1981 Wu and Cobb developed a method to stain subsurface damage in resin
composites with silver nitrate [13, 14]. Silver ions (Ag+) penetrate through the
network of cracks and can subsequently be precipitated as colloidal ionic silver
(Ag) in the damaged zone. The color of the stained zones results from the
scattering of light by these colloidal silver particles according to Mie Theory for
the scattering of light by colloidal particles [15]. The purpose of this study was to
determine the area of surface deformation and subsurface damage in nine dental
resin composites caused by low cyclic fatigue. The values were related to the
composition and properties of the materials.
Materials and Methods
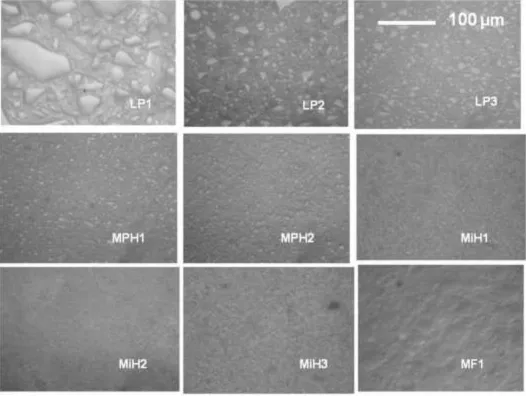
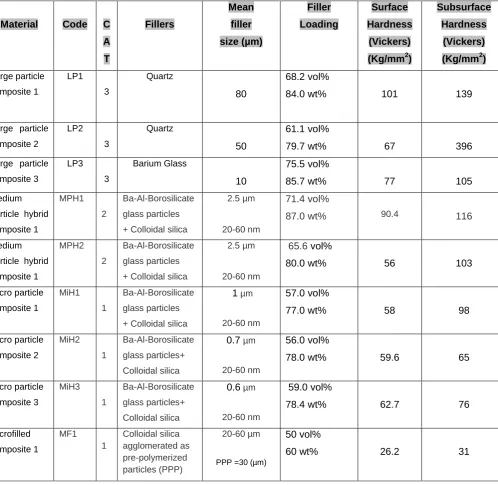
Nine dental resin composite filling materials were used in the investigation. The
materials are described in Table 1. For the purpose of statistical analysis the
materials are categorized as having Large, Medium or Micro particles. Figure 1
shows micrographs of the 9 materials to illustrate the particle size and
configuration.
Twenty disks of each of the materials were fabricated by condensing them into a
PTFE mould (diameter 7mm x 2.5mm). Seven of the materials were set by
photo-initiation whilst the remaining two were supplied as a two paste system and set
by chemical initiation after mixing. The specimens were subjected to 2000
compression cycles in a Universal Testing Machine (Nene Instrument,
Wellingborough, UK) using a rounded cone indenter. Ten specimens were cycled
was performed under water. A schematic of the apparatus is shown in Figure 2.
The testing machine recorded the increasing displacement of the indenter during
the test.
To determine the degree of surface damage the diameter of the compression
scar was measured with an eyepiece graticule, using an incident light microscope
(Photomicroscope II, Carl Zeiss, Oberkoken, Germany) with Differential
Interference Contrast (DIC) to enhance the boundary of the scar. Surface microhardness was determined by making four Vickers’ indentations around the
scar using a commercial microhardness tester (MPH, Carl Zeiss, Oberkoken,
Germany). The indentations were made with a load of 200 grams that was
allowed to stabilize for 30 seconds before measurement. This is standard test for
dental composites. The position of the surface scar and indentations is shown in
Figure 3A.
To determine the extent of subsurface damage after compression, the specimens
were immersed in AgNO3 (3 mol/L) for 72 hours. The specimens were then
sectioned through the indentation scar with a diamond cutting disk (Isomet,
Buehler UK, Coventry, UK.) to expose the subsurface. The sectioned specimens
were then embedded in PMMA and ground on silica carbide papers (240, 400,
600, and 1200 grit) to achieve a flat surface. Finally, they were polished on
microcloth with 50 µm alumina in an ultrasonic polishing machine (Vibromet
Polisher, Buehler UK, Coventry, UK).
The area of stained subsurface damage was examined with an the incident light
microscope using crossed polars to exclude directly reflected light and reveal the
color of the stain. Digital images were taken and the damaged zoned measured
using image analysis software (Sigma Scan Pro 5.0, SPSS, USA). The
microhardness of the composite surrounding the damage zone was measured in
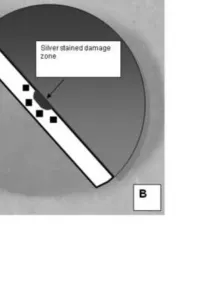
four areas with the microhardness tester. The position of the stained zone and
subsurface indentations is shown in Figure 3B.
Scheffe post hoc tests to determine homogeneous subsets (level p = 0.05).
Correlations between the four values: surface deformation, surface
microhardness, subsurface damage and subsurface microhardness, for the individual specimens, were made by Pearson’s Correlation coefficient.
Correlations between the categorized size of the particles and the degree of surface deformation and subsurface damage were determined by Kendall’s
Coefficient (tau-c).
Results:
Surface deformation
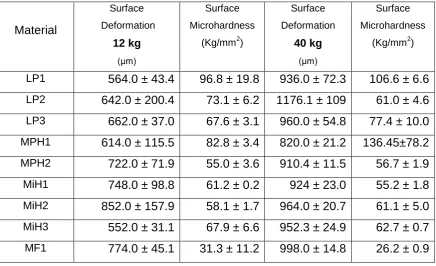
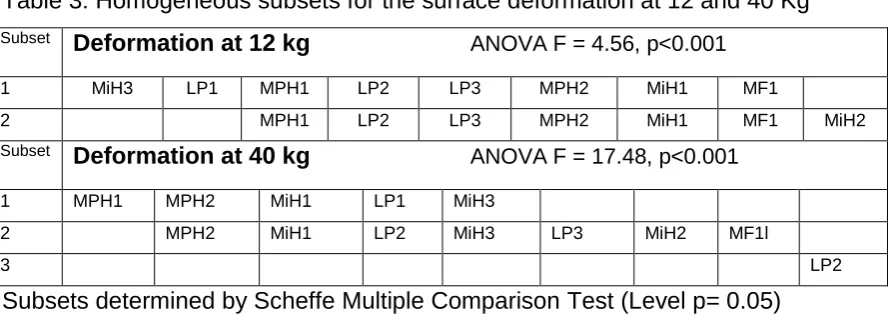
The values for the diameter of the deformation scar and surface microhardness
are given in Table 2. Table 3 shows the homogeneous subsets for surface
deformation.
These results shows that for all materials the size of the scar increased with the
increased load. The increase in size was not directly proportional to the increased
load.
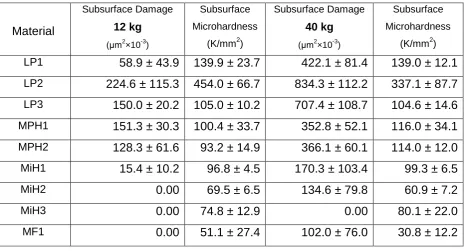
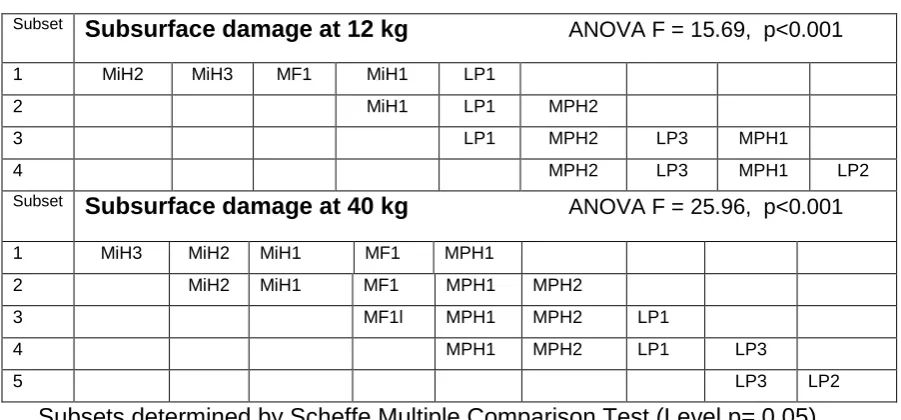
Subsurface damage
The values for the area of subsurface damage and subsurface microhardness
are given in Table 4 and the homogeneous subsets are shown in Table 5.
In terms of subsurface damage, at 12 kg there were four subsets with three of
materials showing no apparent damage. At 40 kg all the materials except MiH3
displayed some damage. The post-hoc test discriminated 5 subsets.
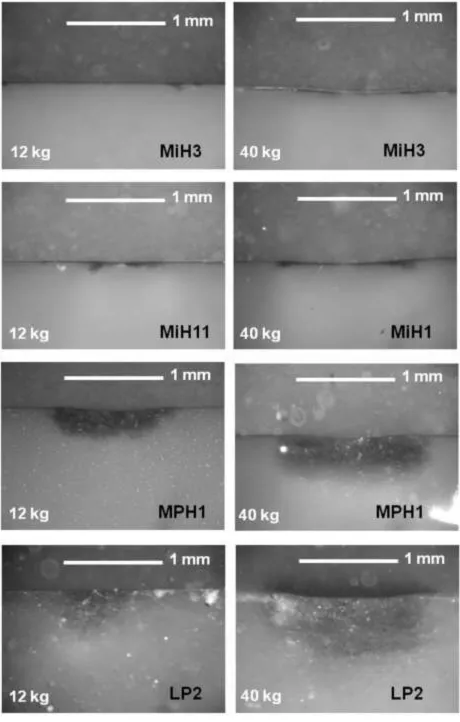
Figure 4 shows representative examples of the subsets indicated in Table 5. The
depression caused by surface deformation can be seen on the samples at 40 kg;
but not at 12kg.
Figure 5 shows a Scanning Electron Micrograph (x2000) of MPH1. Although
there are signs of debonding of the resin from the larger particles (arrowed) the
Statistical correlations
The correlations between for the experimental values of the individual samples
are given in Table 6
The correlation values (tau-c) between the categorized filler particle size and the
ranked deformation, damage and hardness values are given in Table 7.
The regression analysis indicated a significant inverse relationship between the
diameter of the deformation scar at 12Kg values (r=-0.51, p<0.001); but the value
was only just significant at 40Kg (r=-0.34 p=0.04). In terms of subsurface damage
there was a significant correlation between the degree of subsurface damage and
the microhardness of the materials. This was stronger at 40 kg than at 12 kg.
Discussion :
In this study silver nitrate was used to stain the zone of subsurface damage. It
has been shown that this technique can identify damaged zones that are not
apparent with scanning electron microscopy. The reason for this is that silver
nitrate is not a stain in the traditional sense of the word. The latter are essentially
dyes with large complex molecules that cannot penetrate into subsurface crazes
and cracks. Silver nitrate is a colourless liquid that penetrates as the silver ion
(Ag+). It is only after the silver has been reduced to ionic silver in the cracks and
crazes that the colour becomes apparent because of light scattering by these
particles that are 5-30nm in diameter [15].
Areas of silver staining similar to that show in Fig. 4 have been demonstrated in
actual fillings that had been removed for replacement after a number of years in
the mouth [16]. There was often a wear scar on the surface of the filling adjacent
to the subsurface stain.
It could be argued that the damage is not cumulative; but resulted from the initial “impact” of the indenter. This is unlikely because the depth (and therefore the
The results indicated that after 2000 compression cycles at 12 kg there was a
significant correlation between surface deformation and surface hardness. The
fact this correlation was much weaker at 40 kg can be explained because, as
discussed in the introduction, the surface of a dental composite is softer than the
bulk of the material because of the resin rich effect and oxygen inhibition of the
free radicals during conversion. As the overall depth of penetration at 12 kg was
less that at 40 kg the penetration of the indenter is more likely to be influenced by
the surface rather than the subsurface hardness. The deeper the penetration the
more the process is influenced by the subsurface hardness.
With the exception of MPH1, there was no significant difference between the
surface hardness values at the two loads and for some materials the mean
values at 40Kg was less than at 12kg (Table 3). The differences are just minor
differences in surface softness that can be caused by the packing pressure of the
composite into the mould as this influence the depth of the resin rich layer. The
large mean value for MPH1 resulted from a very high reading for one specimen. This can be caused if the Vickers’ microhardness indenter pressed directly on a
filler particle.
For all materials the degree of subsurface damage increased with the increased
load. For some materials there was almost 4 times the degree of damage at the
higher load. At 12 Kg there was no evidence of subsurface damage with three
materials based on microparticles. These materials were also in the lowest
subset for damage at 40 kg. The three large particle composites were all in the
largest subset at 40 kg. Again, there was no significant difference between the
subsurface hardness values between 12kg and 40 kg (Table 4). This militates
against the concept that hardness may increase because the particles are
compressed by flow of the materials during deformation.
Table 7 shows a high degree of correlation between the categorized particle size
and both the microhardness, surface deformation (at 12 Kg) and subsurface
damage. The hardness of the materials must be related to the filler size and
of the medium sized particle and micro particle composites is the same. The
statistical relationship was only significant if the materials were categorized into
large, medium and microfilled materials and correlated with the ranked values for
deformation and damage. The correlation between the values and the actual size
of the particles for the 9 materials was not significant. The fact that the microfilled
materials showed comparatively little damage, as identified by stain, may be
because the materials can deform elastically rather than nucleating fatigue
cracks.
Today clinicians use composites to cover the biting surface of worn teeth [17,18]. Clinical studies with the early dental resin composites in the 1970’s showed
excessive wear if these were used on the biting surface of the back teeth. These
early materials had large filler particles. By 1985 the fillers were in the medium
range. The results of a 10-year clinical trial indicated that these materials had
adequate wear resistance for the back teeth[19]. More recent studies have shown
that the new microhybrid materials also have an adequate wear resistance in the
mouth [20,21].
Conclusion:
Surface Deformation and Subsurface damage varied between different resin
composites. Overall, the softer the material surface, the more the surface
deformation. In contrast, the harder the subsurface, the more the subsurface
[1] T.R. Morneburg, P.A. Pröschel, Measurement of Masticatory Forces and
Implant Loads: A Methodologic Clinical Study, Int. J. Prosth. 15 (2002) 20-27.
[2] T. Haraldson, G.E. Carlsson, Bite force and oral function in patients with osseointegrated oral implants, Scand. J. Dent. Res. 85 (1977) 200-208.
[3] A.S. Guimaraes, G.E. Carlsson, S.K.N Marie, Bite force and handgrip force in patients with molecular diagnosis of myotonic dystrophy, J. Oral. Rehab. 34 (2007) 195-200.
[4] K.E. Nishigawa, E. Bando, M. Nakano et al. (2001). "Quantitative study of bite force during sleep associated bruxism." J Oral Rehabil 28 (2001) 485 – 491.
[5] L.H. Mair, T.A. Stolarski, R.W. Vowles, C.H. Lloyd, Wear: mechanisms, manifestations and measurement. J. Dent. 24 (1996) 141-148.
[6] L.H. Mair, Subsurface compression fatigue in seven dental composites, Dent. Mater. 10 (1994) 111-115.
[7] N.J Poyser, P.F.A Briggs, H.S. Chana, M.G.D Kelleher, R.W.J. Porter, M.M. Patel, The evaluation of direct composite restorations for the worn mandibular anterior dentition - Clinical performance and patient satisfaction, J. Oral. Rehab. 34 (2007) 361-376.
[8] D. Bartlett, G. Sundaram, An up to 3-year randomized clinical study comparing indirect and direct resin composites used to restore worn posterior teeth, Int. J. Prosth. 19, (2006) 613-617.
[9] C.D. J. Redman, K.W. Hemmings, J.A. Good, The survival and clinical performance of resin-based composite restorations used to treat localised anterior tooth wear, Brit. Dent. J. 194 (2003) 566-572.
[10] N.J.M Opdam,.F.J.M Roeters, The effectiveness of bonded composite restorations in the treatment of painful, cracked teeth: Six-month clinical evaluation. Oper. Dent. 28 (2003) 327-333.
[11] E.S. Shawka, A.C. Shortall, O. Addison, W.M. Palin, Oxygen inhibition and incremental layer bond strengths of resin composites. Dent Mater. 25 (2009) 1338-46.
[12] M.A. Gauthier, I Stangel, T.H. Ellis TH, X.X. Zhu, Oxygen inhibition in dental resins. J Dent Res. 84 (2005) 725-9.
[13] W. Wu, D. Cobb (1981). A silver staining technique for investigating wear of restorative dental composite restorations. Biomed Mater Res 15 (1981) 343-348.
[15] L.H. Mair The colors of silver with silver nitrate staining in dental materials. Dent Mater. 8 (1992):110-7.
[16] L.H. Mair Staining of in vivo subsurface degradation in dental composites with silver nitrate. J Dent Res. 70 (1991) 215-20.
[17] S. Nixon, P.J. Gahan, M.J. Chan, M.F. Robinson Techniques for restoring worn anterior teeth with direct composite resin., Dental update 35 (2008) 551-558.
[18] O El-Mowafy, O. D. Lewis, C. Benmergui, C. Levinton (1994). Meta-analysis on long-term clinical performance of posterior composite restorations. J Dent 22 (1994) 33-43.
[19] L.H.Mair, Ten-year clinical assessment of three posterior resin composites and two amalgams. Quintessence Int 29 (1998) 483-490.
[20] E.J. Swift Jr., A.V Ritter, H.O. Heymann, J.R. Sturdevant, A.D. Wilder Jr. 36-Month clinical evaluation of two adhesives and microhybrid resin composites in Class I restorations. American Jou. Dent. 21 (2008) 148-152
[21] S. Palaniappan, D. Bharadwaj, D.L. Mattar, M. Peumans, B. Van Meerbeek, P. Lambrechts. Three-year randomized clinical trial to evaluate the clinical
Figure 1
Figure 2
Figure 3
Figure 4
Figure 5
Responses to Referees
The referees comments were very helpful. We had written the paper primarily to introduce the technique of silver nitrate staining as a means to identifying damage in dental composites that cannot be identified by electron microscopy. Both referees commented that the paper was interesting. The referees correctly pointed out that we had overlooked some of the basic science. There is a danger that in making the revisions the original reason for submission would be lost. Nonetheless, we have altered the paper considerably in the light of the comments. It is clear from both referees comments that we did not give enough detail about the technique and , hopefully, this has been rectified. It is helpful to consider the second referees comments first.
Referee 2.
1. We have removed all the commercial names from the manuscript. However, whilst we hope that the majority of readers will not be dentists, the paper may be accessed by a few dental researchers. They would expect to see commercial names and batch numbers to compare with papers in dental journals. We have put these at the back of the paper. The editor can, of course, leave them out at his discretion.
2. There was no change in microhardness are a result of deformation. Table 2 & 4 show that the microhardness was not significantly different between the samples that had been cycled at 12 kg and the ones cycles at 40kg. The differences are just non -significant differences between samples. There was a difference between the
surface hardness and the subsurface hardness of the materials. This is because of the surface resin rich layer and the oxygen inhibition of the setting reaction at the surface. This has been more clearly explained in the text.
3. The text has been changed throughout to “low cycle fatigue”
4. Silver nitrate staining was the focus of my PhD (1990) and I have published a number of papers on this subject. The area of damage does increase with increasing cycles. In the present experiment the universal testing machine provided a screen display of overall displacement of the indenter showing that the depth of indentation increased with increasing cycles. Given its geometry (rounded cone) the increase in depth must be accompanied by an increase in volume. This has been included in the text.
5. The cited papers: L.H. Mair, The colors of silver with silver nitrate staining in dental materials, Dent. Mater. 8 (1992) 110-7. and L.H. Mair, Subsurface
compression fatigue in seven dental composites, Dent. Mater. 10 (1994)111-115 shows a number of SEM micrographs of the area stained by silver nitrate. There is normally no evidence of damage on the SEM which is why the silver technique is useful. We have now included a SEM for this paper. We have reemphasised that silver nitrate is not a dye in the traditional sense of the word. It penetrates into the damaged zone as ionic silver (Ag+). When it is reduced to metallic silver it forms colloidal particles in nano spaces in the material. The brown colour results from the scattering of light by these particles according to Mie Theory. It is not like black and white film where the grains are often microns in diameter. We have emphasised this and included the reference on the colours of silver.
6. I regret that I don’t understand the Hertz equation; but having looked it up I think that we would need to use a much more standard material to test this.
7. We have removed the diagrams and replaced them with a more detailed statistical analysis (Kendall’s tau-c).
Referee 1
1. This was a most helpful comment. We have changed Table 1 to give more information about the materials and included a statistical analysis of the results in relation to the size of the filler particles. A small point of misunderstanding in comments 5 and 7. This is not an etching technique. Etching means treating the material to open up pre-existing flaws. This is a staining or doping technique. As stated in Comment 5 above – it isn’t like using a dye because the AgNO3 penetrates as an ion rather than macromolecules like most dyes.
2. see 1 above
3. The load and time for the microhardness tests have now been included in text. It is true that the actual zone of damage may be larger than the stained zone. However, there is no way to show this. As stated under the response to Referee 1 (No 5) the silver staining technique indicated damage does not show on SEM. It is not possible to use TEM with these materials because the fillers do not cut cleanly in an
ultramicrotome. As composite are two phase materials there is a limit to the
magnification that is possible with SEM. The SEM included for this paper is x2000.
4. In this experiment we stained the specimens before sectioning; but in other
5. Whist we agree with this comment the resin rich layer has been known about for many years; but as yet, nobody has been able to quantify it. The depth of the resin rich layer is determined by the packing pressure when placing the composite as this brings the resin to the surface. This is not controlled in dentistry because it depends on the shape of filling. It changes from specimen to specimen. We have included the relevant references.
6. The original statistical analysis has been checked and the probabilities are as stated. In response to Comment 1 (above) the data was also correlated to the categorised particle size (Large, Medium, Micro) and, as the referee suggested, there was a highly significant relationship.
7. As stated in comment 3 we cannot demonstrate the presence of cracks because they do normally show on SEM. However, the images in Fig 6 clearly show that something has happened. Whether there are cracks or crazes depend on the definition of crazes. Kambour used silver nitrate to dope crazes in polycarbonate (Polymer 5 (1963) 143-155). This paper shows that AgNO3 can penetrate these pre-cracks.
I hope that these responses are helpful.
Lawrence Mair
Table 1: Dental resin composites used in this experiment
Material Code C
A T Fillers Mean filler size (µm) Filler Loading Surface Hardness (Vickers)
(Kg/mm2)
Subsurface
Hardness
(Vickers)
(Kg/mm2)
Large particle composite 1 LP1 3 Quartz 80 68.2 vol%
84.0 wt% 101 139
Large particle
composite 2 LP2 3 Quartz 50 61.1 vol%
79.7 wt% 67 396
Large particle
composite 3 LP3 3 Barium Glass 10 75.5 vol%
85.7 wt% 77 105
Medium
particle hybrid
composite 1
MPH1
2
Ba-Al-Borosilicate
glass particles
+ Colloidal silica
2.5 µm
20-60 nm
71.4 vol%
87.0 wt% 90.4 116
Medium
particle hybrid
composite 1
MPH2
2
Ba-Al-Borosilicate
glass particles
+ Colloidal silica
2.5 µm
20-60 nm
65.6 vol%
80.0 wt% 56 103
Micro particle composite 1 MiH1 1 Ba-Al-Borosilicate glass particles
+ Colloidal silica
1 µm
20-60 nm
57.0 vol%
77.0 wt% 58 98
Micro particle composite 2 MiH2 1 Ba-Al-Borosilicate glass particles+ Colloidal silica
0.7 µm
20-60 nm
56.0 vol%
78.0 wt% 59.6 65
Micro particle composite 3 MiH3 1 Ba-Al-Borosilicate glass particles+ Colloidal silica
0.6 µm
20-60 nm
59.0 vol%
78.4 wt% 62.7 76
Microfilled composite 1 MF1 1 Colloidal silica agglomerated as pre-polymerized particles (PPP) 20-60 µm
PPP =30 (µm)
50 vol%
60 wt% 26.2 31
LP = Large Particle
MPH = Medium Particle Hybrid
MiH = Micro Particle Hybrid
[image:20.595.82.581.92.577.2]Table 2: Results for the surface deformation diameter and surface hardness
Material
Surface
Deformation
12 kg
(μm)
Surface
Microhardness
(Kg/mm2)
Surface
Deformation
40 kg
(μm)
Surface
Microhardness
(Kg/mm2)
LP1 564.0 ± 43.4 96.8 ± 19.8 936.0 ± 72.3 106.6 ± 6.6
LP2 642.0 ± 200.4 73.1 ± 6.2 1176.1 ± 109 61.0 ± 4.6
LP3 662.0 ± 37.0 67.6 ± 3.1 960.0 ± 54.8 77.4 ± 10.0
MPH1 614.0 ± 115.5 82.8 ± 3.4 820.0 ± 21.2 136.45±78.2
MPH2 722.0 ± 71.9 55.0 ± 3.6 910.4 ± 11.5 56.7 ± 1.9
MiH1 748.0 ± 98.8 61.2 ± 0.2 924 ± 23.0 55.2 ± 1.8
MiH2 852.0 ± 157.9 58.1 ± 1.7 964.0 ± 20.7 61.1 ± 5.0
MiH3 552.0 ± 31.1 67.9 ± 6.6 952.3 ± 24.9 62.7 ± 0.7
MF1 774.0 ± 45.1 31.3 ± 11.2 998.0 ± 14.8 26.2 ± 0.9
Table 3: Homogeneous subsets for the surface deformation at 12 and 40 Kg
Subset Deformation at 12 kg ANOVA F = 4.56, p<0.001
1 MiH3 LP1 MPH1 LP2 LP3 MPH2 MiH1 MF1
2 MPH1 LP2 LP3 MPH2 MiH1 MF1 MiH2
Subset Deformation at 40 kg ANOVA F = 17.48, p<0.001
1 MPH1 MPH2 MiH1 LP1 MiH3
2 MPH2 MiH1 LP2 MiH3 LP3 MiH2 MF1l
3 LP2
[image:22.595.71.518.79.236.2]Table 4: Results for the subsurface damage and subsurface hardness
Material
Subsurface Damage
12 kg
(μm2
×10-3)
Subsurface
Microhardness
(K/mm2)
Subsurface Damage
40 kg
(μm2
×10-3)
Subsurface
Microhardness
(K/mm2)
LP1 58.9 ± 43.9 139.9 ± 23.7 422.1 ± 81.4 139.0 ± 12.1
LP2 224.6 ± 115.3 454.0 ± 66.7 834.3 ± 112.2 337.1 ± 87.7
LP3 150.0 ± 20.2 105.0 ± 10.2 707.4 ± 108.7 104.6 ± 14.6
MPH1 151.3 ± 30.3 100.4 ± 33.7 352.8 ± 52.1 116.0 ± 34.1
MPH2 128.3 ± 61.6 93.2 ± 14.9 366.1 ± 60.1 114.0 ± 12.0
MiH1 15.4 ± 10.2 96.8 ± 4.5 170.3 ± 103.4 99.3 ± 6.5
MiH2 0.00 69.5 ± 6.5 134.6 ± 79.8 60.9 ± 7.2
MiH3 0.00 74.8 ± 12.9 0.00 80.1 ± 22.0
MF1 0.00 51.1 ± 27.4 102.0 ± 76.0 30.8 ± 12.2
Table 5: Homogeneous subsets for the subsurface damage at 12 and 40 Kg.
Subset Subsurface damage at 12 kg ANOVA F = 15.69, p<0.001
1 MiH2 MiH3 MF1 MiH1 LP1
2 MiH1 LP1 MPH2
3 LP1 MPH2 LP3 MPH1
4 MPH2 LP3 MPH1 LP2
Subset Subsurface damage at 40 kg ANOVA F = 25.96, p<0.001
1 MiH3 MiH2 MiH1 MF1 MPH1
2 MiH2 MiH1 MF1 MPH1 MPH2
3 MF1l MPH1 MPH2 LP1
4 MPH1 MPH2 LP1 LP3
5 LP3 LP2
[image:24.595.53.504.86.296.2]Table 6. Pearson’s Correlation Coefficients.
SURFACE DEFORMATION
12Kg
SURFACE DEFORMATION
40Kg
SUBSURFACE DAMAGE
12Kg
SUBSURFACE DAMAGE
40 Kg
SURFACE HARDNESS
-0.51 p<0.001
-0.34 p=0.04
SUBSURFACE HARD
0.64 p<0.001
[image:25.595.64.516.89.188.2]Table 7 Kendall’s tau-c values based on filler size category.
SURFACE DEFORMATION
12Kg
SURFACE DEFORMATION
40Kg
SUBSURFACE DAMAGE
12Kg
SUBSURFACE DAMAGE
40 Kg
SURFACE HARDNESS
SUBSURFACE HARDNESS
CAT 1-3
0.39 p<0.001
-0.06 p=0.684
0.09 p<0.001
0.84 p<0.001
0.58 p<0.001
[image:26.595.63.562.89.179.2]Legend
Figure 1: Light micrograph of resin composites (x200). Incident light illumination with crossed
polars.
LP = Large Particle
MPH = Medium Particle Hybrid
MiH = Micro Particle Hybrid
MF = Microfilled
Figure 2: The specimen rig for cyclic compression under water.
Figure 3A Surface deformation and position of microhardness indentations
3B Location of subsurface stain and position of microhardness indentations.
Figure 4 Examples of subsurface damage stained with AgNO3 after 2000 cycles between
0-12 kg and 0- 40 kg.
Figure 5 Scanning Electron Micrograph of Medium Particle Hybrid (MPH1) after 2000
compression cycles between 0 – 40kg. Arrow shows debonding between resin and filler
phase.