Classification of Big Data Applications and
Implications for the Algorithms and Software
Needed for Scalable Data Analytics
70
thAnnual Meeting of the ORAU Council of Sponsoring Institutions
March 4-5, 2015, Oak Ridge, Tennessee
Big Data Analytics: Challenges and Opportunities
March 4 2015
Geoffrey Fox
[email protected]
http://www.infomall.org
HPC and Data Analytics/Software
•
Develop
data analytics library SPIDAL
(
Scalable Parallel Interoperable Data
Analytics Library )
of similar quality to
PETSc
and
ScaLAPACK
which have been very
influential in success of HPC for simulations
•
Approach:
•
1) Analyze Big Data applications
to identify analytics needed and generate
benchmark applications and characteristics (Ogres with facets)
•
2)
Analyze existing
analytics libraries
(in practice limit to some application domains
and some general libraries Mahout, R. MLlib)
•
3) Analyze Big Data Software
and identify
software model
HPC-ABDS (HPC –
Apache Big Data Stack)
to allow
interoperability
(Cloud/HPC) and
high
performance
merging HPC and commodity cloud software
•
4) Identify range of
big data computer architectures
•
5) Design or identify new or existing
algorithms including parallel implementation
•
Many more data scientists than computational scientists
so HPC implications of
data analytics could be influential on simulation software and hardware
•
Develop
Data Science Curricula
IU Data Science Program
• Program managed by cross disciplinary Faculty in Data Science. Currently
Statistics and Informatics and Computing School but will expand scope to
full campus
• A
purely online
4-course
Certificate in Data Science
has been running
since January 2014 (with 100 students so far)
– Most students are professionals taking courses in “free time”
•
Masters in Data Science
(10 courses) approved October 2014
– Online or Residential (Online masters is just $11,500 total)
– 80 students this semester and 150 applications for Fall 2015
• A campus wide
Ph.D. Minor
in Data Science has been approved.
• Exploring
PhD
in Data Science
• Courses labelled as “
Decision-maker
” and “
Technical
” paths where
McKinsey says an order of magnitude more (1.5 million by 2018) unmet job
openings in Decision-maker track
NIST Big Data Initiative
Led by Chaitin Baru, Bob Marcus,
Wo Chang
NBD-PWG (NIST Big Data Public Working
Group) Subgroups & Co-Chairs
•
There were 5 Subgroups
–
Note mainly industry
•
Requirements and Use Cases Sub Group
–
Geoffrey Fox, Indiana U.; Joe Paiva, VA; Tsegereda Beyene, Cisco
•
Definitions and Taxonomies SG
–
Nancy Grady, SAIC; Natasha Balac, SDSC; Eugene Luster, R2AD
•
Reference Architecture Sub Group
–
Orit Levin, Microsoft; James Ketner, AT&T; Don Krapohl, Augmented
Intelligence
•
Security and Privacy Sub Group
–
Arnab Roy, CSA/Fujitsu Nancy Landreville, U. MD Akhil Manchanda,
GE
•
Technology Roadmap Sub Group
–
Carl Buffington, Vistronix; Dan McClary, Oracle; David Boyd, Data
Tactics
Use Case
Template
•
26 fields completed for 51
areas
•
Government Operation: 4
•
Commercial: 8
•
Defense: 3
•
Healthcare and Life Sciences:
10
•
Deep Learning and Social
Media: 6
•
The Ecosystem for Research:
4
•
Astronomy and Physics: 5
•
Earth, Environmental and
Polar Science: 10
•
Energy: 1
51 Detailed Use Cases:
Contributed July-September 2013
Covers goals, data features such as 3 V’s, software,
hardware
• http://bigdatawg.nist.gov/usecases.php
• https://bigdatacoursespring2014.appspot.com/course (Section 5)
• Government Operation(4): National Archives and Records Administration, Census Bureau • Commercial(8): Finance in Cloud, Cloud Backup, Mendeley (Citations), Netflix, Web Search,
Digital Materials, Cargo shipping (as in UPS)
• Defense(3): Sensors, Image surveillance, Situation Assessment
• Healthcare and Life Sciences(10): Medical records, Graph and Probabilistic analysis, Pathology, Bioimaging, Genomics, Epidemiology, People Activity models, Biodiversity
• Deep Learning and Social Media(6): Driving Car, Geolocate images/cameras, Twitter, Crowd Sourcing, Network Science, NIST benchmark datasets
• The Ecosystem for Research(4): Metadata, Collaboration, Language Translation, Light source experiments
• Astronomy and Physics(5): Sky Surveys including comparison to simulation, Large Hadron Collider at CERN, Belle Accelerator II in Japan
• Earth, Environmental and Polar Science(10): Radar Scattering in Atmosphere, Earthquake, Ocean, Earth Observation, Ice sheet Radar scattering, Earth radar mapping, Climate
simulation datasets, Atmospheric turbulence identification, Subsurface Biogeochemistry
Table 4: Characteristics of 6 Distributed Applications Application
Example Execution Unit Communication Coordination Execution Environment Montage Multiple sequential and
parallel executable Files Dataflow(DAG) Dynamic processcreation, execution
NEKTAR Multiple concurrent
parallel executables Stream based Dataflow Co-scheduling, datastreaming, async. I/O
Replica-Exchange Multiple seq. andparallel executables Pub/sub Dataflow andevents Decoupledcoordination and messaging
Climate Prediction (generation)
Multiple seq. & parallel
executables Files andmessages Master-Worker, events
@Home (BOINC)
Climate Prediction (analysis)
Multiple seq. & parallel
executables messagesFiles and Dataflow Dynamics processcreation, workflow execution
SCOOP Multiple Executable Files and
messages Dataflow Preemptive scheduling,reservations
Coupled
Fusion Multiple executable Stream-based Dataflow Co-scheduling, datastreaming, async I/O
8
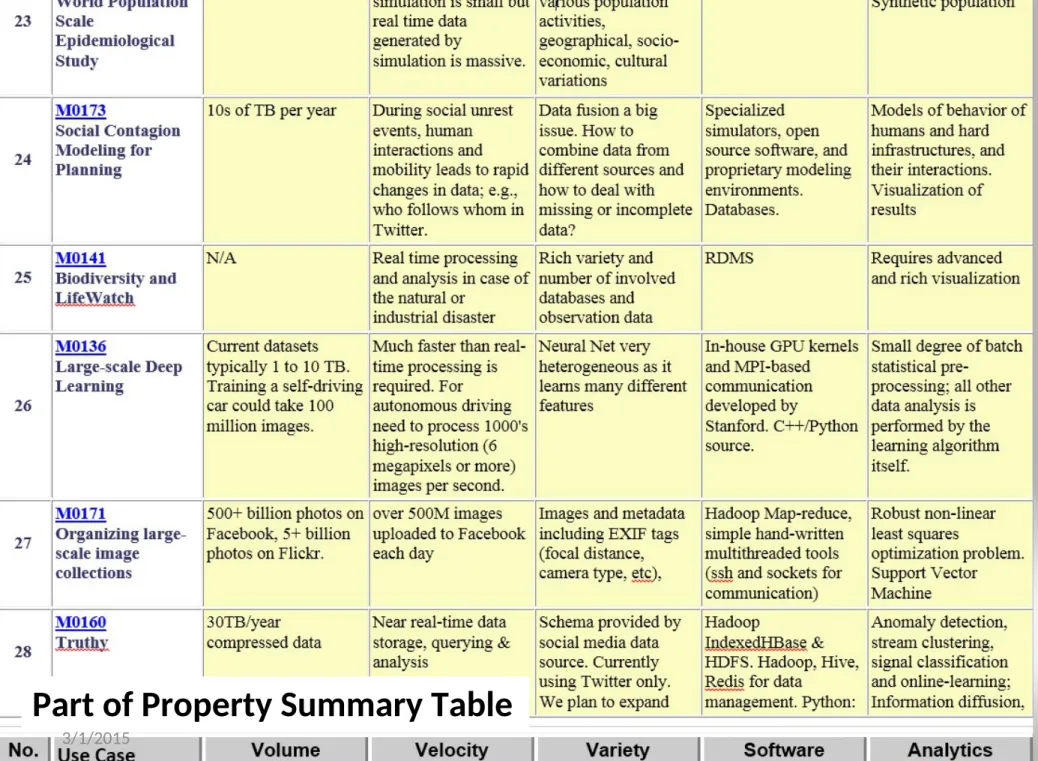
Part of Property Summary Table
51 Use Cases: What is Parallelism Over?
•
People
:
either the users (but see below) or subjects of application and often both
•
Decision makers
like researchers or doctors (users of application)
•
Items
such as Images, EMR, Sequences below; observations or contents of online
store
– Imagesor “Electronic Information nuggets”
– EMR: Electronic Medical Records (often similar to people parallelism) – Protein or Gene Sequences;
– Material properties, Manufactured Object specifications, etc., in custom dataset
– Modelled entities like vehicles and people
•
Sensors
– Internet of Things
•
Events
such as detected anomalies in telescope or credit card data or atmosphere
•
(Complex)
Nodes
in RDF Graph
•
Simple nodes
as in a learning network
•
Tweets
,
Blogs
,
Documents
,
Web Pages,
etc.
–
And characters/words in them
•
Files
or data to be backed up, moved or assigned metadata
•
Particles
/
cells
/
mesh points
as in parallel simulations
Features of 51 Use Cases I
•
PP (26)
“All”
Pleasingly Parallel or Map Only
•
MR (18)
Classic MapReduce MR (add MRStat below for full count)
•
MRStat (7
) Simple version of MR where key computations are
simple reduction as found in statistical averages such as histograms
and averages
•
MRIter (23
)
Iterative MapReduce or MPI (Spark, Twister)
•
Graph (9)
Complex graph data structure needed in analysis
•
Fusion (11)
Integrate diverse data to aid discovery/decision making;
could involve sophisticated algorithms or could just be a portal
•
Streaming (41)
Some data comes in incrementally and is processed
this way
•
Classify (30)
Classification: divide data into categories
Features of 51 Use Cases II
•
CF (4)
Collaborative Filtering for recommender engines
•
LML (36)
Local Machine Learning (Independent for each parallel
entity) – application could have GML as well
•
GML (23)
Global Machine Learning: Deep Learning, Clustering, LDA,
PLSI, MDS,
–
Large Scale Optimizations as in Variational Bayes, MCMC, Lifted Belief
Propagation, Stochastic Gradient Descent, L-BFGS, Levenberg-Marquardt .
Can call EGO or Exascale Global Optimization with scalable parallel algorithm
•
Workflow (51)
Universal
•
GIS (16)
Geotagged data and often displayed in ESRI, Microsoft
Virtual Earth, Google Earth, GeoServer etc.
•
HPC (5)
Classic large-scale simulation of cosmos, materials, etc.
generating (visualization) data
•
Agent (2)
Simulations of models of data-defined macroscopic
entities represented as agents
13 Image-based Use Cases
•
13-15 Military Sensor Data Analysis/ Intelligence
PP, LML, GIS, MR
•
7:Pathology Imaging/ Digital Pathology:
PP, LML, MR
for search becoming
terabyte 3D images, Global Classification
•
18&35: Computational Bioimaging (Light Sources):
PP, LML
Also materials
•
26: Large-scale Deep Learning:
GML
Stanford ran 10 million images and 11
billion parameters on a 64 GPU HPC; vision (drive car), speech, and Natural
Language Processing
•
27: Organizing large-scale, unstructured collections of photos:
GML
Fit
position and camera direction to assemble 3D photo ensemble
•
36: Catalina Real-Time Transient Synoptic Sky Survey (CRTS):
PP, LML
followed by classification of events (
GML
)
•
43: Radar Data Analysis for CReSIS Remote Sensing of Ice Sheets:
PP, LML
to identify glacier beds;
GML
for full ice-sheet
•
44: UAVSAR Data Processing, Data Product Delivery, and Data Services
:
PP
to find slippage from radar images
Internet of Things and Streaming Apps
•
It is projected that there will be
24 (Mobile Industry Group) to 50 (Cisco)
billion devices
on the Internet by 2020.
•
The
cloud
natural controller of and
resource provider for the Internet of
Things.
•
Smart phones/watches, Wearable devices (Smart People), “Intelligent
River” “Smart Homes and Grid” and “Ubiquitous Cities”, Robotics.
•
Majority of use cases are streaming – experimental science gathers data in
a stream – sometimes batched as in a field trip. Below is sample
•
10: Cargo Shipping Tracking
as in UPS, Fedex
PP GIS LML
•
13: Large Scale Geospatial Analysis and Visualization
PP GIS LML
•
28: Truthy: Information diffusion research from Twitter Data
PP MR
for
Search,
GML
for community determination
•
39: Particle Physics: Analysis of LHC Large Hadron Collider Data: Discovery
of Higgs particle
PP Local Processing Global statistics
•
50: DOE-BER AmeriFlux and FLUXNET Networks
PP GIS LML
•
51: Consumption forecasting in Smart Grids
PP GIS LML
7 Computational Giants of
NRC Massive Data Analysis Report
1) G1:
Basic Statistics e.g. MRStat
2) G2:
Generalized N-Body Problems
3) G3:
Graph-Theoretic Computations
4) G4:
Linear Algebraic Computations
5) G5:
Optimizations e.g. Linear Programming
6) G6:
Integration e.g. LDA and other GML
7) G7:
Alignment Problems e.g. BLAST
http://www.nap.edu/catalog.php?record_id=18374
HPC Benchmark Classics
•
Linpack
or HPL: Parallel LU factorization
for solution of linear equations
•
NPB
version 1: Mainly classic HPC solver kernels
–
MG: Multigrid
–
CG: Conjugate Gradient
–
FT: Fast Fourier Transform
–
IS: Integer sort
–
EP: Embarrassingly Parallel
–
BT: Block Tridiagonal
–
SP: Scalar Pentadiagonal
13 Berkeley Dwarfs
1) Dense Linear Algebra
2) Sparse Linear Algebra
3) Spectral Methods
4) N-Body Methods
5) Structured Grids
6) Unstructured Grids
7) MapReduce
8) Combinational Logic
9) Graph Traversal
10) Dynamic Programming
11) Backtrack and
Branch-and-Bound
12) Graphical Models
13) Finite State Machines
First 6 of these correspond to
Colella’s original.
Monte Carlo dropped.
N-body methods are a subset of
Particle in Colella.
Note a little inconsistent in that
MapReduce is a programming
model and spectral method is a
numerical method.
Need multiple facets!
Big Data Ogres and their Facets
•
Big Data Ogres
are an attempt to characterize applications and algorithms with a
set of general common features that are called
Facets
•
Originally derived from NIST collection of 51 use cases but refined with experience
•
The 50 facets capture common characteristics (shared by several problems)which
are inevitably multi-dimensional and often overlapping.
Divided into 4 views
•
One view of an Ogre is the overall
problem architecture
which is naturally related
to the machine architecture needed to support data intensive application.
•
The
execution (computational) features
view, describes issues such as I/O versus
compute rates, iterative nature and regularity of computation and the classic V’s of
Big Data: defining problem size, rate of change, etc.
•
The
data source & style
view includes facets specifying how the data is collected,
stored and accessed. Has classic database characteristics
•
Processing
view has facets which describe types of processing steps including
nature of algorithms and kernels e.g. Linear Programming, Learning, Maximum
Likelihood
•
Instances of Ogres
are particular big data problems and a set of Ogre instances
that cover enough of the facets could form a comprehensive
benchmark/mini-app
set
Problem Architecture View
of Ogres (Meta or MacroPatterns)
i. Pleasingly Parallel – as in BLAST, Protein docking, some (bio-)imagery including Local Analytics or Machine Learning – ML or filtering pleasingly parallel, as in bio-imagery, radar images (pleasingly parallel but sophisticated local analytics)
ii. Classic MapReduce: Search, Index and Query and Classification algorithms like collaborative filtering (G1 for MRStat in Features, G7)
iii. Map-Collective: Iterative maps + communication dominated by “collective” operations as in reduction, broadcast, gather, scatter. Common datamining pattern
iv. Map-Point to Point:Iterative maps + communication dominated by many small point to point messages as in graph algorithms
v. Map-Streaming: Describes streaming, steering and assimilation problems
vi. Shared Memory:Some problems are asynchronous and are easier to parallelize on shared rather than distributed memory – see some graph algorithms
vii. SPMD: Single Program Multiple Data, common parallel programming feature
viii. BSP or Bulk Synchronous Processing: well-defined compute-communication phases
ix. Fusion: Knowledge discovery often involves fusion of multiple methods.
x. Dataflow: Important application features often occurring in composite Ogres
xi. Use Agents:as in epidemiology (swarm approaches)
Hardware, Software, Applications
•
In my old papers (especially book Parallel Computing
Works!), I discussed computing as multiple complex systems
mapped into each other
Problem
Numerical formulation
Software
Hardware
•
Each of these
4 complex systems
has an
architecture
that
can be described in similar language
•
One gets an easy programming model if architecture of
problem matches that of Software
•
One gets good performance if architecture of hardware
matches that of software and problem
•
So “MapReduce” can be used as architecture of software
(programming model) or “Numerical formulation of
problem”
6 Forms of MapReduce
Iterative MR
Basic Statistics PP
8 Data Analysis Problem Architectures
§
1) Pleasingly Parallel
PP
or “map-only” in MapReduce
§ BLAST Analysis; Local Machine Learning
§
2A) Classic MapReduce
MR
, Map followed by reduction
§ High Energy Physics (HEP) Histograms; Web search; Recommender Engines
§
2B) Simple version of classic
MapReduce MRStat
§ Final reduction is just simple statistics
§
3) Iterative MapReduce
MRIter
§ Expectation maximization Clustering Linear Algebra, PageRank
§
4A) Map Point to Point Communication
§ Classic MPI; PDE Solvers and Particle Dynamics; Graph processingGraph
§
4B) GPU (Accelerator) enhanced 4A) – especially for deep learning
§
5) Map +
Streaming
+ Communication
§ Images from Synchrotron sources; Telescopes; Internet of Things IoT
§
6)
Shared memory
allowing parallel threads which are tricky to program
but lower latency
§ Difficult to parallelize asynchronous parallel Graph Algorithms
One View
of Ogres has Facets that are
micropatterns or
Execution Features
i. Performance Metrics; property found by benchmarking Ogre
ii. Flops per byte; memory or I/O
iii. Execution Environment; Core libraries needed: matrix-matrix/vector algebra, conjugate gradient, reduction, broadcast; Cloud, HPC etc.
iv. Volume: property of an Ogre instance
v. Velocity: qualitative property of Ogre with value associated with instance
vi. Variety: important property especially of composite Ogres
vii. Veracity: important property of “mini-applications” but not kernels
viii. Communication Structure; Interconnect requirements; Is communication BSP, Asynchronous, Pub-Sub, Collective, Point to Point?
ix. Is application (graph) static ordynamic?
x. Most applications consist of a set of interconnected entities; is this regular as a set of pixels or is it a complicated irregular graph?
xi. Are algorithms Iterative or not?
xii. Data Abstraction: key-value, pixel, graph(G3), vector, bags of words or items xiii. Are data points in metric or non-metric spaces?
Data Source and Style View
of Ogres I
i. SQL NewSQL or NoSQL:
NoSQL includes Document,
Column, Key-value, Graph, Triple store; NewSQL is SQL redone to
exploit NoSQL performance
ii. Other
Enterprise data systems:
10 examples from NIST integrate
SQL/NoSQL
iii. Set of Files or Objects:
as managed in iRODS and extremely
common in scientific research
iv. File systems, Object, Blob and Data-parallel
(HDFS) raw storage:
Separated from computing or colocated? HDFS v Lustre v.
Openstack Swift v. GPFS
v. Archive/Batched/Streaming:
Streaming is incremental update of
datasets with new algorithms to achieve real-time response (G7);
Before data gets to compute system, there is often an initial data
gathering phase which is characterized by a block size and timing.
Block size varies from month (Remote Sensing, Seismic) to day
(genomic) to seconds or lower (Real time control, streaming)
Data Source and Style View
of Ogres II
vi. Shared/Dedicated/Transient/Permanent:
qualitative property of
data; Other characteristics are needed for permanent
auxiliary/comparison datasets and these could be interdisciplinary,
implying nontrivial data movement/replication
vii. Metadata/Provenance:
Clear qualitative property but not for
kernels as important aspect of data collection process
viii. Internet of Things:
24 to 50 Billion devices on Internet by 2020
ix. HPC simulations:
generate major (visualization) output that often
needs to be mined
x. Using
GIS:
Geographical Information Systems provide attractive
access to geospatial data
2. Perform real time analytics on data
source streams and notify users when
specified events occur
Storm, Kafka, Hbase, Zookeeper
Streaming Data
Streaming Data
Streaming Data
Posted Data Identified Events
Filter Identifying Events
Repository
Specify filter
Archive
Post Selected Events
Fetch
streamed Data
5A. Perform interactive analytics on
observational scientific data
Grid or Many Task Software, Hadoop, Spark, Giraph, Pig …
Data Storage: HDFS, Hbase, File Collection
Streaming Twitter data for Social Networking
Science Analysis Code, Mahout, R
Transport batch of data to primary analysis data system
Local Direct Transfer
Facets in Processing (run time) View
of Ogres I
i. Micro-benchmarks
ogres that exercise simple features of hardware
such as communication, disk I/O, CPU, memory performance
ii. Local Analytics
executed on a single core or perhaps node
iii. Global Analytics
requiring iterative programming models (G5,G6)
across multiple nodes of a parallel system
iv. Optimization Methodology:
overlapping categories
i. Nonlinear Optimization (G6) ii. Machine Learning
iii. Maximum Likelihood or 2 minimizations
iv. Expectation Maximization (often Steepest descent)
v. Combinatorial Optimization
vi. Linear/Quadratic Programming (G5) vii. Dynamic Programming
v. Visualization
is key application capability with algorithms like MDS
useful but it itself part of “mini-app” or composite Ogre
vi. Alignment (G7)
as in BLAST compares samples with repository
Facets in Processing (run time) View
of Ogres II
vii. Streaming divided into 5 categories depending on event size and
synchronization and integration
– Set of independent events where precise time sequencing unimportant. – Time series of connected small events where time ordering important.
– Set of independent large events where each event needs parallel processing with time sequencing not critical
– Set of connected large events where each event needs parallel processing with time sequencing critical.
– Stream of connected small or large events to be integrated in a complex way.
viii. Basic Statistics (G1):
MRStat in NIST problem features
ix. Search/Query/Index:
Classic database which is well studied (Baru, Rabl tutorial)
x. Recommender Engine:
core to many e-commerce, media businesses;
collaborative filtering key technology
xi. Classification:
assigning items to categories based on many methods
– MapReduce good in Alignment, Basic statistics, S/Q/I, Recommender, Calssification
xii. Deep Learning
of growing importance due to success in speech recognition etc.
Problem
Architecture
View
Pleasingly Parallel Classic MapReduce Map-Collective Map Point-to-Point Shared MemorySingle Program Multiple Data Bulk Synchronous Parallel Fusion
Dataflow Agents Workflow
Geospatial Information System HPC Simulations
Internet of Things Metadata/Provenance
Shared / Dedicated / Transient / Permanent Archived/Batched/Streaming
HDFS/Lustre/GPFS Files/Objects
Enterprise Data Model SQL/NoSQL/NewSQL Pe rform anc eMe tri cs Fl ops pe rB yt e; Me m ory I/O Exe cut ion Envi ronm ent ;C ore libra rie s Vol um e Ve loc ity Va rie ty Ve ra
city Comm
uni cati on St ruc ture Da ta Abst ra ction Me tri c= M /Non-Me tri c= N 𝑂 𝑁 2 = NN / 𝑂(𝑁) = N Re gul ar = R /Irre gul ar = I Dyna m ic = D /St atic = S Vi sua liza tion Gra ph Al gori thm s Line ar Al ge bra Ke rne ls Al ignm ent St re am ing Opt im iza tion Me thodol ogy Le arni ng Cla ssi fic ation Se arc h /Que ry /Inde x Ba se St atist ics Gl oba lAna lyt ics Loc al Ana lyt ics Mi cro-be nc hm arks Re com m enda tions
Data Source and Style View
Execution View
Processing View
2 3 4 6 7 8 9 10 11 12 10 9 8 7 6 5 4 3 2 11 2 3 4 5 6 7 8 9 10 12 14 9 8 7 5 4 3 2 1
14 13 12 11 10 6
13
Map Streaming 5
4 Ogre Views and
50 Facets Itera
Benchmarks/Mini-apps spanning Facets
•
Look at
NSF SPIDAL Project, NIST 51 use cases, Baru-Rabl review
•
Catalog facets
of benchmarks and choose entries to cover “all facets”
•
Micro Benchmarks:
SPEC, EnhancedDFSIO (HDFS), Terasort, Wordcount,
Grep, MPI, Basic Pub-Sub ….
•
SQL and NoSQL Data systems, Search, Recommenders:
TPC (-C to x–HS for
Hadoop), BigBench, Yahoo Cloud Serving, Berkeley Big Data, HiBench,
BigDataBench, Cloudsuite, Linkbench
– includes MapReduce cases Search, Bayes, Random Forests, Collaborative Filtering
•
Spatial Query:
select from image or earth data
•
Alignment:
Biology as in BLAST
•
Streaming:
Online classifiers, Cluster tweets, Robotics, Industrial Internet of
Things, Astronomy; BGBenchmark; choose to cover all 5 subclasses
•
Pleasingly parallel (Local Analytics):
as in initial steps of LHC, Pathology,
Bioimaging (differ in type of data analysis)
•
Global Analytics:
Outlier, Clustering, LDA, SVM, Deep Learning, MDS,
PageRank, Levenberg-Marquardt, Graph 500 entries
Remarks on Parallelism I
•
Most use parallelism over items in data set
– Entities to cluster or map to Euclidean space
•
Except
deep learning (for image data sets)
which has parallelism over pixel
plane in neurons not over items in training set
– as need to look at small numbers of data items at a time in Stochastic Gradient Descent SGD
– Need experiments to really test SGD – as no easy to use parallel implementations tests at scale NOT done
– Maybe got where they are as most work sequential
•
Maximum Likelihood or
2both lead to structure like
•
Minimize sum
items
=1N (Positive nonlinear function of unknownparameters for item i)
•
All solved iteratively with (clever) first or second order approximation to
shift in objective function
– Sometimes steepest descent direction; sometimes Newton
– 11 billion deep learning parameters; Newton impossible
– Have classic Expectation Maximization structure
– Steepest descent shift is sum over shift calculated from each point
•
SGD – take randomly a few hundred of items in data set and calculate
shifts over these and move a tiny distance
– Classic method – take all (millions) of items in data set and move full distance