VALIDATED BIOANALYTICAL METHOD DEVELOPMENT FOR THE DETERMINATION OF ALOSETRON IN HUMAN K2EDTA PLASMA
BY USING LC-MS/MS DISSERTATION
Submitted to
THE TAMIL NADU DR.M.G.R.MEDICAL UNIVERSITY,
CHENNAI.
In partial fulfilment for the award of the degree of
MASTER OF PHARMACY In
(Pharmaceutical Analysis) By
261230006 Under the Guidance of
Mrs., VIJAYANAGARAJAN, M.Pharm., (Ph.D)., Assistant Professor, Department of Pharmaceutical Analysis
DEPARTMENT OF PHARMACEUTICAL ANALYSIS C.L.BAID METHA COLLEGE OF PHARMACY
SRI. VINOD KHANNA SRI. L.UDAYMETHA Chairman Secretary&Correspondent
Dr.SHANTHA ARCOT, M.Sc.(Pharm),Ph.D., Dr.GRACERATHNAM,MPharm.,Ph.D., HOD, Department of Pharmaceutical Analysis, Principal
CERTIFICATE
This is to certify that the project entitled “VALIDATED BIOANALYTICAL METHOD DEVELOPMENT FOR THE DETERMINATION OF ALOSETRON IN HUMAN K2EDTA PLASMA BY USING LC-MS/MS” submittedby 261230006 in partial fulfilment for the award of degree of Master of Pharmacy. It was carried out at Ethics Bio Lab Pvt Ltd and at C.L. Baid Metha College of Pharmacy, Chennai-96. under the supervision of Mrs.Vijayanagarajan, M.Pharm., Ph.D.,Assistant professor, Department of pharmaceutical analysis during the academic year 2013-2014.
Place: Chennai- 97 Mrs.VijayanagarajanM.Pharm,(Ph.D), Date: Department of Pharmaceutical Analysis.
SRI. VINOD KHANNA SRI. L. UDAY METHA Chairman Secretary & Correspondent
Dr.SHANTHA ARCOT, M.Sc.(Pharm),Ph.D., Dr.GRACERATHNAM,MPharm.,Ph.D., HOD, Department of Pharmaceutical Analysis, Principal
CERTIFICATE
This is to certify that the project entitled “VALIDATED BIOANALYTICAL METHOD DEVELOPMENT FOR THE DETERMINATION OF ALOSETRON IN HUMAN K2EDTA PLASMA BY USING LC-MS/MS” submittedby 261230006 in partial fulfilment for the award of degree of Master of Pharmacy. It was carried out at Ethics Bio Lab Pvt Ltd and at C.L. Baid Metha College of Pharmacy, Chennai-96. under the supervision of Mrs.Vijayanagarajan, M.Pharm., Ph.D.,Assistant professor, Department of pharmaceutical analysis during the academic year 2013-2014.
Place: Chennai- 97 Mrs.Dr.A.Shantha, B.Pharm, M.Sc.(Pharm).,Ph.D., Date: HOD, Department of Pharmaceutical Analysis.
SRI. VINOD KHANNA SRI. L. UDAY METHA Chairman Secretary & Correspondent
Dr.SHANTHA ARCOT, M.Sc.(Pharm),Ph.D., Dr.GRACERATHNAM,MPharm.,Ph.D., HOD, Department of Pharmaceutical Analysis, Principal
CERTIFICATE
This is to certify that the project entitled “VALIDATED BIOANALYTICAL METHOD DEVELOPMENT FOR THE DETERMINATION OF ALOSETRON IN HUMAN K2EDTA PLASMA BY USING LC-MS/MS” submittedby 261230006 in partial fulfilment for the award of degree of Master of Pharmacy. It was carried out at Ethics Bio Lab Pvt Ltd and at C.L. Baid Metha College of Pharmacy, Chennai-96. under the supervision of Mrs.Vijayanagarajan, M.Pharm., Ph.D.,Assistant professor, Department of pharmaceutical analysis during the academic year 2013-2014.
Place: Chennai -97 Mrs.Dr. GRACE RATHNAM, M.Pharm, Ph.D.,
DECLARATION
The thesis entitled “VALIDATED BIOANALYTICAL METHOD DEVELOPMENT FOR THE DETERMINATION OF ALOSETRON IN HUMAN K2EDTA PLASMA BY USING LC-MS/MS” was carried out by me in Department of Pharmaceutical Analysis, C.L. Baid Metha College of Pharmacy, Chennai – 97 during the academic year 2013-2014. The work embodied in this thesis is original, and is not submitted in part or full for any other degree of this or any other University.
Place: Chennai- 97
Date: [Reg.No: 261230006]
ACKNOWLEDGMENT
The completion of this thesis is not only fulfilment of my dreams, but also the dreams of my parents,
who have taken lots of pain for me for completion of my higher studies.
I would like to take the golden opportunity to express my humble gratitude on the successful
completion of my thesis work. Firstly I am very thankful to my respected guide Mrs.N VIJAYANAGARAJAN, M.Pharm., (PhD)., Assistant professor, Department of Pharmaceutical Analysis, C.L. Baid Metha College of Pharmacy, Chennai – 97. I am honoured to work under her guidance and have her precious guidelines, constant encouragement and support throughout my
research work. I am very obliged for the patience with which she guided me at every step of my
research work.
It’s my privilege to express my grateful and sincere gratitude to Dr. GRACE RATHNAM,
M.Pharm., Ph.D, Principal, and HOD of pharmaceutics, C.L. Baid Metha College of Pharmacy.and Dr.Shantha Arcot, MSc (pharm) PhD., HOD of pharmaceutical analysis, C.L. Baid Metha College of Pharmacy.
I acknowledge my sincere thanks to Mrs., Dr G. UMA, M.Pharm., Ph.D., Assistant professor,
Mrs., VIJAYAGEETHA, M.Pharm., (Ph.D).,Assistant professor, for their valuable suggestions throughout my thesis work.
I would like to use this opportunity to thank for Mr. AJITHLAL(head of ethics bio lab Pvt Ltd)
and Mr. Dr GOPINATH .R PhD., their kind cooperation rendered in fulfilling my work.
I specially thank Ms.G.Surya, M.Sc, Incharge of Ceeal lab for her guidance and source of
inspiration that I have received from her throughout my project work.
I extend my sincere thanks to Chief Librarian M. RajalakshmiC.L. BaidMetha College of
I thank all non-teaching staff members of our college including Mrs.R.Usha, Mrs.Valli and
Mrs.A.P.Karpakam for their help extended during my project work.
I thank all my class mates, sonja, Niharika and to all my seniors and juniors, M.pharm friends
for their love and support rendered at all times.
My humble thanks to the almighty, who gave me strength and confidence all along.
Place: Chennai -97 Reg. No: 261230006
Dedicated to
Parents,
LIST OF CONTENTS
S. No.
CHAPTER
PAGE NO.
1
INTRODUCTION
1
2
AIM AND OBJECTIVE
22
3
LITRATURE REVIEW
24
4
DRUG PROFILE
26
5
MATERIALS AND METHOD
29
6
RESULTS AND DISCUSSION
43
7
CHROMATOGRAMS
82
8
SUMMARY AND CONCLUSION
86
LIST OF ABBREVIATIONS
% : Percentage °C : Degree Celsius µg : Micro gram µL : Micro litre µm : Micro meter AQS.STD : Aqueous Standard BA : Bioanalytical
BM : Bioanalytical Method BTS : Bench Top Stability
CDS : Chromatographic data processing software Conc. : Concentration
CS : Calibration Standards CV : Coefficient of variation DQC : Dilution Quality Control EBL : Ethics Bio Lab Private Limited ESI : Electro Spray Ionization FT : Freeze-Thaw
GR : General Reagent
HQC : High Quality Control sample ID : Identification
K2EDTA : Di Potassium Ethylene Diamine Tetra Acetate
LC/MS/MS : Liquid Chromatography/Mass Spectrometry/Mass Spectrometry LLOQC : Lower Limit of Quality Control
LQC : Low Quality Control m/z : Mass-to-charge ratio mg : Milli gram
min : Minutes mL : Milli litre mm : Milli meter mM : Milli molar
MQC : Medium Quality Control NA : Not Applicable
ng : Nano gram No. : Number
PA : Precision and Accuracy QA : Quality Assurance QC : Quality Control
r2 : Coefficient of determination
Rt : Retention Time
SOP : Standard Operating Procedure SS : Spiking Solution
STD : Standard
ULOQ : Upper Limit of Quantification
INTRODUCTION
This thesis deals with the development and validation of Bioanalytical assay method used for the estimation of Alosetron in biological fluids. Before discussing the experimental results a brief introduction for method development, biopharmaceutical analysis and preliminary treatment of biological samples, extraction procedures for drugs and metabolites from biological samples and estimation of drugs in biological sample by LC-MS/MS for Alosetron.
Bio-availability and bio-equivalence studies require very precise and accurate assay methods that are well validated to quantify drugs in biological samples. The assay methods have to be sensitive enough to determine the biological sample concentration of the drug and/or its metabolite(s) for a period of about five elimination half-life after dosage of the drug. The assay methods also have to be very selective to ensure reliable data, free from interference of endogenous compounds and possible metabolites in the biological samples. In addition, methods have to be as robust and cost effective as possible, making of particular importance to bioequivalence studies. Above all, the assay methods must be able to withstand the scrutiny of national drug registration authorities who judge them on the basis of criteria established by international consensus.
Bioanalytical chemistry is the qualitative and quantitative analysis of drug substances in biological fluids (mainly plasma and urine) or tissue. It plays a significant role in the evaluation and interpretation of bioavailability, bioequivalence and pharmacokinetic data1. The main phases that comprise bioanalytical services are,
Method development,
Method validation,
Sample analysis (method application).
Owing to increased interdependence among countries in recent times it has become necessary for results of many methods to be accepted internationally. Consequently, to assure common level of quality, the need for and use of validated methods has increased 2.
Whatever way the analysis is done it must be checked to see whether it does what it was intended to do; i.e. it must be validated. Each step in the method must be investigated to determine the extent to which environment, matrix, or procedural variables can affect the estimation of analyte in the matrix from the time of collection up to the time of analysis 3.
conditions, because the developer will not know whether the method conditions are acceptable until validation studies are performed2. Method development clears the way for the further processes on
the validation stage. It must be recognized that proper validation requires a lot of work. However, this effort is repaid by the time saved when running the method routinely during sample analysis.
1.0 BIOPHARMACEUTICAL ANALYSIS
1.1. NEED FOR BIOPHARMACEUTICAL ANALYSIS
Methods of measuring drugs in biological media are increasingly important related to following;
Bioavailability and Bioequivalence Studies,
New Drug Development,
Clinical Pharmacokinetics,
Research in Basic Biomedical and Pharmaceutical Sciences.
1.2. ASSAY OF DRUGS AND THEIR METABOLITES
A number of allusions have been made to methods that distinguish drugs from their metabolites. Drug metabolism reactions can be divided into phase I and phase II categories. Phase I typically involves oxidation, reduction, and hydrolysis reactions. In contrast, phase II transformations entail coupling or condensation of drugs.This involves glucoronidation, sulfation, aminoacid conjugation, acetylation, and methylation. Except for reduction processes, most phase I and phase II reactions yield metabolites that are more polar and hence more water soluble than the parent drug. Assays must distinguish between drug and its metabolites. If this fact is ignored, erroneous data may be generated.
1.3. ANALYSIS OF DRUGS IN VARIOUS BIOLOGICAL MEDIA
The most common samples obtained for biopharmaceutical analysis are blood, plasma and urine. Faeces are also utilized, especially if the drug or metabolite is poorly absorbed or extensively excreted in the bile. Other media that can be utilized includes saliva, and tissue.
A bioavailability study may require drug level data in blood and/or urine whereas a drug identification or drug abuse problem may be solved with any one type of biological sample.
Detection of a drug or its metabolite in biological media is usually complicated by the matrix. Because of this, various types of cleanup procedures involving techniques such as solvent extraction and chromatography are employed to effectively separate drug components from endogenous biologic material. The ultimate sensitivity and selectivity of the assay method may be limited by the efficiency of the cleanup methodology.
If the blood is allowed to clot and is then centrifuged, about 30 to 50% of the original volume is collected as serum (upper level). Thus, plasma generally is preferred because of its greater yield from blood. Blood, serum or plasma samples can be utilized for drug studies and may require protein denaturation steps before further manipulation.
If plasma or serum is used for the procedure, the fresh whole blood should be centrifuged immediately at 4000rpm for approximately 5 to 10 min, and the supernatant should be transferred by means of a suitable device, such as a Pasteur pipette, to a clean container of appropriate size for storage.
Urine is easiest to obtain from the patient and also permits collection of large and frequently more concentrated samples. The lack of protein in a healthy individual's urine obviates the need for denaturation steps. Because urine samples are readily obtained and often provide the greatest source of metabolites, they are frequently analyzed in drug metabolism studies.
With humans, faeces are collected in an aluminium foil pan placed under a toilet seat. Once collected, the foil is folded around the material and the sample lyophilized. Faecalspecimens contain high protein content, and difficulties arise in their handling and analysis (even after Lyophilization) because of the large ratio of solid mass to drug. Denaturation of protein is usually required before further manipulations are begun.
Saliva and biological media obtained from humans when constant ratio between plasma and salivary levels of certain drugs exists via non invasive sampling techniques. Saliva is advantageous in drug studies done with children. Although the concentrations of drugs in saliva are rarely equal to those in plasma, a constant ratio (over an effective therapeutic range) permits calculation of plasma levels based on salivary analysis.
of the more complex biological matrix. The number of steps in a separation procedure should be kept to a minimum to prevent loss of drug or metabolite. Sometimes, the separation steps are preceded by a sample pretreatment.
1.4. STORAGE REQUIREMENTS FOR BIOLOGICAL SAMPLES
In order to avoid decomposition or other potential chemical changes in the drugs to be analyzed, biological samples should be frozen immediately upon collection and thawed before analysis. When drugs are susceptible to plasma esterases, the addition of esterase inhibitors, such as sodium fluoride, to blood samples immediately after collection helps to prevent drug decomposition .
When collecting and storing biological samples, the analyst should be wary of artifacts from tubing or storage vessels that can contaminate the sample. For example, plastic-ware frequently contains the high boiling liquid bis (2-ethylhexyl) phthalate; similarly, the plunger-plugs of vacutainers are known to contain tri-butoxyethylphosphate, which can interfere in certain drug analysis.
1.5. PRELIMINARY TREATMENT OF BIOLOGICAL SAMPLES
In most cases, preliminary treatment of a sample is needed before the analyst can proceed to the measurement step. Analysis is required for drug in samples as diverse as plasma, urine, faeces,
saliva, bile, sweat, and seminal fluid. Each of these samples has its own set of factors that must be considered before an appropriate pretreatment method can be selected. Such factors as texture and chemical composition of the sample, degree of drug-protein binding, chemical stability of the drug,
and types of interferences can affect the final measurement step.
1.5.1. PROTEIN PRECIPITATION OR DENATURATION
Biological materials such as plasma, faeces, and saliva contain significant quantities of protein, which can bind a drug. The drug may have to be freed from protein before further manipulation. Protein denaturation is important, because the presence of proteins, lipids, salts, and other endogenous materials in the sample can cause rapid deterioration of HPLC columns and also interfere the assay.
Protein denaturation procedures include the use of tungstic acid, ammonium sulfate, heat, alcohol, trichloroacetic acid, and perchloric acid.
gummy mass obtained with acetonitrile. Methanol also gives a clearer supernatant and may prevent the drug entrapment that can be observed after acetonitrile precipitation.
Ultrafiltration and dialysis procedures also have been used to remove proteins from biological fluids. These procedures are not widely used because they are slow.
1.5.2. HYDROLYSIS OR CONJUGATES
The presence-of drug metabolites as conjugates, such as glucuronides and sulfates, in biological samples cannot be ignored. The effect of a drug depends to a considerable extent on the biotransformation that occurs in the human body. Therefore, it may be important to isolate the actual conjugates. Samples containing either glucuronideacetals or sulfate esters are usually pretreated using enzymatic or acid hydrolysis. The unconjugated metabolites that result from the hydrolysis procedure are less hydrophilic than their conjugates and usually can be extracted from the biological matrix.
A nonspecific acid hydrolysis can be accomplished by heating a biological sample for 30 min at 90 to 100°C in 2 to 5N hydrochloric acid. Upon cooling, the pH of the sample can be adjusted to the desired level and the metabolite removed by solvent extraction. Particularly stable conjugates sometimes require hydrolysis in an autoclave.
1.5.3. HOMOGENIZATION
For samples containing insoluble protein, such as muscle or other related tissues, a homogenization or solubilizing step using 1N hydrochloric acid may be required before treating the sample further. For gelatinous samples such as seminal fluid or sputum, liquefaction is achieved via sonication. A solid sample such as faeces can be homogenized with a minimum amount of methanol. Homogenization is usually performed with a blade homogenizer (e.g., Warring Blender).
1.6 EXTRACTION PROCEDURES FOR DRUGS AND METABOLITES FROM BIOLOGICAL SAMPLES
After pre treatment of biological material, the next step is usually the extraction of the drugs from the biological matrix. All separation procedures use one or more treatments of matrix-containing solute with some fluid. As extracting solvents are liquid and the biological sample solid (e.g., lyophilized faeces), it is an example of liquid-solid extraction. If the extraction involves two liquid phases, it is an example of liquid-liquid extraction.
Liquid - solid extractions occur between a solid phase and a liquid phase, either phase may initially contain the drug substance. Among the solids that have been used successfully in the extraction (usually via adsorption) of drugs from liquid samples are XAD-2 resin, charcoal, alumina, silica gel, and aluminum silicate. Sometimes the drugs are contained in a solid phase, such as in lyophilized specimens. Liquid-solid extraction is often particularly suitable for polar compounds that would otherwise tend to remain in the aqueous phase. The method could also be useful for amphoteric compounds that cannot be extracted easily from water.
Factors governing the adsorption and elution of drugs from the resin column include solvent polarity; flow rate of the solvent through the column, and the degree of contact between the solvent and with the resin beds.
In the adsorption process, the hydrophobic portion of the solute that has little affinity for the water phase is preferentially adsorbed on the resin surface while the hydrophilic portion of the solute remains in the aqueous phase. Alteration in the lipophilic / hydrophilic balance within the solute or solvent mix, and not within the resin, affects adsorption of the solute.
Biological samples can be prepared for cleanup by passing the sample through the resin bed where drug (metabolite) components are adsorbed and finally eluted with an appropriate solvent. The liquid-solid extraction method provides a convenient isolation procedure for blood samples, thus avoiding solvent extraction, protein precipitation, drug losses, and emulsion formulation. It is possible; however, that strong drug-protein binding could prevent sufficient adsorption of the drug to resin.
DEHYDRATION METHODS
An aqueous biological sample is treated with a sufficient quantity of anhydrous salt (sodium or magnesium sulfate) to create a "dried" mix. This mix is then extracted with a suitable organic solvent to remove the desired drug or metabolite.
1.6.2. LIQUID-LIQUID EXTRACTION
Liquid-liquid extraction is probably the most widely used technique because the analyst can remove a drug or metabolite from larger concentrations of endogenous materials that might interfere with the final analytical determination.
The technique is simple, rapid, and has a relatively small cost factor per sample.
becomes more compatible with a particular analytical methodology in the measurement step, such as a mobile phase in LCMS/MS determinations.
The extracted material can be reconstituted in small volumes (e.g., 100 to 500 µl of solvent), thereby extending the sensitivity limits of an assay. It is possible to extract more than one sample concurrently. Quantitative recoveries (90% or better) of most drugs can be obtained through multiple or continuous extractions.
Partitioning or distribution of a drug between two possible liquid phases can be expressed in terms of a partition or distribution coefficient, usually called partition coefficient is constant only for a particular solute, temperature, and pair of solvents used. By knowing the P value for the extracted drug and the absolute volumes of the two phases to be utilized, the quantity of drug extracted after a single extraction can be obtained. In multiple extractions methodology, the original biological sample is extracted several times with fresh volumes of organic solvent until as much drug as possible is obtained. Because the combined extracts now contain the total extracted drug, it is desirable to calculate the number of extractions necessary to achieve maximum extraction.
FACTORS AFFECTING THE PARTITION COEFFICIENT
Factors that influence partition coefficient and hence recovery of drugs in liquid-liquid extraction are choice of solvent, pH, and ionic strength of the aqueous phase. In almost all cases, one of the liquid phases is aqueous because of the nature of a biological sample. The second liquid is selected by the analyst. It is highly desirable to select an organic solvent that shows greater affinity for the drug analyzed, yet leaves contaminants or impurities in the aqueous or biological phase. The solvent should be immiscible with an aqueous phase, should have less polarity than water, and should solubilize the desired extractable compound to a large extent. It should also have a relatively low boiling point so that it can be easily evaporated if necessary. Other considerations are cost, toxicity, flammability, and the nature of the solvent. If larger numbers of samples are to be extracted, the volume of solvent needed per sample can affect the overall cost of the assay procedure.
It is generally accepted that diethyl ether and chloroform are the solvents of choice for acidic and basic drugs, respectively, especially when the identity of the drugs in the samples are unknown. In these cases, any chemically neutral drugs are extracted into either solvent depending on their relative partition tendencies.
the proper pH for extraction can be calculated from the Henderson-Hassel Balch equation using the pKa of the compound. If the species to be analyzed is unknown, the pH must be approximated based on the chemical nature of the suspected agent.
Third Factor influencing extractability of drugs from biological samples is ionic strength. Addition of highly water-soluble ionized salts, such as sodium chloride, to an aqueous phase creates a high degree of interaction between the water molecules and the inorganic ions in solution. Fewer water molecules are free to interact with an unionized drug. Therefore, the solubility of the drug in the aqueous phase decreases, thereby increasing the partitioning or distributing in favor of the non-polar or organic phase. The technique is commonly called "salting out."
Either mechanical or manual tumbling, rocking, or vigorous shaking of the samples can accomplish mixing of the aqueous organic phases . The percent recovery of a drug vs. time and/or type of mixing should be investigated for each biological sample. In many cases, vigorous shaking of a sample should be avoided because it leads to emulsification, which can be intractable for centrifugation. Emulsification is often observed when organic solvents are used at basic pH whereas certain organic solvents such as n-hexane and diethyl ether are less emulsion-prone.
Certain types of amphoteric drugs or drugs that possess extreme water solubility are not amenable to classic solvent extraction. In these cases, other types of analytical methodology such as ion-pairing must be adopted.
The technique of back-extraction can be applied with success to the analysis of drugs in biological samples. The purpose of the methodology is to further purify an extract by removing either drug or impurities by additional extractions.
1.7. CHROMATOGRAPHIC METHODS
1.7.1. HIGH PERFORMANCE LIQUID CHROMATOGRAPHY
HPLC is directly derived from classic column chromatography in that a liquid mobile phase is pumped under pressure rather than by gravity flow through a column filled with a stationary phase. This has resulted in a sharp reduction in separation time, narrower peak zones, and improved resolution. The mobile phase is placed in a solvent reservoir for pumping into the system. In the case of liquid-solid HPLC, solvents are chosen from the elutropic series. A solvent system is usually degassed by vacuum treatment or sonication before use.
1.7.2. LIQUID CHROMATOGRAPHY MASS SPECTROMETRY
Liquid chromatography is a fundamental separation technique in the life sciences and related fields of chemistry. Unlike gas chromatography, which is unsuitable for nonvolatile and thermally fragile molecules, liquid chromatography can safely separate a very wide range of organic compounds, from small-molecule drug metabolites to peptides and proteins.
Traditional detectors for liquid chromatography include refractive index, electrochemical, fluorescence, and ultraviolet-visible (UV-Vis) detectors. Some of these generate two dimensional data; that is, data representing signal strength as a function of time. Others, including fluorescence and diode array UV-Vis detectors, generate three-dimensional data. Three-dimensional data include not only signal strength but spectral data for each point in time.
Mass spectrometers also generate three dimensional data. In addition to signal strength, they generate mass spectral data that can provide valuable information about the molecular weight, structure, identity, quantity, and purity of a sample.
Mass spectral data add specificity that increases confidence in the results of both qualitative and quantitative analysis.
For most compounds, a mass spectrometer is more sensitive and far more specific than all other LC detectors. It can analyze compounds that lack a suitable chromophore. It can also identify components in unresolved chromatographic peaks, reducing the need for perfect chromatography.
Mass spectral data complements data from other LC detectors. While two compounds may have similar UV spectra or similar mass spectra, it is uncommon for them to have both.
1.8. ESTIMATION OF DRUGS IN BIOLOGICAL SAMPLES BY LC-MS/MS
MS has emerged as an ideal technique for the identification of such structurally diverse metabolites. When coupled with online HPLC the technique is extremely robust, rapid, sensitive, and easily automated. Not surprisingly, LC/MS/MS have become the methods of choice for pharmacokinetic studies, yielding concentration versus time data for drug compounds from in vivo samples such as plasma.
LC-MS instrument consist of three major components
LC (to resolve a complex mixture of components)
An interface (to transport the analyte in to the ion source) of a mass spectrometer
Mass spectrometer (to ionize and mass analyze the individually resolved components) Reverse phase (RP) HPLC is a widely pretended mode of chromatography and is a major contributing factor to advances made in several areas of pharmaceutical science. Mobile phase composition is a very critical in achieving selectivity in RP-HPLC separation. Although a large number of buffer system have been used in conventional RP-HPLC, only the volatile ion paring reagent can be used in LC-MS analysis.
1.8.1. IONIZATION TECHNIQUES
1.8.1.1. ELECTROSPRAY IONIZATION (Turbo spray)
Electrospray relies in part on chemistry to generate analyte ions in solution before the analyte reaches the mass spectrometer. The LC eluent is sprayed (nebulized) into a chamber at atmospheric pressure in the presence of a strong electrostatic field and heated drying gas. The electrostatic field causes further dissociation of the analyte molecules.
The heated drying gas causes the solvent in the droplets to evaporate. As the droplets shrink, the charge concentration in the droplets increases. Eventually, the repulsive force between ions with like charges exceeds the cohesive forces and ions are ejected (desorbed) into the gas phase. These ions are attracted to and pass through a capillary sampling orifice into the mass analyzer.
Some gas-phase reactions, mostly proton transfer and charge exchange, can also occur. Between the times, ions are ejected from the droplets and they reach the mass analyzer.
1.8.1.2. ATMOSPHERIC PRESSURE CHEMICAL IONIZATION
In APCI, the LC eluent is sprayed through a heated (typically 250°C – 400°C) vaporizer at atmospheric pressure. The heat vaporizes the liquid. The resulting gas-phase solvent molecules are ionized by electrons discharged from a corona needle. The solvent ions then transfer charge to the analyte molecules through chemical reactions (chemical ionization).
be thermally unstable. APCI is used with normal-phase chromatography more often than electrospray is because the analytes are usually nonpolar.
4.1.3. ATMOSPHERIC PRESSURE PHOTO IONIZATION
Atmospheric pressure photo ionization (APPI) for LC-MS/MS is a relatively new technique. As in APCI, a vaporizer converts the LC eluent to the gas phase. A discharge lamp generates photons in a narrow range of ionization energies. The range of energies is carefully chosen to ionize as many analyte molecules as possible while minimizing the ionization of solvent molecules. The resulting ions pass through a capillary sampling orifice into the mass analyzer.
APPI is applicable to many of the same compounds that are typically analyzed by APCI. It shows particular promise in two applications, highly nonpolar compounds and low flow rates (<100 µl/min), where APCI sensitivity is sometimes reduced.
1.8.2. MASS ANALYZER (Quadrupole)
A quadrupole mass analyzer consists of four parallel rods arranged in a square. The analyte ions are directed down the center of the square. Voltages applied to the rods generate electromagnetic fields. These fields determine which mass-to-charge ratio of ions can pass through the filter at a given time. Quadrupoles tend to be the simplest and least expensive mass analyzers. Quadrupole mass analyzers can operate in two modes:
MRM Mode
Scanning (scan) mode
Selected ion monitoring (SIM) mode
In scan mode, the mass analyzer monitors a range of mass-to-charge ratios. In SIM mode, the mass analyzer monitors only a few mass to- charge ratios.
SIM mode is significantly more sensitive than scan mode but provides information about fewer ions. Scan mode is typically used for qualitative analyses or for quantitation when all analyte masses are not known in advance.
SIM mode is used for quantitation and monitoring of target compounds.
1.9. APPLICATIONS OF LC-MS/MS
Peptide mapping
Selective detection of compounds in a complex mixture
Efficient analysis of biological samples
To identify degradation products in stability studies
Identification of metabolites
1.10. QUANTITATIVE ANALYSIS
Three methods are generally used for quantitative analysis. They are the external standard method, the internal standard method and the standard addition method.
1.10.1 EXTERNAL STANDARD METHOD
The external standard method involves the use of a single standard or up to three standard solutions. The peak area or the height of the sample and the standard used are compared directly or the slope of the calibration curve based on standards that contain known concentrations of the compounds of interest.
1.10.2. INTERNAL STANDARD METHOD
A widely used technique of quantitation involves the addition of an internal standard to compensate for various errors. In this approach, a known compound of a fixed concentration is added to the known amount of samples to give separate peaks in the chromatograms, to compensate for the losses of the compounds of interest during sample pretreatment steps. Any loss of the component of interest will be accompanied by the loss of an equivalent fraction of internal standard. The accuracy of this approach obviously dependents on the structural equivalence of the compounds of interest and the internal standard.
The requirements for an internal standard must
Give a completely resolved peak with no interferences,
Elute close to the compound of interest,
Behave equivalent to the compounds of interest for analysis like pretreatments, derivative formations, etc.,
Be added at a concentration that will produce a peak area or peak height ratio of about unity with the compounds of interest,
Not be present in the original sample,
Be stable, unreactive with sample components, column packing and the mobile phase and
Be commercially available in high purity.
Free from Drug-drug intraction
component in the original sample. The response factor (RF) is the ratio of peak areas of sample component (Ax) and the internal standard (ISTD) obtained by injecting the same quantity.
1.11. METHOD DEVELOPMENT
The method development and establishment phase defines the chemical assay.
A bioanalytical method is a set of all procedures involved in the collection, processing, storing, and analysis of a biological matrix for an analyte methods employed for quantitative determination of drugs and their metabolites in biological fluids are the key determinants in generating reproducible and reliable data that in turn are used in the evaluation and interpretation of bioavailability, bioequivalency and pharmacokinetics.
Method development involves evaluation and optimization of the various stages of sample preparation, chromatographic separation, detection and quantification. To start these works an extensive literature survey, reading work done on the same or similar analyte and summarizing main starting points for future work is of primary importance. Based on the information from the survey, the following can be done.
Choice of instrument that is suitable for the analysis of analyte of interest.
Choice of the column associated with instrument of choice, the detector and the mobile phase.
Choice of internal standard, (It must have similar chromatographic properties of analyte.)
Choice of extraction procedure, (which is time economical, gives the highest possible recovery without interference and has acceptable accuracy and precision.)
Another important issue in method development stage is the choice of internal versus external standardization. Internal standardization is common in bioanalytical methods especially with chromatographic procedures. For internal standardization, a structural or isotopic analogue of the analyte is added to the sample prior to sample pre-treatment and the ratio of the response of the analyte to that of the internal standard is plotted against the concentration. Another important point is that the tests performed at the stage of method development should be done with the same equipment that will actually be used for subsequent routine analysis. The differences found between individual instruments representing similar models from the same manufacturer is not surprising and should be accounted.
1.11.1. Optimization of chromatographic conditions
In case of LC-MS/MS method because of highly specific and selective detection of analytes because of MRM detection mode, less effort are needed to for improvement of resolution.
Generally mobile phase optimization is always preferred prior to stationary phase optimization.
1.11.2. Selection of mobile phase
There are many more restrictions regarding the selection of eluents and eluent components for use with HPLC-MS methods compared with HPLC- UV methods. Essentially the buffer constituents have to be volatile so the usual standby, phosphate, is unacceptable, as are the other common eluent constituents such as ion- pair reagents, organic amines, etc. Whilst the use of these eluent components may give acceptable results (at least in the short term), they would rapidly result in fouling of the source of common atmospheric ionization interfaces. This would lead to loss in sensitivity and significant down-time as the source was repeatedly cleaned. The use of MS detection therefore necessitates a new way of thinking about HPLC eluent.
1.11.3. Organic Modifiers
Firstly a decision must be made regarding the use of methanol or acetonitrile. Methanol is slightly superior to acetonitrile with ESI since it gives marginally greater response. Methanol is also preferred since it is reported to give slightly better peak shape for basic compounds in RP- HPLC than acetonitrile and it is a better solvent for buffer salts.
1.11.4. Mobile Phase Buffering
Wherever acidic or basic samples are separated it is strongly advisable to control mobile phase pH by adding a buffer. The measurement of pH for a mobile that contains organic solvent is imprecise, because electrode response tends to drift. Consequently if a pH meter is to be used, it is strongly recommended that the pH of the buffer should be adjusted before adding organic. In selecting a particular buffer, several considerations should be kept in mind.
the mobile phase. In this case, retention may change from run to run, and distorted peaks may result. Buffer solubility and stability, possible interaction with the equipment, sample, and/or column, and the volatility are also of interest for some applications.
1.11.5. Selection of column
When attempting a separation, a reverse-phase, bonded-hydrocarbon column should be selected first, because such columns have the widest applicability. Fully reacted monomeric bonded C8 packing represent a good compromise for reverse- phase separations, because these materials have moderate retention, good efficiency and stability, and a useful k' range for a wide variety of samples. C18 can be used for applications in which maximum retention and sample size is required. C18 packing sometimes also exhibit superior characteristics for compounds that have higher water solubility. Shorter-chain bonded hydrocarbon phases are useful in applications involving very strongly retained solutes, or to improve selectivity by the use of the higher concentrations of water required in the mobile phase for these packing.
As in LLC with mechanically held stationary liquids, retention in normal phase BPC increases with the polarity of the bonded-stationary phase. Depending on the organic functionality, polar BPC packings show significant selectivity differences when compared to bare silica packings and to each other and some polar bonded-phase packings are actually more retentive than bare silica.
Normal-phase BPC columns can be used as an alternative to adsorption chromatography and one of the most versatile of these materials is the nitrile (CN or cyano-) bonded-phase materials. Separation of very polar (including water-soluble) samples may require packings such as diol- or amino-BPC packings. However, if the sample itself is aqueous, a reverse- phase system should be attempted first, because this approach offers greater sampling convenience.
1.11.6. Selection of internal standard:
An internal standard at a known concentration is normally added to plasma samples and is utilized to diagnose several potential variations that can occur during sample preparation and ongoing analysis.
The structure of the internal standard should be similar to the drug of interest. If this is not possible other standards can be used.
Requirements for a proper internal standard:
Similar retention to the Analyte.
Should not be in the original sample.
Should mimic the Analyte in any sample preparation steps.
Does not have to be chemically similar to Analyte.
Commercially available in high purity.
Stable and uncreative with sample or mobile phase.
Should have a similar detector response to the Analyte for the concentration used.
1.12. METHOD VALIDATION
The search for the reliable range of a method and continuous application of this knowledge is called validation. It can also be defined as the process of documenting that the method under consideration is suitable for its intended purpose.
Method validation involves all the procedures required to demonstrate that a particular method for quantitative determination of the concentration of an analyte (or a series of analytes) in a particular biological matrix is reliable for the intended application. Validation is also a proof of the repeatability, specificity and suitability of the method.
Bioanalytical methods must be validated if the results are used to support the registration of a new drug or a new formulation of an existing one. Validation is required to demonstrate the performance of the method and reliability of results. If a bioanalytical method is claimed to be for quantitative biomedical application, then it is important to ensure that a minimum package of validation experiments has been conducted and yields satisfactory results.
The guideline for industry by FDA states that the fundamental parameters of validation parameters for a bioanalytical method validation are accuracy, precision, selectivity, sensitivity, reproducibility and stability. Typical method development and establishment for bioanalytical method includes determination of (1) selectivity, (2) accuracy, (3) precision, (4) recovery, (5) calibration curve, and (6) stability.
Validations are subdivided into the following three categories:
1.12.1. FULL VALIDATION
This is the validation performed when developing and implementing a bioanalytical method for the first time. Full validation should be performed to support pharmacokinetic, bioavailability, and bioequivalence and drug interaction studies in a new drug application (NDA).
1.12.2. PARTIAL VALIDATION
Partial validations are performed when modifications of already validated bioanalytical methods are made. Partial validation can range from as little as one intra-assay and precision determination to a nearly full validation. Some of the typical bioanalytical method changes that fall into this category include bioanalytical method transfer between laboratories or analyst, change in methodology, change of matrix within species, change of species within matrix. The decision of which parameters to be revalidated depend on the logical consideration of the specific validation parameters likely to be affected by the change made to the bioanalytical method.
1.12.3. CROSS VALIDATION
Cross validation is a comparison of validation parameters when two or more bioanalytical methods are used to generate data within the same study or across different studies. An example of cross validation would be a situation when the original validated bioanalytical method serves as the reference and the revised bioanalytical method is the comparator.
1.12.4. VALIDATION PARAMETERS
The following experimental design is drawn in order to prove the test method is capable to yield consistent, reliable and reproducible results within the pre-determined acceptance limits.
Acceptance criteria for the validation parameters are specified in individual experimental design. Observations and results were recorded in individual method validation data sheets.
The following parameters have been validated. 1. carryover test
2. Selectivity 3. sensitivity 4. matrix effect 5. Linearity
7. Recovery
8. Dilution integrity 9. Ruggedness 10. Stabilities
10.1 Room temperature stability
10.2. Refrigerator stock solution stability 10.3 Bench top stability
10.4 Auto sampler stability 10.5 Long term stability 10.6 Freeze thaw stability 10.7 Wet Extract Stability
11. Re-injection stability 12. Concomitant Drug Effect
Acceptance Criteria:
Precision: The precision calculated for Low and High QC concentrations should be within 15% and 20% for the LLOQ QC Concentrations.
Accuracy: The accuracy calculated for Low and High QC concentrations should be within 15 % and 20 % for the LLOQ QC Concentration of the nominal value.
At least 67% of the QC samples should be within 15% of their respective nominal values except at LLOQ QC where it should be within 20% of the nominal values. 33% of the QC samples (not all replicates at the same concentration) can be out side the above acceptance limits. At least 50% of QC samples at each concentration level should be within ±15% of their respective nominal value except at LLOQ QC where it must be within 20 % of the nominal value.
1.13. SAFETY PRECAUTIONS
If biological matrix is spilled, it should be cleaned up immediately with 4% hypochlorite solution. Hands should be washed with soap and water before leaving the laboratory or whenever contaminated. Broken glassware should not be handled directly by hand. Pick up by mechanical means such as brush, dustpan, tongs or forceps.
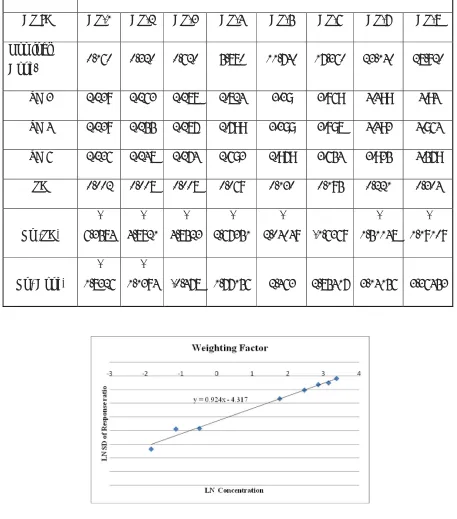
1.14. DATA PROCESSING
The chromatograms were acquired using the computer based Analyst 1.4.2 software. The data was processed by peak area ratio method using same software. The concentration of the unknown was calculated from the following equation using regression analysis of spiked calibration of standard with the reciprocal of the square of the drug to internal standard concentration ratio as a weighting factor [1/(concentration ratio)2].
y = mx + c
Where, y = peak area ratio of Naproxen to internal standard m = slope of the calibration curve
AIM AND OBJECTIVE
AIM:
The aim of this study is to develop and validate a specific bioanalytical method by LC-MS/MS for the estimation of Alosetron in K2EDTA human plasma using Alosetron D3as internal
standard
OBJECTIVE:
Methods of measuring drugs in biological media are increasingly important due to problems related to bioavailability and bioequivalence, new drug development, drug abuse, clinical pharmacokinetics, and drug research are highly dependent on accurately measured drugs in biological samples.
For the estimation of the drugs present in the biological fluid, LCMS/MS method is consider to be more suitable since this is a powerful and rugged method. It is also extremely specific, linear, precise, accurate, sensitive and rapid.
Currently there is a need in the pharmaceutical environment to develop Bio-analytical methods for the determination of Alosetron in human plasma. The developed method could then be applied to clinical trials to obtain accurate pharmacokinetic parameters in human plasma.
Already HPLC-UV, LC-MS / MS, and GC-MS methods have been reported for Alosetron in various Biological media. Some of these methods use complicated extraction instruments, long and tedious extraction procedures, and large amounts of solvents or biological fluids for extraction while other methods have a long turnaround time during analysis
The main objective of this work is to develop rapid, selective and sensitive HPLC-UV and LC-MS / MS methods that have short and simple extraction procedures, consume small amounts of solvent and biological fluid for extraction and a short turn-around time.
1. Litrature survey
a) Alosetron – category, molecular formula, molecular weight, chemistry, Physiochemical properties, pharamacological & pharmaceutical properties.
2. Method Development
Stock solution preparation and tunning of analyte.,
Optimization of chromatographic conditions were proposed to be developed and optimized ,
Selection of Mass range,
Selection of initial separation conditions,
Nature of the stationary phase,
Nature of the mobile phase (pH, peak modifier, solvent strength, ratio and flow rate),
Sensitivity and
Selection of internal standard.
3. Validation of Bioanalytical method as per Guidelines
The developed method were also proposed to be validated using the various validation parameters such as,
Accuracy,
Precision,
Selectivity,
Sensitivity
Linearity and Range,
Matrix effect,
Carryover,
Recovery,
Dilution Integrity,
Robustness / ruggedness,
Stability and
LITERATURE REVIEW
3.1 Ismail IM et al., (2005)reported metabolism of radiolabelled alosetron was studied in rat, dog, rabbit, mouse and human. The metabolism in rat and dog was studied at a low and an elevated dose designed to generate sufficient quantities of metabolite for definitive identification. A strategy for the characterization of metabolites in cases of extensive metabolism was developed and
demonstrated for alosetron. Semi-preparative high-performance liquid chromatography (HPLC), liquid chromatography-mass spectrometry (LC-MS), nuclear magnetic resonance (NMR) and liquid chromatography-nuclear magnetic resonance (HPLC-NMR) enabled the isolation and
characterization of 28 metabolites of alosetron. The characterization of the metabolites in animal excreta facilitated the identification of human systemic metabolites.
3.2 Thomas L. Lloyd et al., (1996) reported method of analysis for the determination of alosetron in human plasma or serum has been developed. The method was fully automated using a laboratory robot in order to improve analytical precision, efficiency and safety. The assay involved solid-phase extraction with reversed-phase HPLC separation and fluorescence detection. A validation exercise over the concentration range of 0.1 to 20 ng/ml demonstrated the selectivity, linearity, sensitivity, accuracy, precision, extraction efficiency, ruggedness and stability of the method. The method has been applied in support of numerous human pharmacokinetic/biopharmaceutic studies over the last five years.
working calibration range were generally < +/- 12% and < 13%, respectively, except at the 0.10 ng ml-1 alosetron level, where the corresponding values were < +/- 17.3% and < 20.2%. The antiserum was free from adverse cross-reactivity with either a synthetic precursor of alosetron or with four major metabolites of the drug.
3.4 Lloyd TL et al., (1996)reported a method of analysis for the determination of alosetron in human plasma or serum has been developed. The method was fully automated using a laboratory robot in order to improve analytical precision, efficiency and safety. The assay involved solid-phase extraction with reversed-phase HPLC separation and fluorescence detection. A validation exercise over the concentration range of 0.1 to 20 ng/ml demonstrated the selectivity, linearity, sensitivity, accuracy, precision, extraction efficiency, ruggedness and stability of the method. The method has been applied in support of numerous human pharmacokinetic/biopharmaceutic studies over the last five years.
3.5 Koch K.M et al., (2004) reported to assess the pharmacokinetics of alosetron, its effect on in vivo enzyme activities, and influence of demographic factors during repeated dosing.
Methods: Thirty healthy men and women received 1 mg oral alosetron twice-daily for 29.5 days and a single oral dose of a metabolic probe cocktail before and on the last day of alosetron dosing. Serum alosetron concen-trations were measured on days 1, 8, 15, 22 and 29. Probe-substrate and metabolite concentrations were measured after each cocktail dose.
3.6 Camilleri M, Northcutt AR, Kong S, et al., (2000)Efficacy and safety of alosetron in women with irritable bowel syndrome: a rand-omised, placebo-controlled trial. Lancet 2000; 355: 1035–40.
3.7 Koch KM, Palmer JL, Noordin N, et al., (2002) reported the Sex and age differences in the pharmacokinetics of alosetron. Br J Clin Pharmacol 2002; 53: 238–42.
DRUG PROFILE
4.1 ALOSETRON HYDROCHLORIDE
Chemical IUPAC Name:
2,3,4,5-tetrahydro-5-methyl-2-[(5-methyl-1H-imidazol-4-yl)methyl]-1H-pyrido[4,3-b]indol-1-one, monohydrochloride.
Empirical formula: C17H18N4O•HCl
Molecular Weight: 330.8 g/mol(salt form)
294.32 g/mol(free form)
Chemical structure:
DESCRIPTION:
ALOSETRON is a potent and selective antagonist of the serotonin 5-HT3 receptor type.
Chemically, alosetron is designated as 2,3,4,5-tetrahydro-5-methyl-2-[(5-methyl-1H-imidazol-4-yl)methyl]-1H-pyrido[4,3-b]indol-1-one, monohydrochloride.
Physio-chemical Properties:
ALOSETRON is a white to beige solid that has a solubility of 61 mg/mL in water, 42 mg/mL in 0.1M hydrochloric acid, 0.3 mg/mL in pH 6 phosphate buffer, and < 0.1 mg/mL in pH 8 phosphate buffer.
Protine Binding:82%
Bioavailability:50% - 60%
Partition Coefficient:1.61
Half-life: 1.5-1.7 hours
Mechanism of Action:
Alosetron has an antagonist action on the 5-HT3receptors of the enteric nervous system of
the gastrointestinal tract. While being a 5-HT3antagonist like ondansetron, it is not classified or
approved as an antiemetic. Since stimulation of 5-HT3receptors is positively correlated with
gastrointestinal motility, alosetron's 5-HT3antagonism slows the movement of fecal matter through
the large intestine, increasing the extent to which water is absorbed, and decreasing the moisture and volume of the remaining waste products.
Pharmacology:
ALOSETRON is a quinolone/fluoroquinolone antibiotic. ALOSETRON is bactericidal and its mode of action depends on blocking of bacterial DNA replication by binding itself to an enzyme called DNA gyrase, which allows the untwisting required to replicate one DNA double helix into two. Notably the drug has 100 times higher affinity for bacterial DNA gyrase than for mammalian. ALOSETRON is a broad-spectrum antibiotic that is active against both positive and Gram-negative bacteria.
Absorption:
Side Effects:
Common side effects of ALOSETRON are constipation, abdominal discomfort and pain. Less common side effects of ALOSETRON are nausea, gastrointestinal discomfort and pain, abdominal distention, regurgitation and reflux, hemorrhoids direction.
Indication:
ALOSETRON is indicated only for women with severe diarrhea-predominant irritable bowel syndrome.
Storage:
Keep tightly closed. Store at 2-8 C.
4.2. ALOSETRON D3(Internal standard)
Chemical IUPAC Name:
2, 3, 4, 5-Tetrahydro-5-(methyl-d3)-2-[(4-methyl-1H-imidazol-5-yl)methyl]-1H-pyrido[4,3-b]indol-1-one Hydrochloride
Empirical formula: C17H16D3ClN4O
Molecular Weight: 331.34 g/mol
Chemical structure:
MATERIALS & METHODS
MATERIALS
The method requires the following standards, equipments, reagents and biological matrix.
Note: The standards, equipments, reagents from different manufacturers, with an equivalent specification may be used. Weights, volume mentioned can be scaled up/scaled down based on requirement.
5.1 Analyte Standard
Use authenticated Alosetron reference/working standards for preparation of standard stock solution.
5.1.1 Internal Standard
Use authenticated Alosetron D3 reference/working standards for preparation of internal standard stock solution.
5.2.1 Equipments
Equipment Make/ Models
LC-MS/MS Waters TQ MS
UPLC Waters Acquity UPLC
Precision balances Mettler Toledo XP205, XP2U
Auto pipettes Eppendorf
Column Waters X Bridge BEH Phenyl, 2.5 µm (50 x 2.1 mm)
Vortex mixer Velp
Plate form Shaker Heidolph
Centrifuge Eppendorf
Deep Freezer (-70oC) New Brunswick scientific
Deep Freezer (-20oC) Bio Care
Refrigerator Samsung
5.2.2 Reagents, Chemicals, Solvents and materials
Reagent/Chemical Brand Purity/Grade
Acetonitrile Fischer Scientific HPLC
Methanol J.T Baker HPLC
Ammonia Merck GR
Water Rankem HPLC
Volumetric flasks Borosil A
Eppendrof tubes Tarsons
-RIA vials Tarsons
-Tips Tarsons
-Multitips Eppendorf
-Reagent bottles Borosil
-Biological matrix
Use screened interference free human K2EDTA plasma for preparation of calibration
standards and quality control samples.
5.3.1 PREPARATION OF SOLUTIONS
Preparation of Diluent [Acetonitrile: Water (10:90% v/v)]
Transfer 900 mL of Water and 100 mL of Acetonitrile in to 1000 mL reagent bottle and shake well, sonicate and label the solution.
Transfer 999 mL of water into 1000 mL reagent bottle and add 1 mL of Ammonia solution. Shake well, sonicate and label the solution.
Preparation of Strong Needle Wash [(Acetonitrile: Water (80:20% v/v)]
Transfer about 800 mL of Acetonitrile and 200 mL of water in to 1000 mL reagent bottle, shake well, sonicate and label the solution.
Preparation of Weak Needle Wash [(Acetonitrile: Water: Ammonia (50:50:0.2% v/v)]
Transfer about 500 mL of Acetonitrile and 500 mL of water in to 1000 mL reagent bottle and add 2 ml of Ammonia solution, shake well, sonicate and label the solution.
Preparation of Seal Wash [(Water: Methanol (95:5% v/v)]
Transfer about 950 mL of water and 50 mL of methanol in to 1000 mL reagent bottle, shake well, sonicate and label the solution.
Preparation of Aqueous standard
Transfer 0.033 mL of spiking solution SS-MQC in to RIA vial and add 0.417 mL of internal standard dilution. Then add 9.550 mL of Diluent. Prepare the aqueous standard as and when required used for system suitability and analytical batch.
Note: As per the requirement, volume of the solutions required can be altered keeping the concentration/composition same.
5.3.2 PREPARATION OF STANDARD SOLUTIONS
Analyte stock solution (w/v) (Alosetron 100.000 µg/mL)
Weigh and transfer about 5.0 mg of Alosetron in to 50 mL volumetric flask. Dissolve with 5 mL of Diluent and make up the volume with the same. Calculate the final concentration by considering its potency, salt and actual amount weighed. Label and store in refrigerator (2ºC to 8ºC). Separate Weighing should be done for Calibration Standards and QC Samples and label the solution.
Internal Standard stock solution (w/v) (Alosetron D3 100.000 µg/mL)
Internal Standard dilution (w/v) (0.050µg/mL ISTD)
Transfer 0.200 mL of internal standard stock in to 2 ml volumetric flask and make up the volume with diluent. And then transfer 0.250 mL into 50 mL volumetric flask and make up the volume with diluent. Label and shall be stored in refrigerator (2ºC to 8ºC).
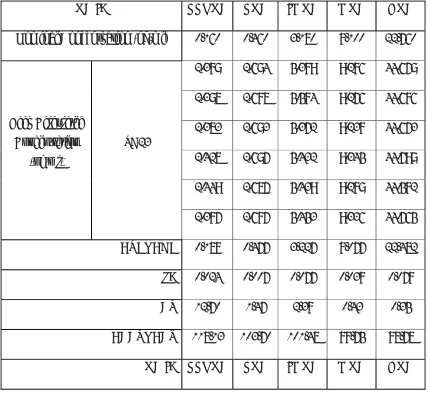
Preparation of Calibration Standards
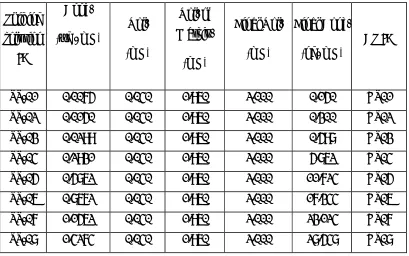
Preparation of Calibration Standard spiking solutions for Analyte (Alosetron)
Prepare spiking solutions of calibration standard (CS) from serially diluted solutions using diluent as per the table given below. Store the spiking solutions of CS samples in refrigerator at (2ºC to 8ºC)
Solution ID Conc. (µg/mL) Vol. Taken (mL) Vol. of diluent (mL) Total Vol.(mL ) Conc. (µg/mL) CS Spiking Solution ID
ANA 89.2097 1.000 4.000 5.000 17.8419 ANA-IMA01
ANA-IMA01 17.8419 0.400 4.600 5.000 1.4274 SS-08
SS-08 1.4274 4.050 0.950 5.000 1.1562 SS-07
SS-07 1.1562 3.750 1.250 5.000 0.8672 SS-06
SS-06 0.8672 3.380 1.620 5.000 0.5862 SS-05
SS-05 0.5862 2.500 2.500 5.000 0.2931 SS-04
SS-04 0.2931 0.510 4.490 5.000 0.0299 SS-03
SS-03 0.0299 2.500 2.500 5.000 0.0150 SS-02
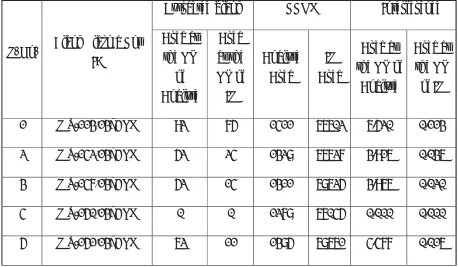
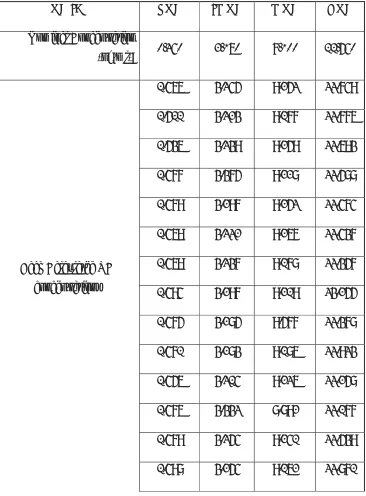
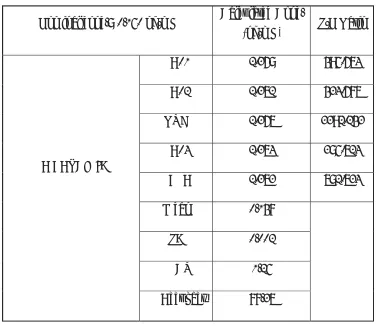
Preparation of Spiked plasma Calibration Standards
[image:51.612.132.541.144.400.2]Prepare CS by spiking CS spiking solution in screened human K2EDTA plasma as per the
table given below. Label and store in deep freezer (-70± 20 ºC)
Spiking solution
ID
Conc.
(µg / mL)
Vol. (mL) Vol. of Matrix. (mL) Final Vol. (mL) Final Conc. (ng/ mL) CS ID
SS-01 0.0075 0.040 1.960 2.000 0.150 CS01
SS-02 0.0150 0.040 1.960 2.000 0.300 CS02
SS-03 0.0299 0.040 1.960 2.000 0.598 CS03
SS-04 0.2931 0.040 1.960 2.000 5.862 CS04
SS-05 0.5862 0.040 1.960 2.000 11.724 CS05
SS-06 0.8672 0.040 1.960 2.000 17.344 CS06
SS-07 1.1562 0.040 1.960 2.000 23.124 CS07
SS-08 1.4274 0.040 1.960 2.000 28.548 CS08
5.4 Preparation of Quality Control Samples
5.4.1 Preparation of QC spiking solutions for Analyte (Alosetron)
Prepare spiking solutions of QC from serially diluted solutions using diluent as per the table given below. Store the spiking solutions of QC samples in refrigerator at (2ºC to 8ºC).
Solution ID Conc. (µg/mL) Vol.Take n (mL) Vol. of diluent (mL) Total Vol.(mL) Final Conc. (µg/mL) QC Spiking Solution ID
ANA 89.2231 1.000 4.000 5.000 17.8446
ANA-IMA01 17.8446 0.580 9.420 10.000 1.0350 SS-HQC
SS-HQC 1.0350 2.350 2.650 5.000 0.4541 SS-MQC
SS-MQC 0.4541 1.800 3.200 5.000 0.1635 SS-IMQC
SS-IMQC 0.1635 0.680 4.320 5.000 0.0222 SS-LQC
SS-LQC 0.0222 1.700 3.300 5.000 0.0076 SS-LLOQC
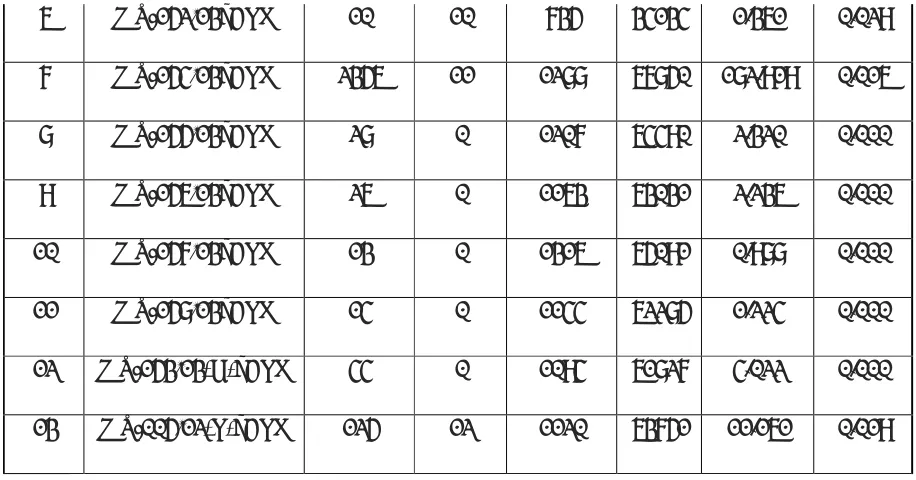
5.4.2 Preparation of spiked plasma QC samples
Prepare QC standards by spiking QC spiking solution in screened human K2EDTA plasma
as per the table given below. Label and store in deep freezer (-70± 20 ºC).
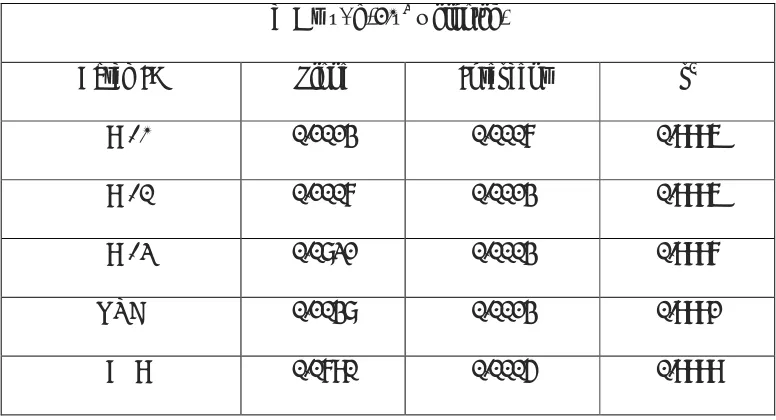
Spiking solution ID Conc. (µg/ mL) Vol. of Spiking Solution (mL) Vol. of Matrix. (mL) Final Vol. (mL) Final Conc. (ng/ mL) QC ID
SS-LLOQC 0.0076 0.040 1.960 2.000 0.151 LLOQC
SS-LQC 0.0222 0.040 1.960 2.000 0.445 LQC
SS-IMQC 0.1635 0.040 1.960 2.000 3.270 IMQC
SS-MQC 0.4541 0.040 1.960 2.000 9.082 MQC
SS-HQC 1.0350 0.040 1.960 2.000 20.700 HQC
5.5 CALIBRATION AND CALCULATIONS
Software used :
Mass Lynx Version 4.1
Weighting factor : Linear, 1/X2.
Analysis mode :
Peak area ratio (Analyte to ISTD) and concentration of Analyte
Calculation : Using following equation by Mass lynx Version 4.1
y = m x + c,
Where,
x = Concentration of Analyte in ng/ml
y = Peak area ratio of analyte to ISTD
m = Slope of calibration Curve
c = Intercept on Y- axis
5.6 INSTRUMENTAL PARAMETERS:
5.6.1 METHOD DEVELOPMENT OF ALOSETRON
Method development is a trial and error process. It consists of various steps. Generally it starts with tuning of Alosetron.
5.6.2Tuning of analyte (Alosetron)
Then for fragmentation of parent ion, infused the stock dilution in product ion mode and checked for m/z of various daughter ions obtained. Prominent and suitable daughter ion selected by altering various parameters,
For ex:- Compound dependent parameters:- DP,FP,EP,CE,CXP,CEP
Source dependent parameters:- Nebulizer gas, curtain Gas-2, Temperature
and Ion spray voltage.
It was found that m/z of 295.18 shows a good and stable response. So it selected as daughter ion. Re-optimize the parameters. Finally the parameter selected when the selected daughter ion shows maximum stable response. Then infused stock dilution using m/z of selected parent and daughter ion in Multiple Reaction Monitoring(MRM) mode. Re-optimized the parameters by injecting drug in mobile phase.
5.6.3. TRAIL ON COLUMN AND MOBILE PHASE:
The trails were conducted using different column and by changing the mobile phase composition.
Trail 1
In this trail Ascentis Phenyl column, 3µm (5x4.6mm) and mobile phase of 5mM Ammonium Formate with 0.1% Formic Acid: ACN (30:70) was used.
Trail 2
In this trail Phenomenex Phenyl Hexyl column was used with a Mobile Phase of 5mM Ammonium Acetate with 0.1% Formic Acid: ACN (30:70) was used.
Trail 3
In this trail Ascentis Phenyl column, 3µm (5x4.6mm) was used with a Mobile Phase of
5mM Ammonium Acetate with 0.1% Formic Acid: ACN (30:70) was used.
Conclusion:
In trail 1 peak shape was not good, as it showing tailing. Also the response was less.
In trail 3 peak shape and response were maximum and stable.
5.6.4. TRIAL ON EXTRACTION PROCEDURE:
In the method Development first step is on extraction techniques. For that different extraction methods were tried as shown below.
BY LIQUID-LIQUID EXTRACTION (LLE)
Trail 01:
Procedure:
Withdraw the spiked plasma samples from the deep freezer and allow them to thaw at room temperature. Aliquot 0.100ml into a clean RIA vial and add 50 µl of Internal Standard (10µg/ml). Vortex well and mix well. Add 2.5ml of TBME and vibramax for 10 minutes. Centrifuge the sample at 4500rpm for 10 minutes at 4ºC. Collect the supernatant of 2.0ml and evaporate till dryness. Reconstitute the residue with 0.500ml of mobile phase and inject 10 µl into LCMS/MS.
Conclusion:
Improper peak shape was observed.
Trail 02:
Procedure:
Withdraw the spiked plasma samples from the deep freezer and allow them to thaw at room temperature. Aliquot 0.100ml into a clean RIA vial and add 50 µl of Internal Standard (10µg/ml). Vortex well and mix well. Add 2.5ml of Dichloromethane: Diethylether (30:70) and vibramax for 10 minutes. Centrifuge the sample at 4500rpm for 10 minutes at 4ºC. Collect the supernatant of 2.0ml and evaporate till dryness. Reconstitute the residue with 0.250ml of mobile phase and inject 10 µl into LCMS/MS.
Conclusion:
Fluctuation in response was observed.
Trail 03:
Procedure: