R E S E A R C H A R T I C L E
Open Access
The assessment of depression in people
with multiple sclerosis: a systematic review
of psychometric validation studies
Daniel Hind
1, Daphne Kaklamanou
2*, Dan Beever
1, Rosie Webster
3, Ellen Lee
1, Michael Barkham
4and
Cindy Cooper
1Abstract
Background:The prevalence of depression in people with multiple sclerosis (PwMS) is high; however, symptoms common to both conditions makes measurement difficult. There is no high quality overview of validation studies to guide the choice of depression inventory for this population.
Methods:A systematic review of studies validating the use of generic depression inventories in people with MS was conducted using MEDLINE and PsycINFO. Studies validating the use of depression inventories in PwMS and published in English were included; validation studies of tests for cognitive function and general mental health were excluded. Eligible studies were then quality assessed using the COSMIN checklist and findings synthesised narratively by instrument and validity domain.
Results:Twenty-one studies (N =5,991 PwMS) evaluating 12 instruments were included in the review. Risk of bias varied greatly between instrument and validity domain.
Conclusions:The review of validation studies was constrained by poor quality reporting and outcome reporting bias. Well-conducted evaluations of some instruments are unavailable for some validity domains. This systematic review provides an evidence base for trade-offs in the selection of an instrument for assessing self-reported symptoms of depression in research or clinical practice involving people with MS. We make detailed and specific recommendations for where further research is needed.
Trial Registration:PROSPERO CRD42014010597
Keywords:Depression, Multiple Sclerosis, Reproducibility of Results, Psychometrics, Chronic Disease
Background
Multiple sclerosis (MS) is a chronic condition affecting the central nervous system. It is characterised by neuro-logical symptoms and deficits that lead to increased dis-ability and physical decline over 30–40 years [1]. Symptoms include fatigue, weakness, pain, cognitive im-pairment, loss of vision, tremors, poor balance, and blad-der, bowel, and sexual dysfunction [2]. The prevalence of depression, which is strongly linked with a reduced qual-ity of life, is high amongst people with MS (PwMS) with around half having major depression at some point in
their lifetime and up to 40 % experiencing it at any one time [3, 4].
However, there is significant overlap in the somatic symptoms common to depression and MS, principally fa-tigue, pain, poor sleep and concentration, leading to con-cerns over the measurement of depression in PwMS [5]. For instance, the Diagnostic and Statistical Manual [6] cri-teria for depression includes common symptoms of MS such as fatigue, poor concentration and sleep difficulties. Other self-report measures of depressive symptoms in-clude questions about health and work difficulties, which are also common to MS [7]. As such, levels of depression in MS may easily be overestimated, particularly when using self-report measures. The debate over how to as-sesses depression in the presence of a physical condition * Correspondence:[email protected]
2Department of Psychology, Sociology and Politics, Sheffield Hallam University, Heart of the Campus, 42 Collegiate Crescent, SheffieldS10 2BQUK Full list of author information is available at the end of the article
© 2016 The Author(s).Open AccessThis article is distributed under the terms of the Creative Commons Attribution 4.0 International License (http://creativecommons.org/licenses/by/4.0/), which permits unrestricted use, distribution, and reproduction in any medium, provided you give appropriate credit to the original author(s) and the source, provide a link to the Creative Commons license, and indicate if changes were made. The Creative Commons Public Domain Dedication waiver (http://creativecommons.org/publicdomain/zero/1.0/) applies to the data made available in this article, unless otherwise stated. Hindet al. BMC Psychiatry (2016) 16:278
with common symptoms is not new [8] and has generated considerable debate as to whether depression inventories which include somatic symptoms should be used, modi-fied or abandoned in populations with chronic physical conditions [9–12]. Despite the number of depression in-ventories used to assess people with MS and studies valid-ating their use, there remains an evidence deficit in this area with only one pre-existing systematic review of such measures [13]. Minden and colleagues [13] reviewed mea-sures used to assess and manage a wide range of psychi-atric disorders in PwMS of which depression was just one, and sought to answer a number of clinical questions. The review had broad scope, did not assess the methodological quality of selected studies, and missed a large number of validation studies associated with the use of generic de-pression inventories in people with MS. Research studies can provide biased results if they lack methodological rigour [14]. To assess the report of research study accur-ately, readers need transparent information on its methods and results. This can be hampered if report authors fail to provide complete and clear descriptions of key study in-formation [15]. For this reason, the COSMIN group have developed a critical appraisal checklist, which provides standards for the evaluation of the methodological quality of instrument validation studies [16]. The purpose of the present study was to review the evidence for the validity and reliability of self-report depression inventories in PwMS, in line with the COSMIN standards, with the aim of providing clinicians and researchers with a rational basis for choice.
Methods
Protocol and registration
A protocol for this systematic review is available on the PROSPERO database [17].
Eligibility criteria
Eligible studies recruited people with MS, with no restric-tions on duration or course of disease. Studies with com-parison groups, for instance people with other physical or psychological conditions, were also included in the review. We included any study evaluating the validity or reliability of self-report instruments designed to assess depression. Studies simply assessing levels of depression, rather than the validity or reliability of measures, were not included. Studies focusing on the validation or reliability of neuro-psychological tests of cognitive function or assessing gen-eral mental health or health-related quality of life, as opposed to depression, were excluded. We included peer reviewed research journal articles with primary research data. Commentaries, letters, dissertations and editorial pa-pers were excluded. There was no restriction placed on publication date. Due to time and resource constraints, only English language papers were included.
Information sources
We searched electronic bibliographic databases for pub-lished work as well as the reference lists of primary studies included in the review and of relevant, previously published reviews. We searched MEDLINE (from 1946 to 21.07.2014) and PsycINFO (from 1806 to July Week 3 2014) through OVID. Reference lists of eligible studies were checked and further relevant citations, not picked up through the searches of bibliographic databases, were included, along with serendipitous finds. No contact was made with study authors to retrieve unpublished information.
Search
The search strategy included synonyms for the following terms: multiple sclerosis, depression assessment, validity and reliability. MeSH terms, exploding terms and other search devices relevant to each database were used to cre-ate a more efficient search. The full electronic search strategy for both databases is available on the PROSPERO database [17].
Study selection
Two researchers (DK and either RW or DB) independently screened titles and abstracts for eligibility; differences were resolved by discussion with DH (5 papers [18–22]). The full papers of eligible titles and abstracts were retrieved and further reviewed for eligibility in the same way.
Data collection process and data items
A standardised data extraction form was used, which in-cluded details about the study (authors, year, country), the samples (size, diagnoses, method of recruitment, baseline demographic characteristics), and types of validity or reli-ability assessed, as defined by the COnsensus-based Stan-dards for the selection of health status Measurement INstruments checklist (COSMIN) checklist (e.g. internal consistency, reliability, measurement error, criterion valid-ity, structural validvalid-ity, content validvalid-ity, cross-cultural val-idity) [23]. Outcome data were extracted as reported. One member of the review team (RW) extracted data, a second (DK) independently checked the extraction and a third (DH) checked a proportion of the extraction from the two members. When working through the COSMIN checklist, any discrepancies between the data extracted from the pa-pers and the definition of the checklist were discussed within the team. For example, in one of the papers the authours [24] did not report that they were investigating construct validity, but reported the values for discriminant and convergent validity. Within the COSMIN checklist, construct validity includes aspects of structural validity, hypothesis testing and cross-cultural validity. In that par-ticular case we reported the discriminant and convergent validity according to the COSMIN checklist and therefore were reported under 'Hypotheses Testing'.
Risk of bias in individual studies
With a number of studies using different cut points in the evaluation of continuous variables we considered meta-analysis inappropriate [25]. As no statistical synthesis was planned, quality assessment was conducted for the pur-poses of describing the conduct of the included studies. DK assessed the included studies, unblinded, for generic dimensions of methodological quality defined by the COSMIN [23]. DH checked a 20 % random sample of rat-ings, which included all the poor rated papers and a ran-dom sample of the remaining papers and disagreements were resolved by discussion.
Summary measures
We extracted the summary statistics, where reported, for domains, measurement properties, and their different as-pects (see COSMIN taxonomy for further detail [16]).
For the reliability (extended definition) domain, we ex-tracted: (1) inter-item correlations for the measurement property of internal consistency; item-subscale correla-tions, item-total correlations and Cronbach’s alpha (to assess internal consistency for the correlation between items) [26], with alpha scores of 0.70 and above accept-able by convention [27]; (2) Intraclass correlation coeffi-cients (ICC) (with scores of 0.4–0.75 indicating fair to good reliability and higher scores excellent) [28] or Pear-son or Spearman correlation coefficients (with scores of >0.7 considered acceptable [27]) for the measurement property of test-retest reliability; (3) standard error of measure (or statistics from which it could be derived) for the measurement property of measurement error.
For the validity domain, we extracted three categories of
data. First,pvalues fromF- ort-tests (with values less than
0.05 considered statistically significant), Cohen’s kappa (with
values of >0.6 considered good agreement) [29], Spearman’s
correlations (with scores of >0.7 considered acceptable [27]) and qualitative information on content validity. Second, nar-rative reports of factor analysis and uni-dimensionality of the items and, for confirmatory factor analysis (CFA), com-parative fit index (CFI) and Tucker-Lewis Index (TLI) values
ranging from 0 to 1, with a value≥0.9 generally considered
to indicate acceptable model fit, and the root mean square error of approximation (RMSEA) values of < .08 considered
to indicate poor fit [30] (structural validity aspect), Pearson’s
correlations and narrative information about convergent val-idity (hypotheses testing aspect), confirmatory factor analysis and narrative information on translation (cross-cultural val-idity aspect) for the measurement property of
con-struct validity. Third, we extracted correlations (rstatistics
and p values), percentages, area under the curve (AUC), positive and negative predictive values (PPVs and NPVs) for continuous scores, or sensitivity and specificity at spe-cified cut-points for dichotomous scores, for the measure-ment property of criterion validity.
Results Study selection
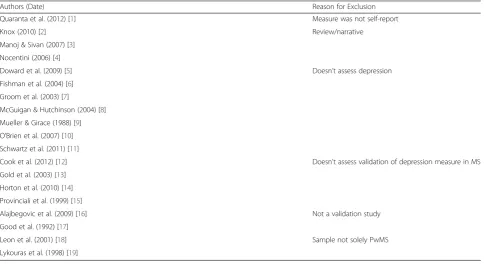
Following the PRISMA reporting guidelines, the database searches retrieved 465 records of which 433 related to Eng-lish language articles (Appendix 1). Five additional records were found through other sources; another review [13] and through the reference list of included papers [20–22, 31, 32]. After the elimination of duplicates there were 389 unique citations to screen of which 267 were excluded at the title stage and a further 82 at the abstract stage. Forty full text articles were retrieved for detailed assessment of eligibility, of these; a further 19 were excluded (see Appendix 2 for
detailed reasons). Twenty-one studies (N= 5,991 people
with MS) were included in the review (Appendix 3).
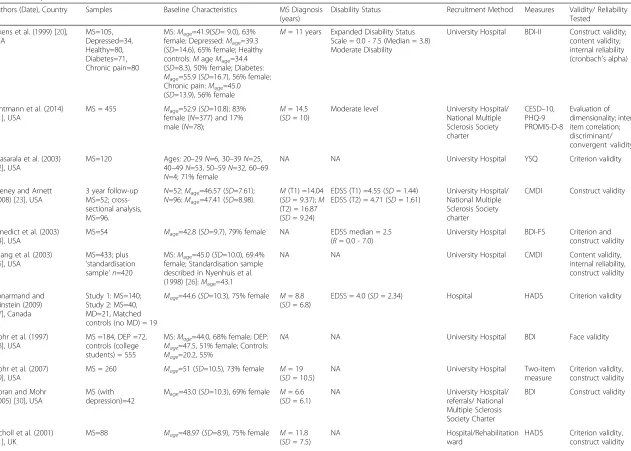
Study characteristics
Included studies were published between 1995 and 2014
by teams based in the USA (n= 11 [7, 24, 33–41]),
Canada (n= 6 [42–47]), the UK [31], France [48], Italy
[49], and Estonia [50]. Only one study [49] examined the cross culture validity of the questionnaire in Italy. The median number of people with MS in the studies was 148 (Range = 42–1,717).
The median of the mean ages of people with MS re-ported in 18 out of 21 studies (Appendix 3, data missing from three studies [34, 42, 45]) was 45.79 years (range: 34.40–52.90). The median percentage of women reported in 19/21 MS cohorts (data missing from two studies [35, 42]) was 73.90 % (range: 63.00–83.30 %). The median of the mean of MS diagnosis in years reported in 11 out of 21 studies was 11.08 years (range: 6.6 - 19).
The included studies evaluated the reliability and/or
validity of: the Beck Depression Inventory (BDI;n= 4 [7,
24, 39, 47]) or BDI-II (n= 1 [24]) or short-form variants
the Fast Screen (BDI-FS) (n= 1 [36]) and ‘modified’
(mBDI) (n= 1 [41]); Center for Epidemiologic Studies
Depression Scale (CES-D; n= 4 [43–45, 48]); Chicago
Multiscale Depression Inventory (CMDI/MDI;n= 4 [35,
37, 40, 49]); Hospital Anxiety and Depression Scale
(HADS; n= 2 [31, 42]); Patient Health Questionnaire
(PHQ-9; n= 2 [33, 46]); CESD-10 (n= 1 [33]); Patient
Reported Outcome Measurement Information System
Depression 8-item bank (PROMIS-D-8; n= 1 [33]); Yale
Single Question (YSQ; n= 1 [34]); a two-item measure
of depression (‘During the past two weeks, have you often been bothered by feeling down, depressed, or
hopeless?’ and ‘During the past two weeks, have you
often been bothered by little interest or pleasure in
doing things?’) (n= 1 [38]); and a one-item single
question (‘Are you depressed?’) (n= 1 [50]). For the
purposes of reporting we treat the BDI and BDI-II as one, but short-form versions (BDI-FS, mBDI) as sep-arate entities. All the measures identified in this re-view are free to use with the exception of the BDI
and HADS where there are costs associated with their use (Table 1).
The included studies evaluated: construct validity
(n= 16 [7, 24, 31, 35–41, 43, 44, 46–49]); criterion validity
(n= 9 [31, 34, 36, 38, 42, 43, 47, 49, 50]); internal reliability
(n = 5 [24, 37, 46, 48, 49]); content validity (n= 4 [37, 46,
48, 49]); test-retest reliability (n= 2 [45, 49]); discriminant/
convergent validity [33]; evaluation of dimensionality [33]; and inter-item reliability [33] (Table 2).
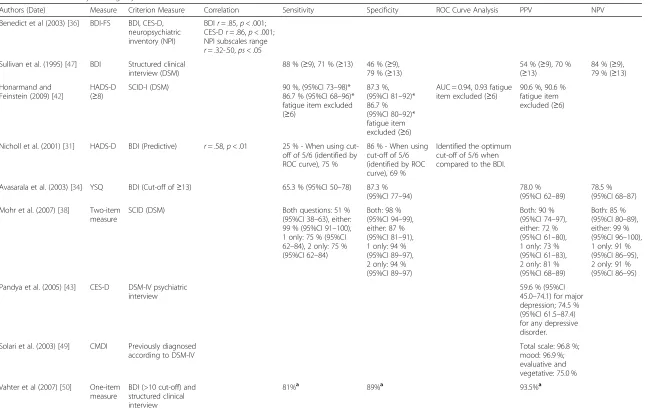
The median sensitivity score of the measures used, re-ported in six criterion validity studies (Table 4), was 73.15 % (range: 25.00–90.00 %) [31, 34, 38, 42, 47, 50]. The median specificity score of the measures used, reported in six stud-ies, was 87.30 % (range: 46.00–98.00 %) [31, 34, 38, 42, 47, 50]. The median PPV score of the measures used, reported in seven studies, was 90.00 % (range: 54.00–96.80 %) [34, 38, 42, 43, 47, 49, 50]. The median NPV score of the measures used, reported in three studies, was 84.00 % (range: 78.50– 85.00 %) [34, 38, 47] (Tables 3 and 4).
Risk of bias within studies (COSMIN)
For the BDI / BDI-II and brief versions (BDI-FS, mBDI; see Table 5), the quality of information was rated: fair for
over-all reliability (n= 2 [24, 39]); fair (n= 2 [36, 47]) or excellent
(n= 4 [7, 24, 39, 41]) for content validity; fair for hypothesis
testing (n= 7 [7, 24, 36, 39–41, 47]); fair for criterion
val-idity (n= 2 [36, 47]); fair for responsiveness (n= 1
[39]). No papers measured the structural validity or cross-cultural validity of the BDI. For the BDI-FS and the mBDI, no papers assessed reliability, structural validity, cross-cultural validity, or responsiveness; and, for the mBDI no paper assessed criterion validity.
For the CES-D, the quality of information was rated:
poor (n= 1 [33]) or fair (n= 1 [45]) for overall reliability;
fair (n= 1 [33]) or excellent (n= 2 [44, 48]) for content
validity; fair (n= 1 [33]) to good (n= 1 [48]) for
struc-tural validity; fair (n= 3 [33, 43, 44]) to good (n= 2 [45,
48]) for hypothesis testing; poor (n= 1 [43]) to fair (n= 1
[33]) for criterion validity; fair for responsiveness (n= 1
[45]). No paper assessed cross-cultural validity.
For the CMDI, the quality of information was rated: fair
for overall reliability (n= 2 [37, 49]); excellent for content
validity (n= 3 [35, 37, 49]); fair for structural validity (n=
1 [37]); fair for hypothesis testing (n= 3 [35, 37, 49]); poor
for cross-cultural validity (n= 1 [49]); fair for
responsive-ness (n= 1 [35]). No paper assessed criterion validity.
For the PHQ-9, the quality of information was rated:
poor for overall reliability (n= 2 [33, 46]); fair for content
validity (n= 2 [33, 46]); fair for structural validity (n= 1
[33]); fair for hypothesis testing (n= 2 [33, 46]); fair for
cri-terion validity (n= 1 [33]). No paper assessed
cross-cultural validity or responsiveness.
For the two-item measure, the quality for the informa-tion was rated: excellent for content validity; fair for
hypothesis testing and fair for criterion validity [38]; no paper assessed overall reliability, structural and cross-cultural validity or responsiveness.
For the HADS, the quality of information was rated: fair
(n= 1 [42]) to good (n= 1 [31]) for hypothesis testing; and,
fair (n= 1 [42]) to good (n= 1 [31]) for criterion validity.
For the YSQ, the quality for the information was rated: fair
(n= 1 [34]) for hypothesis testing; and, fair (n= 1 [34]) for
criterion validity. For the one-item measure, the quality
for the information was rated: fair (n= 1 [50]) for
hypoth-esis testing; and, fair (n= 1 [50]) for criterion validity. No
paper assessed reliability, content validity, structural valid-ity, cross-cultural validity or responsiveness of the HADS, the YSQ or the one-item measure.
Synthesis of results BDI
For the reliability of the BDI (n= 2), internal consistency
was generally good (α= 0.86 for the full BDI-II [24]) with
a standard error of measurement (SEM) of 3.26 for test-retest reliability [39], but only acceptable for the somatic
symptom cluster (α= 0.64 [24]). In studies of content
validity, people with MS and major depressive disorder (MDD) had higher scores than controls (on the BDI-II [24]) and were responsive to treatment [39]; one study reported that the BDI lacked face validity for people with MS [7], but this was contradicted by later studies [24, 39]. Studies tested hypotheses related to somatic
symp-toms common to MS and depression (n= 3 [7, 24, 39])
and the general utility of the instrument in people with
MS (n= 1 [47]). The findings for the studies were
con-flicted with one study providing evidence that the BDI was sensitive enough to show difference in treatment scores [39] and with other studies providing evidence that the BDI is confounded by MS-related symptoms [7]. All researchers called for more research on the over-lap of MS and depression symptoms and the utility of depression measures for PwMS. For criterion validity (Table 4), using DSM-diagnosed MDD as a gold stand-ard, the BDI demonstrated 71 sensitivity and 79 % speci-ficity for a cut point of 13 points (mild depression [47]).
In studies of content validity, non-depressed PwMS scored highly on a number of symptoms of depression measured by the mBDI (Table 2 [41]), and face validity was investigated for both the mBDI [41] and the BDI-FS [36]. The BDI-FS was found to be more sensitive to treatment effects than the HDRS (or HADS), whereas Strober and Arnett [41], suggested a sort of hierarchy in assessing depression in PwMS. Strober and Arnett [41] suggested that the following (‘branch’) symptoms sad-ness, pessimism, sense of failure, disappointment and changes in appetite and/or weight were indicative of de-pression in MS. On the other hand they suggested that the following (‘trunk’) symptoms, fatigue, work difficulty,
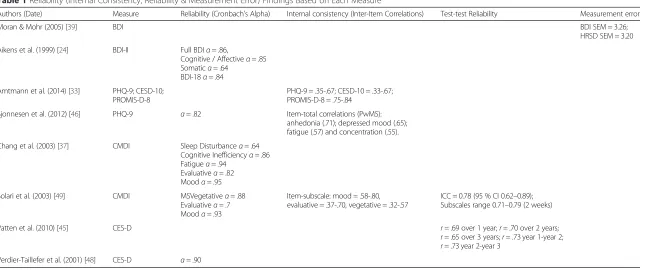
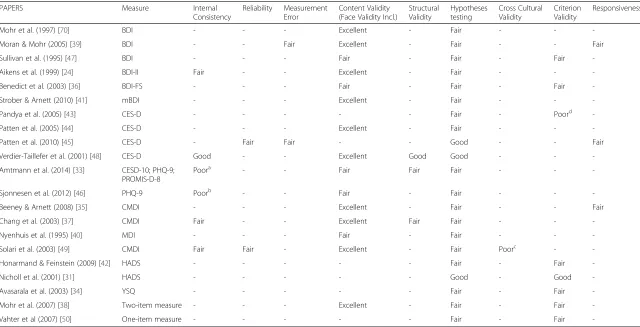
Table 1Reliability (Internal Consistency, Reliability & Measurement Error) Findings Based on Each Measure
Authors (Date) Measure Reliability (Cronbach’s Alpha) Internal consistency (Inter-Item Correlations) Test-test Reliability Measurement error
Moran & Mohr (2005) [39] BDI BDI SEM = 3.26;
HRSD SEM = 3.20
Aikens et al. (1999) [24] BDI-II Full BDIα= .86,
Cognitive / Affectiveα= .85 Somaticα= .64
BDI-18α= .84
Amtmann et al. (2014) [33] PHQ-9; CESD-10; PROMIS-D-8
PHQ-9 = .35-.67; CESD-10 = .33-.67; PROMIS-D-8 = .75-.84
Sjonnesen et al. (2012) [46] PHQ-9 α= .82 Item-total correlations (PwMS):
anhedonia (.71); depressed mood (.65); fatigue (.57) and concentration (.55).
Chang et al. (2003) [37] CMDI Sleep Disturbanceα= .64
Cognitive Inefficiencyα= .86 Fatigueα= .94
Evaluativeα= .82 Moodα= .95
Solari et al. (2003) [49] CMDI MSVegetativeα= .88
Evaluativeα= .7 Moodα= .93
Item-subscale: mood = .58-.80, evaluative = .37-.70, vegetative = .32-.57
ICC = 0.78 (95 % CI 0.62–0.89); Subscales range 0.71–0.79 (2 weeks)
Patten et al. (2010) [45] CES-D r =.69 over 1 year;r= .70 over 2 years;
r= .65 over 3 years;r= .73 year 1-year 2;
r= .73 year 2-year 3
Verdier-Taillefer et al. (2001) [48] CES-D α= .90
Note: HRSD = Hamilton Rating Scale for Depression
Hind
et
al.
BMC
Psychiatry
(2016) 16:278
Page
5
of
indecision, irritability, loss of interest, loss of libido, cry-ing, dissatisfaction, self-criticism, were common in MS but were indicative of depression if the symptoms were disproportionate to the medical illness [41]. The
[image:6.595.61.540.98.658.2]hypotheses tested related to the general validity of the BDI-FS [36] and somatic symptoms common to MS and depression for the mBDI [41]. The BDI-FS demonstrated moderate correlations (internal consistency) with the
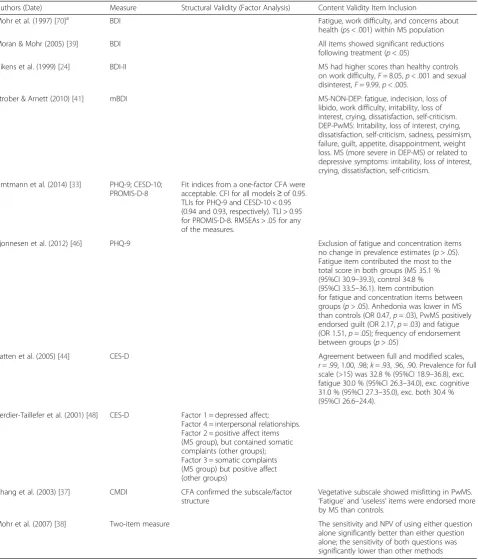
Table 2Structural and Content Validity Findings by Measure
Authors (Date) Measure Structural Validity (Factor Analysis) Content Validity Item Inclusion
Mohr et al. (1997) [70]a BDI Fatigue, work difficulty, and concerns about
health (ps < .001) within MS population
Moran & Mohr (2005) [39] BDI All items showed significant reductions
following treatment (p< .05)
Aikens et al. (1999) [24] BDI-II MS had higher scores than healthy controls
on work difficulty,F= 8.05,p< .001 and sexual disinterest,F= 9.99,p< .005.
Strober & Arnett (2010) [41] mBDI MS-NON-DEP: fatigue, indecision, loss of
libido, work difficulty, irritability, loss of interest, crying, dissatisfaction, self-criticism. DEP-PwMS: Irritability, loss of interest, crying, dissatisfaction, self-criticism, sadness, pessimism, failure, guilt, appetite, disappointment, weight loss. MS (more severe in DEP-MS) or related to depressive symptoms: irritability, loss of interest, crying, dissatisfaction, self-criticism.
Amtmann et al. (2014) [33] PHQ-9; CESD-10; PROMIS-D-8
Fit indices from a one-factor CFA were acceptable. CFI for all models≥of 0.95. TLIs for PHQ-9 and CESD-10 < 0.95 (0.94 and 0.93, respectively). TLI > 0.95 for PROMIS-D-8. RMSEAs > .05 for any of the measures.
Sjonnesen et al. (2012) [46] PHQ-9 Exclusion of fatigue and concentration items
no change in prevalence estimates (p> .05). Fatigue item contributed the most to the total score in both groups (MS 35.1 % (95%CI 30.9–39.3), control 34.8 % (95%CI 33.5–36.1). Item contribution for fatigue and concentration items between groups (p >.05). Anhedonia was lower in MS than controls (OR 0.47,p= .03), PwMS positively endorsed guilt (OR 2.17,p= .03) and fatigue (OR 1.51,p= .05); frequency of endorsement between groups (p> .05)
Patten et al. (2005) [44] CES-D Agreement between full and modified scales,
r= .99, 1.00, .98;k= .93, .96, .90. Prevalence for full scale (>15) was 32.8 % (95%CI 18.9–36.8), exc. fatigue 30.0 % (95%CI 26.3–34.0), exc. cognitive 31.0 % (95%CI 27.3–35.0), exc. both 30.4 % (95%CI 26.6–24.4).
Verdier-Taillefer et al. (2001) [48] CES-D Factor 1 = depressed affect; Factor 4 = interpersonal relationships. Factor 2 = positive affect items (MS group), but contained somatic complaints (other groups); Factor 3 = somatic complaints (MS group) but positive affect (other groups)
Chang et al. (2003) [37] CMDI CFA confirmed the subscale/factor structure
Vegetative subscale showed misfitting in PwMS. ‘Fatigue’and‘useless’items were endorsed more by MS than controls.
Mohr et al. (2007) [38] Two-item measure The sensitivity and NPV of using either question
alone significantly better than either question alone; the sensitivity of both questions was significantly lower than other methods Note: Studies that are not included in the table either did not assess content validity or did not report it.a
ANOVAS but does not reportfvalues. DEP = Depressed
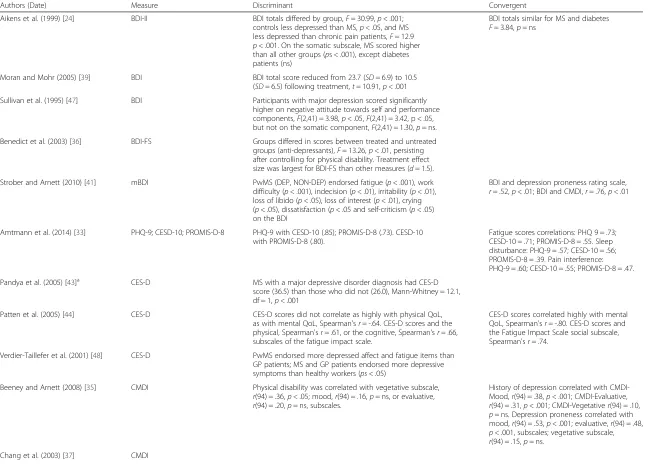
Table 3Hypotheses Testing Findings by Measure
Authors (Date) Measure Discriminant Convergent
Aikens et al. (1999) [24] BDI-II BDI totals differed by group,F= 30.99,p< .001;
controls less depressed than MS,p< .05, and MS less depressed than chronic pain patients,F= 12.9
p< .001. On the somatic subscale, MS scored higher than all other groups (ps < .001), except diabetes patients (ns)
BDI totals similar for MS and diabetes
F= 3.84,p= ns
Moran and Mohr (2005) [39] BDI BDI total score reduced from 23.7 (SD= 6.9) to 10.5
(SD= 6.5) following treatment,t= 10.91,p< .001
Sullivan et al. (1995) [47] BDI Participants with major depression scored significantly
higher on negative attitude towards self and performance components,F(2,41) = 3.98,p< .05,F(2,41) = 3.42, p < .05, but not on the somatic component,F(2,41) = 1.30,p= ns.
Benedict et al. (2003) [36] BDI-FS Groups differed in scores between treated and untreated
groups (anti-depressants),F= 13.26,p< .01, persisting after controlling for physical disability. Treatment effect size was largest for BDI-FS than other measures (d= 1.5).
Strober and Arnett (2010) [41] mBDI PwMS (DEP, NON-DEP) endorsed fatigue (p< .001), work
difficulty (p< .001), indecision (p< .01), irritability (p< .01), loss of libido (p< .05), loss of interest (p< .01), crying (p< .05), dissatisfaction (p< .05 and self-criticism (p< .05) on the BDI
BDI and depression proneness rating scale,
r= .52,p< .01; BDI and CMDI,r= .76,p< .01
Amtmann et al. (2014) [33] PHQ-9; CESD-10; PROMIS-D-8 PHQ-9 with CESD-10 (.85); PROMIS-D-8 (.73). CESD-10 with PROMIS-D-8 (.80).
Fatigue scores correlations: PHQ 9 = .73; CESD-10 = .71; PROMIS-D-8 = .55. Sleep disturbance: PHQ-9 = .57; CESD-10 = .56; PROMIS-D-8 = .39. Pain interference: PHQ-9 = .60; CESD-10 = .55; PROMIS-D-8 = .47.
Pandya et al. (2005) [43]a CES-D MS with a major depressive disorder diagnosis had CES-D
score (36.5) than those who did not (26.0), Mann-Whitney = 12.1, df = 1,p< .001
Patten et al. (2005) [44] CES-D CES-D scores did not correlate as highly with physical QoL,
as with mental QoL, Spearman'sr= -.64. CES-D scores and the physical, Spearman'sr= .61, or the cognitive, Spearman'sr= .66, subscales of the fatigue impact scale.
CES-D scores correlated highly with mental QoL, Spearman'sr= -.80. CES-D scores and the Fatigue Impact Scale social subscale, Spearman'sr= .74.
Verdier-Taillefer et al. (2001) [48] CES-D PwMS endorsed more depressed affect and fatigue items than GP patients; MS and GP patients endorsed more depressive symptoms than healthy workers (ps< .05)
Beeney and Arnett (2008) [35] CMDI Physical disability was correlated with vegetative subscale,
r(94) = .36,p< .05; mood,r(94) = .16,p= ns, or evaluative,
r(94) = .20,p= ns, subscales.
History of depression correlated with CMDI-Mood,r(94) = .38,p< .001; CMDI-Evaluative,
r(94) = .31,p< .001; CMDI-Vegetativer(94) = .10,
p= ns. Depression proneness correlated with mood,r(94) = .53,p< .001; evaluative,r(94) = .48,
p< .001, subscales; vegetative subscale,
r(94) = .15,p= ns.
Chang et al. (2003) [37] CMDI
Hind
et
al.
BMC
Psychiatry
(2016) 16:278
Page
7
of
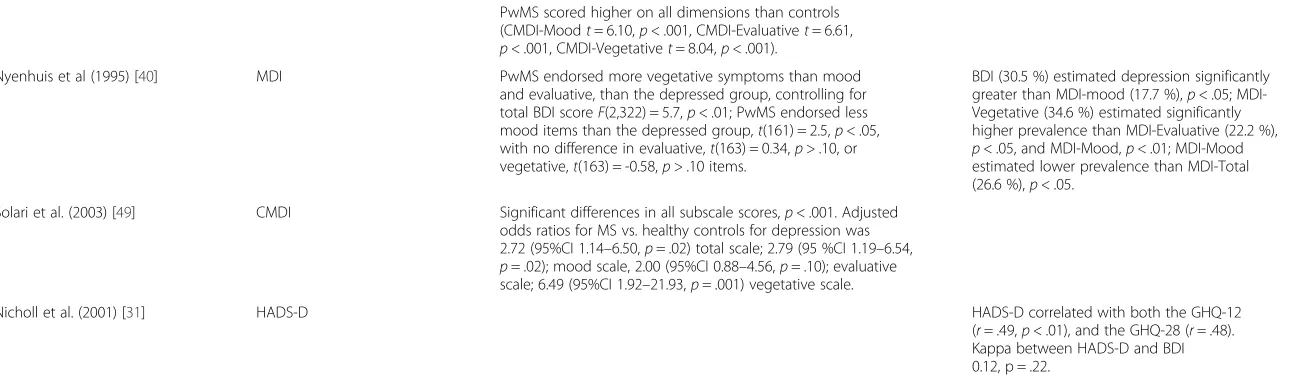
Table 3Hypotheses Testing Findings by Measure(Continued)
PwMS scored higher on all dimensions than controls (CMDI-Moodt= 6.10,p< .001, CMDI-Evaluativet= 6.61,
p< .001, CMDI-Vegetativet= 8.04,p< .001).
Nyenhuis et al (1995) [40] MDI PwMS endorsed more vegetative symptoms than mood
and evaluative, than the depressed group, controlling for total BDI scoreF(2,322) = 5.7,p< .01; PwMS endorsed less mood items than the depressed group,t(161) = 2.5,p< .05, with no difference in evaluative,t(163) = 0.34,p> .10, or vegetative,t(163) = -0.58,p> .10 items.
BDI (30.5 %) estimated depression significantly greater than MDI-mood (17.7 %),p< .05; MDI-Vegetative (34.6 %) estimated significantly higher prevalence than MDI-Evaluative (22.2 %),
p< .05, and MDI-Mood,p< .01; MDI-Mood estimated lower prevalence than MDI-Total (26.6 %),p< .05.
Solari et al. (2003) [49] CMDI Significant differences in all subscale scores,p< .001. Adjusted odds ratios for MS vs. healthy controls for depression was 2.72 (95%CI 1.14–6.50,p= .02) total scale; 2.79 (95 %CI 1.19–6.54,
p= .02); mood scale, 2.00 (95%CI 0.88–4.56,p= .10); evaluative scale; 6.49 (95%CI 1.92–21.93,p= .001) vegetative scale.
Nicholl et al. (2001) [31] HADS-D HADS-D correlated with both the GHQ-12
(r= .49,p< .01), and the GHQ-28 (r= .48). Kappa between HADS-D and BDI 0.12, p = .22.
Note: studies that are not included in the table either did not assess construct validity or did not report it.aPaper talks about Mann-Whitney chi square–test does not exist. QoL = Quality of Life; GHQ = General Health Questionnaire
Hind
et
al.
BMC
Psychiatry
(2016) 16:278
Page
8
of
Table 4Criterion Validity Findings by Measure
Authors (Date) Measure Criterion Measure Correlation Sensitivity Specificity ROC Curve Analysis PPV NPV
Benedict et al (2003) [36] BDI-FS BDI, CES-D, neuropsychiatric inventory (NPI)
BDIr= .85,p< .001; CES-Dr= .86,p< .001; NPI subscales range
r= .32-.50,ps< .05
Sullivan et al. (1995) [47] BDI Structured clinical interview (DSM)
88 % (≥9), 71 % (≥13) 46 % (≥9), 79 % (≥13)
54 % (≥9), 70 % (≥13)
84 % (≥9), 79 % (≥13)
Honarmand and Feinstein (2009) [42]
HADS-D (≥8)
SCID-I (DSM) 90 %, (95%CI 73–98)*
86.7 % (95%CI 68–96)* fatigue item excluded (≥6)
87.3 %, (95%CI 81–92)* 86.7 % (95%CI 80–92)* fatigue item excluded (≥6)
AUC = 0.94, 0.93 fatigue item excluded (≥6)
90.6 %, 90.6 % fatigue item excluded (≥6)
Nicholl et al. (2001) [31] HADS-D BDI (Predictive) r= .58,p< .01 25 % - When using cut-off of 5/6 (identified by ROC curve), 75 %
86 % - When using cut-off of 5/6 (identified by ROC curve), 69 %
Identified the optimum cut-off of 5/6 when compared to the BDI.
Avasarala et al. (2003) [34] YSQ BDI (Cut-off of≥13) 65.3 % (95%CI 50–78) 87.3 %
(95%CI 77–94)
78.0 % (95%CI 62–89)
78.5 % (95%CI 68–87)
Mohr et al. (2007) [38] Two-item measure
SCID (DSM) Both questions: 51 %
(95%CI 38–63), either: 99 % (95%CI 91–100), 1 only: 75 % (95%CI 62–84), 2 only: 75 % (95%CI 62–84)
Both: 98 % (95%CI 94–99), either: 87 % (95%CI 81–91), 1 only: 94 % (95%CI 89–97), 2 only: 94 % (95%CI 89–97)
Both: 90 % (95%CI 74–97), either: 72 % (95%CI 61–80), 1 only: 73 % (95%CI 61–83), 2 only: 81 % (95%CI 68–89)
Both: 85 % (95%CI 80–89), either: 99 % (95%CI 96–100), 1 only: 91 % (95%CI 86–95), 2 only: 91 % (95%CI 86–95)
Pandya et al. (2005) [43] CES-D DSM-IV psychiatric interview
59.6 % (95%CI 45.0–74.1) for major depression; 74.5 % (95%CI 61.5–87.4) for any depressive disorder.
Solari et al. (2003) [49] CMDI Previously diagnosed according to DSM-IV
Total scale: 96.8 %; mood: 96.9 %; evaluative and vegetative: 75.0 %
Vahter et al (2007) [50] One-item measure
BDI (>10 cut-off) and structured clinical interview
81%a 89%a 93.5%a
Note: Studies that are not included in the table either did not assess criterion or did not report it.aExtracted from Manoj and Sivan (2007) [52]*Calculated by EL. SCID = Structured Clinical Interview for DSM Disorders; ROC = Receiver operating characteristic
Hind
et
al.
BMC
Psychiatry
(2016) 16:278
Page
9
of
Table 5Methodological Quality of Each Article per Measurement Property and Instrument According to COSMIN Checklist
PAPERS Measure Internal
Consistency
Reliability Measurement Error
Content Validity (Face Validity Incl.)
Structural Validity
Hypotheses testing
Cross Cultural Validity
Criterion Validity
Responsiveness
Mohr et al. (1997) [70] BDI - - - Excellent - Fair - -
-Moran & Mohr (2005) [39] BDI - - Fair Excellent - Fair - - Fair
Sullivan et al. (1995) [47] BDI - - - Fair - Fair - Fair
-Aikens et al. (1999) [24] BDI-II Fair - - Excellent - Fair - -
-Benedict et al. (2003) [36] BDI-FS - - - Fair - Fair - Fair
-Strober & Arnett (2010) [41] mBDI - - - Excellent - Fair - -
-Pandya et al. (2005) [43] CES-D - - - Fair - Poord
-Patten et al. (2005) [44] CES-D - - - Excellent - Fair - -
-Patten et al. (2010) [45] CES-D - Fair Fair - - Good - - Fair
Verdier-Taillefer et al. (2001) [48] CES-D Good - - Excellent Good Good - -
-Amtmann et al. (2014) [33] CESD-10; PHQ-9; PROMIS-D-8
Poora - - Fair Fair Fair - -
-Sjonnesen et al. (2012) [46] PHQ-9 Poorb - - Fair - Fair - -
-Beeney & Arnett (2008) [35] CMDI - - - Excellent - Fair - - Fair
Chang et al. (2003) [37] CMDI Fair - - Excellent Fair Fair - -
-Nyenhuis et al. (1995) [40] MDI - - - Fair - Fair - -
-Solari et al. (2003) [49] CMDI Fair Fair - Excellent - Fair Poorc -
-Honarmand & Feinstein (2009) [42] HADS - - - Fair - Fair
-Nicholl et al. (2001) [31] HADS - - - Good - Good
-Avasarala et al. (2003) [34] YSQ - - - Fair - Fair
-Mohr et al. (2007) [38] Two-item measure - - - Excellent - Fair - Fair
-Vahter et al (2007) [50] One-item measure - - - Fair - Fair
-Notes:aThis paper was rated poor due to not calculating internal consistency for each subscale separately.bThis paper was evaluated poor for not assessing the unidimensionality of the measure, although we understand that might not have been the purpose of the study.c
Multiple group Confirmatory Factor Analysis or Differential Item Function not performed/assessed.d
No correlations or AUC calculated
Hind
et
al.
BMC
Psychiatry
(2016) 16:278
Page
10
of
neuropsychiatric inventory and strong correlations with the BDI and CES-D [36]. The BDI-FS was strongly
cor-related (criterion validity) with the BDI-II (r= 0.85) and
CES-D (r= 0.86 [36]).
CES-D
For the reliability of the CES-D (n= 3), internal
consistency was excellent (α= 0.90 [48]), but inter-item
correlations were poor to acceptable (0.33–0.67 [33])
and test-retest reliability ranged from moderate (r =
0.65) to strong (r =0.73) over different time intervals
[45]. In studies of content validity (n= 3 [33, 44, 48]),
there was strong agreement between the results of tests
with and without fatigue and cognition questions (r =
0.98–1.00; k =0.90–0.96 [44]) suggesting that the
instru-ments were not contaminated by the presence of som-atic symptoms common to MS and depression. The issue of contamination is addressed fully in the Discus-sion section. An investigation of face validity found that CES-D captured a broad range of depression (including mildly, moderate and severely depressed); however there were conflicting results on the measure's structure for
the MS population [33, 44, 48]. For structural validity (n
= 2 [33, 48]) the fit indices for a one-factor CFA were
ac-ceptable, with CFI of ≥0.95, TLI <0.95 and a RMSEA
which did not meet the recommended level [33]. In an exploratory factor analysis (EFA), four factors (depressed affect, positive affect, somatic complaints and interper-sonal relationships) explained more than 50 % of the variance in test scores between MS and non-MS popula-tions indicating good structural validity [48]. Studies tested hypotheses related to the utility or predictive value [43, 44], longitudinal utility [45], and the general reliability and validity of the scale [48]. Using the DSM-diagnosed MDD as a gold standard (criterion validity), the PPV of the CES-D was 59.6 % [43]; the CES-D was
strongly correlated with the PHQ-9 (r= 0.85 [33]). For
responsiveness, insufficient data were available to calcu-late the SEM [45].
CMDI
For the reliability of the CMDI (n= 2 [37, 49]), no
over-all value was available for internal consistency, but in-ternal consistency of the subscales was generally
acceptable to excellent (α= 0.64–0.95 [37, 49]), the low
value being for sleep disturbance [37]. Researchers ob-served intra-class correlations of 0.71 to 0.79 over two weeks for test-retest reliability [37]; inter-item correla-tions were moderate-to-strong for mood (0.58 to 0.80) and evaluative (0.37 to 0.70) but moderate for vegetative (0.32 to 0.57) subscales [49]. In studies of content
valid-ity (n= 4 [35, 37, 40, 49]), the vegetative subscale was
shown to be misfitting (unweighted item fit mean square <0.7 or >1.3 [51]) with the MS participants more likely
to endorse the fatigue and feeling useless items than controls [37]; investigation of face validity found that the CMDI had a 'consistent overlap' with the MS symptoms [35, 40, 49]. Studies tested hypotheses related to somatic
symptoms common to MS and depression (n= 2 [35,
40]), the general reliability and validity of the instrument
in people with MS (n= 1 [37]) and cross-cultural
valid-ation of the instrument (n= 1 [49]). Overall, the papers
consistently found that there should be a distinction be-tween depression and MS symptoms and that the CMDI provided a good measure for that. Regarding structural
validity (n= 1 [37]) a five-factor CFA found an excellent
fit between the proposed model and data, with CFI of 0.93, the normed fit index (NFI) of 0.90, the non-normed fit index (NNFI) of 0.92. For responsiveness there was insufficient data available in any study to cal-culate the SEM [35]. There were no studies which assessed criterion validity.
HADS
For the HADS, studies tested hypotheses related to the general utility of the measure [31, 42] and found it to be a useful screening instrument with high criterion-related validity for depression. Using the DSM-diagnosed MDD as a gold standard (criterion validity), the sensitivity and specificity of the HADS were 90 and 87.3 % for the whole scale or, 86.7 % for both when fatigue items were excluded [42]. Using the BDI as a gold standard, the HADS had a sensitivity and specificity of 75 and 69 %
respectively, and the two were moderately correlated (r
= 0.58 [31]). No study evaluated the reliability, the con-tent validity, the structural validity or cross cultural val-idity of the HADS.
PHQ-9
Regarding the reliability of the PHQ-9 (n= 2), internal
consistency was good (α= 0.82 [46]) with inter-item
cor-relations of 0.35–0.67 (moderate to acceptable [33]); item-total correlations were good for anhedonia (0.71), acceptable for depressed mood (0.65), and moderate for fatigue (0.57) and concentration (0.55) subscales [46]. Fatigue items made the highest contribution to the total score in all participants, with no significant differences between MS and control participants (content validity
[46]). For structural validity (n= 1 [33]) the fit indices
for a one-factor CFA were acceptable, with a CFI of >0.95, TLI <0.95 and the RMSEA did not meet the
rec-ommended level (>0.05). Studies tested hypotheses (n=
2) related to somatic symptoms [46] and the compara-tive psychometric properties of different scales [33]. One study tested hypotheses related to the convergent valid-ity of PHQ-9, the CESD-10 and PROMIS-D-8 [33]. No study evaluated the criterion validity or cross cultural validity of the PHQ-9.
One study tested hypotheses related to the criterion validity of the YSQ. Using the BDI as a gold standard, the sensitivity and specificity were 65.3 (95 CI 50–78)% and 87.3 (95 % CI 77–94)% respectively [34]. No study evaluated the reliability, content validity, structural valid-ity, cross cultural validity or responsiveness
Discussion Principal Findings
In this section, we summarise the evidence for dimensions of validity across different instruments, referring in brackets to the number of participants and the COSMIN-rated quality of each study. The criterion validity of instru-ments, using DSM-diagnosed MDD as a gold standard, can be ranked in order of decreasing sensitivity and speci-ficity, where reported, as follows. For sensitivity: (1) HADS
(n= 140; Fair) 90 %; (2) the one-item measure (n= 134;
Fair [50, 52]) 81 %; (3) BDI (n= 46; Fair [47]) 71 %; (4) the
two-item measure (n= 260; Fair [38]) 51 %. For specificity:
(1) the two-item measure (n= 260; Fair [38]) 98 %; (2) the
one-item measure (n= 134; Fair [50, 52]) 89 %; (3) HADS
(n= 140; Fair) 87 %; (4) BDI (n= 46; Fair [47]) 79 %. The
structural validity of instruments, using a variety of methods
can be ranked as follows. For CFA: (1) CMDI (n= 433;
Fair [37]) excellent; (2=) CESD (n= 455; Fair [33])
ac-ceptable; (2=) PHQ-9 (n= 455; Fair [33]) acceptable.
There was little to distinguish the three measures (CES-D, PHQ-9 and CMDI) in terms of their CFI scores or, for the CES-D and PHQ-9, their TLI or RMSEA scores (with the latter not meeting the recommended level in either case). The method of assessing content validity across studies varied widely, prohibiting any ranking of studies. In brief, the CES-D (three studies rated fair [33] or excellent [44, 48]) found no issue with the inclusion of somatic symptoms, whereas the BDI (6 studies rated as fair [36, 47] or excellent [7, 24, 39, 41]), and CMDI (3 studies rated as excellent [35, 37, 49]) identified some issues with the inclusion of somatic symptoms in at least one study [24].
The most sustained debate on content validity sur-rounded the BDI. While Mohr et al. (1997) [7], found that ‘fatigue’,‘work difficulty’and‘concerns about health’items were MS-confounded (disproportionately endorsed within PwMS) on the BDI, this was not confirmed by Aikens et al. [24] (using the BDI-II), or Moran and Mohr [39], who concluded all items were suitable for inclusion. Those studies which presented an overall score for internal consistency (reliability) can be ranked as follows: (1)
CES-D (n= 857; Good [48]) α= 0.90; (2) BDI-II (n= 105; Fair
[24])α= 0.86; (3) PHQ-9 (n= 173; poor [46])α= 0.82.
Strengths and limitations
The current review both updates and overcomes a num-ber of limitations of the earlier review by Minden and
colleagues. First, our search strategy was considerably more sensitive, identifying 15 eligible studies which had been published at the time of the searches (August 2011) for the Minden article. Although our search strat-egy is limited in its use of bibliographic databases, we believe the associated risk of bias is low. When resources are constrained, the use of Medline and PsycINFO, along with checking reference lists, is justifiable in some topic areas [53]. In mental health research, each data-base performs well in the retrieval of mental health
lit-erature [54], and their use in combination is
recommended [55]. On the other hand, CINAHL rarely retrieves unique references for most topic areas [56]. The exclusion of non-English language studies can have more impact on the comprehensiveness of a review, al-though there is no evidence that it causes systematic bias [57]. Empirical evidence of bias stemming from the omission of grey literature is available for systematic views of therapeutic interventions [58], but not from re-views of validation studies. The impact of this omission on our review and the one by Minden and colleagues is unknown, but future reviews might supplement searches of bibliographic databases with grey literature databases such as PsycEXTRA and the ProQuest Dissertations & Theses Database, in addition to Google searches.
Systematic reviews which critically appraise and com-pare the measurement properties of different instru-ments can provide a sound basis for the selection of instruments [59]. Unlike the Minden team, we took a formal approach to the assessment of study quality using the COSMIN checklist [23]. While some will find this helpful, the rating of validation studies can be argued to be subjective, especially on issues such as face validity. We were unable to undertake statistical synthesis due to the absence of confidence intervals associated with sum-mary statistics in most reports. Our findings are also af-fected by outcome reporting bias, especially in studies evaluating reliability and criterion validity; for instance, of 10 studies evaluating criterion validity seven pre-sented sensitivity and specificity, eight prepre-sented PPV and four presented NPV. Outcome reporting bias may present a similar threat to the credibility of overviews of validation studies as documented in systematic reviews of therapeutic interventions [60, 61], and psychometri-cians should consider following the Core Outcome Mea-sures in Effectiveness Trials (COMET) initiative in the development of core outcome sets for the COSMIN domains [62].
Key messages for people with MS, therapists, policy-makers
Item inclusion & symptom overlap
Concerns over item inclusion, given the overlap be-tween MS and somatic depressive symptoms, were
expressed by authors of studies included in this re-view, with self-report measures providing no oppor-tunity to probe whether depressive symptoms are influenced by disease severity [63]. Despite such symptom overlap, the exclusion of items on this basis is questionable [64]. A suggested alternative is the use of different instruments, such as the BDI-FS, which is less reliant on the somatic symptoms that can confound assessment [36], or the BDI-II [65], which removes a number of items that might be MS related. Similarly, a different interpretation or
ana-lysis of standard BDI scores, such as the ‘trunk and
branch’ model proposed by Strober and Arnett,
sep-arating out those symptoms common to MS, may help to overcome such issues of overlap [41]. An al-ternate approach would be to adopt more generic measures that assess extent to which physical and mental health problems impact on a person’s quality of life [66]. In this context, a lack of functioning or activity impairment is important to the extent to which it impacts on quality of life, rather than the severity of their symptoms or condition. This might involve the use of generic measure of health related quality of life, such SF-36, or measures that better reflect the impact of mental health problems identi-fied in the literature [67].
Usefulness of measures
The one- or two-item measures [38, 50] may be prefera-ble for use in people with MS (PwMS) as they are quick and easy to administer, potentially overcoming any diffi-culties arising from cognitive impairment [34]. Further-more, they do not contain items relating to somatic symptoms and so may overcome the overlap issues iden-tified above. However, they only offer an indication of the presence of depression and not its severity, which may be useful to clinicians in identifying cases but not to researchers in assessing treatment responsiveness, for example.
Assessment criterion
Researchers and clinicians should consider the util-ity of the measures discussed in relation to their ability to identify probable cases of depression. As such, when using self-report scales as a case finder, it is important to identify the optimum cut-off value [47]. This is difficult as studies often use different cut-off values to signify a case (somebody who, whilst not diagnosed, could benefit from talking therapy) and sub-standard criterion against which to assess the measure (e.g. the BDI rather than struc-tured clinical interview). A robust criterion gives greater confidence around the recommendation of such cut-off values. This review suggests that the
modification of the BDI, accounting for MS symp-toms, may be an effective way to assess depression in this patient group [63], though further independent research is warranted.
Need for further research
High quality validation studies are currently unavailable and are needed on the following topics: the reliability of the two-item measure, HADS, YSQ, the one-item meas-ure; the structural validity of the BDI, two-item measure, HADS, YSQ, the one-item measure; the cross-cultural validity of the BDI (and its short-form variants), CES-D, PHQ-9, CESD-10, PROMIS-D-8, two-item measure, HADS, YSQ, the one-item measure; the responsiveness of the two-item measure, HADS, YSQ, the one-item measure review.
Further evidence is needed for most measures in asses-sing their utility in this patient group, along with the ap-propriateness of some of the items they use. Whilst item exclusion may not be appropriate, altered scoring or inter-pretation may be necessary. More investigation of existing measures should seek to compare them against struc-tured clinical interview, a gold standard measure, given the questions raised regarding the validity of the BDI [47]. Given the prevalence of BDI-based mea-sures, further research should seek to validate the BDI-II, mBDI and BDI-FS in people with MS. Use of measures besides the BDI should be considered, such as the HADS and PHQ-9, given their apparent ro-bustness to confounding from MS symptoms. Asses-sing the accepability of instruments to PwMS uAsses-sing qualitative methods, such as Think Aloud method-ology, is an essential complement to quantitative evaluation [68, 69].
Conclusions
All instruments identified in this review need further work on validation and reliability for use in people with MS. On the basis of the available evidence regarding these measures, researchers and practitioners are faced with trade-offs depending on their priorities. In addition, researchers conducting further studies need to pay spe-cial attention to the contamination of the depression in-ventory scores overlapping with the MS symptoms. However, it may be that a strategic evaluation is re-quired in the approach to measuring depression in people with MS. Rather than researchers pursing a piecemeal approach to specific psychometric properties of a range of outcome measures, an alternative might be to move towards constructing and adopting Quality of Life measures that emphasise the fulfilment of a person’s needs rather than prioritising the severity of specific symptoms.
Appendix 1
Appendix 2
[image:14.595.58.540.100.414.2]Fig. 1Flow Diagram of Study Selection
Table 6Studies Excluded at Full Text Screening, With Reasons
Authors (Date) Reason for Exclusion
Quaranta et al. (2012) [1] Measure was not self-report
Knox (2010) [2] Review/narrative
Manoj & Sivan (2007) [3] Nocentini (2006) [4]
Doward et al. (2009) [5] Doesn’t assess depression
Fishman et al. (2004) [6] Groom et al. (2003) [7]
McGuigan & Hutchinson (2004) [8] Mueller & Girace (1988) [9] O’Brien et al. (2007) [10] Schwartz et al. (2011) [11]
Cook et al. (2012) [12] Doesn't assess validation of depression measure in MS
Gold et al. (2003) [13] Horton et al. (2010) [14] Provinciali et al. (1999) [15]
Alajbegovic et al. (2009) [16] Not a validation study
Good et al. (1992) [17]
Leon et al. (2001) [18] Sample not solely PwMS
Lykouras et al. (1998) [19]
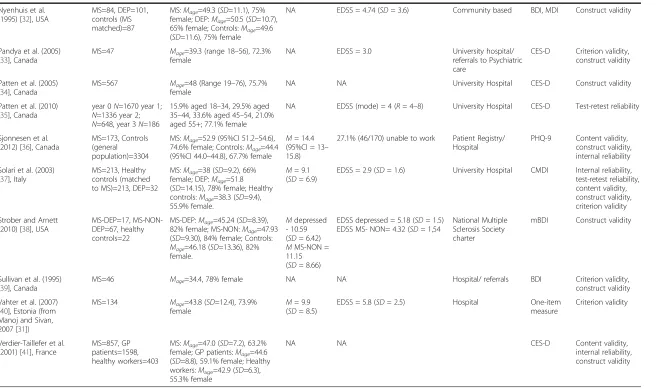
[image:14.595.57.542.471.735.2]Table 7Study Characteristics
Authors (Date), Country Samples Baseline Characteristics MS Diagnosis
(years)
Disability Status Recruitment Method Measures Validity/ Reliability Tested
Aikens et al. (1999) [20], USA MS=105, Depressed=34, Healthy=80, Diabetes=71, Chronic pain=80
MS:Mage=41.9(SD= 9.0), 63%
female; Depressed:Mage=39.3
(SD=14.6), 65% female; Healthy controls:MageMage=34.4
(SD=8.3), 50% female; Diabetes:
Mage=55.9 (SD=16.7), 56% female;
Chronic pain:Mage=45.0
(SD=13.9), 56% female
M= 11 years Expanded Disability Status Scale = 0.0 - 7.5 (Median = 3.8) Moderate Disability
University Hospital BDI-II Construct validity; content validity; internal reliability (cronbach's alpha)
Amtmann et al. (2014) [21], USA
MS = 455 Mage=52.9 (SD=10.8); 83%
female (N=377) and 17% male (N=78);
M= 14.5 (SD= 10)
Moderate level University Hospital/
National Multiple Sclerosis Society charter
CESD–10, PHQ-9 PROMIS-D-8 Evaluation of dimensionality; inter-item correlation; discriminant/ convergent validity
Avasarala et al. (2003) [22], USA
MS=120 Ages: 20–29N=6, 30–39N=25, 40–49N=53, 50–59N=32, 60–69
N=4; 71% female
NA NA University Hospital YSQ Criterion validity
Beeney and Arnett (2008) [23], USA
3 year follow-up MS=52; cross-sectional analysis, MS=96.
N=52:Mage=46.57 (SD=7.61);
N=96:Mage=47.41 (SD=8.98).
M(T1) =14.04 (SD= 9.37);M
(T2) = 16.87 (SD= 9.24)
EDSS (T1) =4.55 (SD= 1.44) EDSS (T2) = 4.71 (SD= 1.61)
University Hospital/ National Multiple Sclerosis Society charter
CMDI Construct validity
Benedict et al. (2003) [24], USA
MS=54 Mage=42.8 (SD=9.7), 79% female NA EDSS median = 2.5
(R= 0.0 - 7.0)
University Hospital BDI-FS Criterion and construct validity
Chang et al. (2003) [25], USA
MS=433; plus 'standardisation sample'n=420
MS:Mage=45.0 (SD=10.0), 69.4%
female; Standardisation sample described in Nyenhuis et al. (1998) [26]:Mage=43.1
NA NA University Hospital CMDI Content validity,
internal reliability, construct validity
Honarmand and Feinstein (2009) [27], Canada
Study 1: MS=140; Study 2: MS=40, MD=21, Matched controls (no MD) = 19
Mage=44.6 (SD=10.3), 75% female M= 8.8 (SD= 6.8)
EDSS = 4.0 (SD= 2.34) Hospital HADS Criterion validity
Mohr et al. (1997) [28], USA
MS =184, DEP =72, controls (college students) = 555
MS:Mage=44.0, 68% female; DEP:
Mage=47.5, 51% female; Controls:
Mage=20.2, 55%
NA NA University Hospital BDI Face validity
Mohr et al. (2007) [29], USA
MS = 260 Mage=51 (SD=10.5), 73% female M= 19
(SD= 10.5)
NA University Hospital Two-item
measure
Criterion validity, construct validity
Moran and Mohr (2005) [30], USA
MS (with depression)=42
Mage=43.0 (SD=10.3), 69% female M= 6.6
(SD= 6.1)
NA University Hospital/
referrals/ National Multiple Sclerosis Society Charter
BDI Construct validity
Nicholl et al. (2001) [31], UK
MS=88 Mage=48.97 (SD=8.9), 75% female M= 11.8
(SD= 7.5)
NA Hospital/Rehabilitation
ward
HADS Criterion validity, construct validity
Appendix 3 Hind
Table 7Study Characteristics(Continued)
Nyenhuis et al. (1995) [32], USA
MS=84, DEP=101, controls (MS matched)=87
MS:Mage=49.3 (SD=11.1), 75% female; DEP:Mage=50.5 (SD=10.7), 65% female; Controls:Mage=49.6 (SD=11.6), 75% female
NA EDSS = 4.74 (SD= 3.6) Community based BDI, MDI Construct validity
Pandya et al. (2005) [33], Canada
MS=47 Mage=39.3 (range 18–56), 72.3%
female
NA EDSS = 3.0 University hospital/
referrals to Psychiatric care
CES-D Criterion validity, construct validity
Patten et al. (2005) [34], Canada
MS=567 Mage=48 (Range 19–76), 75.7%
female
NA NA University Hospital CES-D Construct validity
Patten et al. (2010) [35], Canada
year 0N=1670 year 1;
N=1336 year 2;
N=648, year 3N=186
15.9% aged 18–34, 29.5% aged 35–44, 33.6% aged 45–54, 21.0% aged 55+; 77.1% female
NA EDSS (mode) = 4 (R= 4–8) University Hospital CES-D Test-retest reliability
Sjonnesen et al. (2012) [36], Canada
MS=173, Controls (general population)=3304
MS:Mage=52.9 (95%CI 51.2–54.6), 74.6% female; Controls:Mage=44.4 (95%CI 44.0–44.8), 67.7% female
M= 14.4 (95%CI = 13– 15.8)
27.1% (46/170) unable to work Patient Registry/ Hospital
PHQ-9 Content validity, construct validity, internal reliability
Solari et al. (2003) [37], Italy
MS=213, Healthy controls (matched to MS)=213, DEP=32
MS:Mage=38 (SD=9.2), 66% female; DEP:Mage=51.8 (SD=14.15), 78% female; Healthy controls:Mage=38.3 (SD=9.4), 55.9% female.
M= 9.1 (SD= 6.9)
EDSS = 2.9 (SD= 1.6) University Hospital CMDI Internal reliability, test-retest reliability, content validity, construct validity, criterion validity
Strober and Arnett (2010) [38], USA
MS-DEP=17, MS-NON-DEP=67, healthy controls=22
MS-DEP:Mage=45.24 (SD=8.39), 82% female; MS-NON:Mage=47.93 (SD=9.30), 84% female; Controls:
Mage=46.18 (SD=13.36), 82% female.
Mdepressed - 10.59 (SD= 6.42)
MMS-NON = 11.15 (SD= 8.66)
EDSS depressed = 5.18 (SD= 1.5) EDSS MS- NON= 4.32 (SD= 1,54
National Multiple Sclerosis Society charter
mBDI Construct validity
Sullivan et al. (1995) [39], Canada
MS=46 Mage=34.4, 78% female NA NA Hospital/ referrals BDI Criterion validity,
construct validity
Vahter et al. (2007) [40], Estonia (from Manoj and Sivan, 2007 [31])
MS=134 Mage=43.8 (SD=12.4), 73.9%
female
M= 9.9 (SD= 8.5)
EDSS = 5.8 (SD= 2.5) Hospital One-item
measure
Criterion validity
Verdier-Taillefer et al. (2001) [41], France
MS=857, GP patients=1598, healthy workers=403
MS:Mage=47.0 (SD=7.2), 63.2% female; GP patients:Mage=44.6 (SD=8.8), 59.1% female; Healthy workers:Mage=42.9 (SD=6.3),
55.3% female
NA NA CES-D Content validity,
internal reliability, construct validity
Note:MSMultiple Sclerosis,MDMajor Depression,DEPDepressed,NANot Available
Hind
et
al.
BMC
Psychiatry
(2016) 16:278
Page
16
of
Abbreviations
AUC, area under the curve; BDI / BDI-II, Beck Depression Inventory; BDI-FS, Beck Depression Inventory-Fast Screen; CES-D, Center for Epidemiologic Studies Depression Scale (identical to the CESD-10); CESD-10, Center for Epidemiologic Studies Depression Scale 10-item scale (identical to the CES-D); CFA, confirmatory factor analysis; CFI, comparative fit index; CI, confidence interval; CINAHL, Cumulative Index to Nursing and Allied Health Literature; CMDI / MDI, chicago multiscale depression inventory; COSMIN, COnsensus-based Standards for the selection of health status Measurement INstruments; DSM, Diagnostic and Statistical Manual of Mental Disorders; HADS, Hospital Anxiety and Depression Scale; ICC, Intraclass correlation coefficient; mBDI, Modified Beck Depression Inventory; MDD, major depressive disorder; MeSH, Medical Subject Headings; MS, multiple sclerosis; NPV, negative predictive value; PHQ-9, Patient Health Questionnaire; PPV, positive predictive value; PROMIS-D-8, Patient Reported Outcome Measurement Information System Depression 8-item bank; PROSPERO, International PROSPEctive Register Of systematic reviews; PwMS, people with multiple sclerosis; RMSEA, root mean square error of approximation; SEM, standard error of measurement; TLI, Tucker-Lewis index; YSQ, Yale Single Question
Acknowledgements
We would like to thank the Journal for considering the article and the reviewers for their comments.
Funding
Not applicable.
Availability of data and materials
The dataset(s) supporting the conclusions of this article are included within the article (and its additional files). The full electronic search strategy for both databases is available on the PROSPERO database.
Authors’contributions
DH had the original idea for the review, and developed initial versions of the search strategy and inclusion criteria. An initial version of the review was produced by RW performed the search, and screened papers for review. Following that DH re-developed the search terms with DB, who independently reviewed citations for eligibility. DK independently reviewed citations for eligibility, extracted data and assessed eligible studies with COSMIN appraisal tool. DH, DK and DB drafted the article and revised the manuscript. EL provided statistical support and run analysis (Confidence Intervals). RW MB and CC commented on, edited, and revised the manuscript critically for important intellectual content. All authors read and approved the final manuscript.
Competing interests
The authors declare that they have no competing interests.
Consent for publication
Not Applicable.
Ethics approval and consent to participate
Not applicable.
Author details
1Clinical Trials Research Unit, School of Health and Related Research, University of Sheffield, Sheffield, UK.2Department of Psychology, Sociology and Politics, Sheffield Hallam University, Heart of the Campus, 42 Collegiate Crescent, SheffieldS10 2BQUK.3Breast Cancer Now, London, UK.4Centre for Psychological Services Research, Department of Psychology, University of Sheffield, Sheffield, UK.
Received: 10 November 2015 Accepted: 15 June 2016
References
1. Rudick R, Cohen J, Weinstock-Guttman B, Kinkel R, Ransohoff R. Management of multiple sclerosis. N Engl J Med. 1997;337:1604–11. 2. Compston A, Coles A. Multiple sclerosis. Lancet. 2008;372:1502–17. 3. Benito-León J, Morales JM, Rivera-Navarro J, Mitchell A. A review about the
impact of multiple sclerosis on health-related quality of life. Disabil Rehabil. 2003;25:1291–303.
4. Siegert RJ, Abernethy DA. Depression in multiple sclerosis: a review. J Neurol Neurosurg Psychiatry. 2005;76:469–75.
5. Hind D, O’Cathain A, Cooper CL, Parry GD, Isaac CL, Rose A, Martin L, Sharrack B. The acceptability of computerised cognitive behavioural therapy for the treatment of depression in people with chronic physical disease: a qualitative study of people with multiple sclerosis. Psychol Health. 2010;25: 699–712.
6. American Psychiatric Association. Diagnostic and statistical manual of mental disorders (DSM). Washington, DC: American Psychiatric Association; 1994. 7. Mohr DC, Goodkin DE, Likosky W, Beutler L, Gatto N, Langan MK.
Identification of Beck Depression Inventory items related to multiple sclerosis. J Behav Med. 1997;20:407–14.
8. Mayou R, Hawton K. Psychiatric disorder in the general hospital. Br J Psychiatry. 1986;149:172–90.
9. Endicott J. Measurement of depression in patients with cancer. Cancer. 1984;53(10 Suppl):2243–8.
10. Feldman E, Mayou R, Hawton K, Arden M, Smith EB. Psychiatric disorder in medical in-patients. QJM. 1987;63:405–12.
11. House A. Mood disorders in the physically ill–problems of definition and measurement. J Psychosom Res. 1988;32:345–53.
12. Dew MA, Ragni MV, Nimorwicz P. Infection with human immunodeficiency virus and vulnerability to psychiatric distress. A study of men with hemophilia. Arch Gen Psychiatry. 1990;47:737–44.
13. Minden SL, Feinstein A, Kalb RC, Miller D, Mohr DC, Patten SB, Bever C, Schiffer RB, Gronseth GS, Narayanaswami P. Evidence-based guideline: assessment and management of psychiatric disorders in individuals with MS: report of the guideline development subcommittee of the American academy of neurology. Neurology. 2014;82:174–81.
14. Jüni P, Altman DG, Egger M. Assessing the quality of controlled clinical trials. BMJ. 2001;323:42–6.
15. Glasziou P, Meats E, Heneghan C, Shepperd S. What is missing from descriptions of treatment in trials and reviews? BMJ Br Med J. 2008;336:1472–4. 16. Mokkink LB, Terwee CB, Patrick DL, Alonso J, Stratford PW, Knol DL, Bouter
LM, de Vet HCW. The COSMIN study reached international consensus on taxonomy, terminology, and definitions of measurement properties for health-related patient-reported outcomes. J Clin Epidemiol. 2010;63:737–45. 17. Webster R, Hind D, Kaklamanou D, Beever D, Barkham M, Cooper C. The
assessment of depression in people with multiple sclerosis: a systematic review of psychometric validation studies. PROSPERO 2014:CRD42014010597. http://www.crd.york.ac.uk/PROSPERO/display_record.asp?ID=CRD42014010597. 18. Gold SM, Schulz H, Mönch A, Schulz K-H, Heesen C. Cognitive impairment
in multiple sclerosis does not affect reliability and validity of self-report health measures. Mult Scler. 2003;9:404–10.
19. Horton M, Rudick RA, Hara-Cleaver C, Marrie RA. Validation of a self-report comorbidity questionnaire for multiple sclerosis. Neuroepidemiology. 2010; 35:83–90.
20. Rabins PV, Brooks BR. Emotional disturbance in multiple sclerosis patients: validity of the General Health Questionnaire (GHQ). Psychol Med. 1981;11:425–7. 21. Smith RA, Berg JE, Pope LE, Callahan JD, Wynn D, Thisted RA. Validation of
the CNS emotional lability scale for pseudobulbar affect (pathological laughing and crying) in multiple sclerosis patients. Mult Scler. 2004;10:679–85. 22. Randolph JJ, Arnett PA, Higginson CI, Voss WD. Neurovegetative symptoms
in multiple sclerosis: relationship to depressed mood, fatigue, and physical disability. Arch Clin Neuropsychol. 2000;15:387–98.
23. Mokkink LB, Terwee CB, Patrick DL, Alonso J, Stratford PW, Knol DL, Bouter LM, de Vet HCW. The COSMIN checklist for assessing the methodological quality of studies on measurement properties of health status measurement instruments: an international Delphi study. Qual Life Res. 2010;19:539–49.
24. Aikens JE, Reinecke MA, Pliskin NH, Fischer JS, Wiebe JS, McCracken LM, Taylor JL. Assessing depressive symptoms in multiple sclerosis: is it necessary to omit items from the original Beck Depression Inventory? J Behav Med. 1999;22:127–42.
25. Altman DG, Lausen B, Sauerbrei W, Schumacher M. Dangers of using “optimal”cutpoints in the evaluation of prognostic factors. J Natl Cancer Inst. 1994;86:829–35.
26. Cronbach LJ. Coefficient alpha and the internal structure of tests. Psychometrika. 1951;16:297–334.
27. Nunnally J. Psychometric Theory. 2nd ed. New York: McGraw-Hill; 1978. 28. Fleiss J. The design and analysis of clinical experiments - Wiley classics
library edition. New York: Wiley; 1986.