This is a repository copy of
The Effect of the Transducer Parameters on Spatial Resolution
in Plane-Wave Imaging
.
White Rose Research Online URL for this paper:
http://eprints.whiterose.ac.uk/101042/
Version: Accepted Version
Proceedings Paper:
Alomari, Z, Harput, S orcid.org/0000-0003-0491-4064, Hyder, S et al. (1 more author)
(2015) The Effect of the Transducer Parameters on Spatial Resolution in Plane-Wave
Imaging. In: Proceedings. 2015 IEEE International Ultrasonics Symposium (IUS), 21-24
Oct 2015, Taipei, Taiwan. IEEE . ISBN 978-1-4799-8182-3
https://doi.org/10.1109/ULTSYM.2015.0547
© 2015 IEEE. This is an author produced version of a paper published in 2015 IEEE
International Ultrasonics Symposium (IUS). Personal use of this material is permitted.
Permission from IEEE must be obtained for all other uses, in any current or future media,
including reprinting/republishing this material for advertising or promotional purposes,
creating new collective works, for resale or redistribution to servers or lists, or reuse of any
copyrighted component of this work in other works. Uploaded in accordance with the
publisher's self-archiving policy.
[email protected] https://eprints.whiterose.ac.uk/
Reuse
Unless indicated otherwise, fulltext items are protected by copyright with all rights reserved. The copyright exception in section 29 of the Copyright, Designs and Patents Act 1988 allows the making of a single copy solely for the purpose of non-commercial research or private study within the limits of fair dealing. The publisher or other rights-holder may allow further reproduction and re-use of this version - refer to the White Rose Research Online record for this item. Where records identify the publisher as the copyright holder, users can verify any specific terms of use on the publisher’s website.
Takedown
If you consider content in White Rose Research Online to be in breach of UK law, please notify us by
The Effect of the Transducer Parameters on Spatial
Resolution in Plane-Wave Imaging
Zainab Alomari
12, Sevan Harput
1, Safeer Hyder
1and Steven Freear
11 Ultrasonics and Instrumentation Group, School of Electronic and Electrical Engineering, University of Leeds, Leeds, UK 2 Mosul University, Mosul, Iraq.
Abstract—Plane-Wave imaging (PWI) can produce a complete image after a single transmission of an unfocused ultrasound beam, and therefore can achieve ultrahigh frame rates of thou-sands frames per second. Many ultrasound imaging applications, such as shear wave elastography, require ultrahigh frame rates. However, due to the lack of a focusing point in PWI, it is not possible to derive an expression for the spatial resolution based on the f-number. This work aims to study the transducer parameters that affect the imaging quality in PWI in form of spatial resolution. Ultrasound imaging systems with different frequencies, bandwidths and transducer widths at a range of imaging depths are simulated and the effect of each parameter is studied separately. Based on this study, an empirical expression for PWI lateral resolution is produced, which reveals the direct proportion of the lateral resolution with the wavelength and imaging depth and the inverse proportion with the total width of the transducer.
Index Terms—spatial resolution; Plane Wave imaging; Field II simulation; FWHM; Transducer Parameters
I. INTRODUCTION
Spatial resolution is usually used to measure the imaging quality of ultrasound imaging systems. It is divided into axial and lateral resolutions that are defined as the minimum distinguishable distance between two adjacent points located perpendicular and parallel to the transducer surface, respec-tively [1] [2].
Lateral resolution is usually measured for ultrasound imag-ing systems from the beam width, which is calculated at the focal depth using the following formula [3] [4]:
Rlat=n.f#.λ (1)
where n is a constant depending on the measurement technique, λ is the wavelength and f# is the f-number that represents the ratio between the focal depth and aperture width. The lack of a focal point makes this formula useless for estimating PWI lateral resolution, where the focal depth approaches infinity and thus lateral resolution becomes infinity too.
The main difference between PWI and conventional linear imaging is that all the transducer elements are used to transmit once and receive the echoes to produce a single image, while in linear imaging, each line of data is produced by a separate transmission and reception [5]. This enables PWI to produce images with thousands of frames per second. However, the lack of focusing reduces the PWI quality and prevents it from
being used for many applications that require ultrahigh frame rates.
This work seeks for the imaging parameters that have a direct effect on PWI spatial resolution using Field II software [6] [7], in order to improve the imaging quality by selecting the appropriate transducer parameters. The studied parameters are the imaging depth, central frequency, wavelength, bandwidth and the total width of the transducer.
II. METHODOLOGY
For Field II simulation of PWI, a 5MHz, 30mm width linear array transducer, with one wavelength centre-to-centre distance between elements is used. The parameters whose effects are studied are the imaging depth, central frequency, bandwidth and the total width of the transducer. The imaging quality is assessed based on spatial resolution, which is measured at the −6dB intensity drop, or the Full Width at Half Maximum (FWHM) [8]. The resolution was measured for the array transducer when varying the frequency from 1 to30MHz, bandwidth from 10 to 100%, total aperture width from 10 to 60mm and imaging depth from 3 to 200mm. One parameter is changed each time while fixing the other parameters. Afterwards, using Matlab curve fitting tool, a mathematical expression is derived that best explains the relation between the resolution and the varying parameters.
During beamforming, the conventional Delay-And-Sum (DAS) method was used. This method applies delays to the signals received from the transducer elements depending on the location of the point the value of which is being calculated, and then sums the signals. This is explained by [9]:
p(x, z) =
N
X
j=1
Tj(t−τj(x, z)) (2)
wherep(x, z)is the point located atxin the lateral direction and z in the axial direction, N is the number of elements andTj(t)is the value received by the jth receiving element.
τ(x, z) is the time required for the signal to travel from the transmitter to the field point and return to receiver j. After beamforming, the signal is envelope detected, converted to decibel and then displayed.
III. SIMULATIONS ANDRESULTS
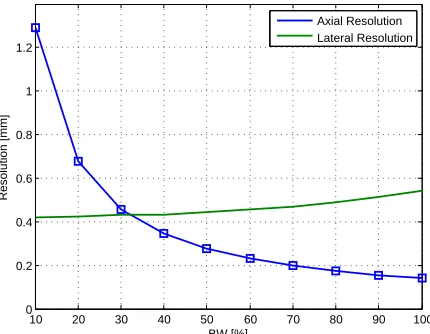
effect of each of these parameters is required to be studied sep-arately. As shown in figure 1, the bandwidth has a minor effect on the lateral resolution in the range 10 to 100%, unlike axial resolution which shows inverse proportion to the bandwidth. It is confirmed during this study that the bandwidth is the only parameter affecting PWI axial resolution, which means that both linear imaging and PWI has the same axial resolution. On contrast, lateral resolution is found to be affected by the other imaging parameters as follows:
10 20 30 40 50 60 70 80 90 100 0
0.2 0.4 0.6 0.8 1 1.2
BW [%]
Resolution [mm]
[image:3.612.316.548.56.241.2]Axial Resolution Lateral Resolution
Fig. 1. The effect of the bandwidth on spatial resolution for a
transducer with central frequency of 5MHz, total width of 30mm and a pitch of one wavelength.
For a transducer with a fixed bandwidth of 5MHz, the central frequency was changed from 1 to 30MHz. The spatial resolution for this range of frequencies is shown in figure 2. According to this figure, increasing the frequency to higher than 10MHz has a negligible effect on lateral resolution. So that for a transducer with a band of frequencies from 3 to
15MHz, the use of a 10MHz central frequency with 100%
bandwidth gives a better resolution than the use of 13MHz central frequency which reduces the bandwidth to 30.77%, or to 14MHz which reduces the bandwidth to14.29%. Field II simulation for a tissue phantom model containing 5 cystic lesions of 1, 2, 3, 4 and 5mm diameters and other 5 highly scattering regions of the same dimensions is used to show the difference between PWI quality in these three cases in figure 3, where it is shown that increasing the central frequency from 10MHz in figure 3a to 13 and 14MHz in figure 3b,c is not adding any improvement and the quality is a little decreased due to lowering the bandwidth. The frequencies and bandwidths used in this figure are given in detail in Table I.
Figure 4 shows the effect of the wavelength on lateral resolution for the frequencies between 1 and 10MHz at a speed of sound of 1540m/s. The figure shows a nearly linear relationship between the wavelength and lateral resolution at this range of frequencies.
During studying the effect of the aperture width on spatial resolution, the pitch was set to one wavelength as in most of the medical transducers [10]. The resulted curves are shown in figure 5, where the lateral resolution is found to be inversely
0 5 10 15 20 25 30
0 0.5 1 1.5 2 2.5 3 3.5
Central frequency [MHz]
Resolution [mm]
Axial resolution Lateral resolution
Fig. 2. The effect of the central frequency on spatial resolution for a
[image:3.612.61.276.177.344.2]transducer with 5MHz bandwidth and total width of 30mm.
Fig. 3. PWI of a tissue phantom model using the frequencies and
bandwidths shown in Table I.
TABLE I
THE VALUES OF THE FREQUENCY AND THE CORRESPONDINGBANDWIDTH USED TO SIMULATEPWIFOR THETISSUEPHANTOM SHOWN IN FIGURE3
Figure 3
Frequency (MHz)
Bandwidth (%)
Bandwidth Range (MHz)
a 10 100 5-15
b 13 30.77 11-15
c 14 14.29 13-15
proportional to the aperture width for the range from 10 to 60mm while no effect was shown on axial resolution.
[image:3.612.314.558.283.458.2]0 0.2 0.4 0.6 0.8 1 1.2 1.4 1.6 0
0.5 1 1.5 2 2.5 3 3.5 4
lambda [mm]
[image:4.612.54.284.55.235.2]Lateral Resolution [mm]
Fig. 4. The effect of the wavelength on lateral resolution for the
frequencies between 1 and 10MHz at the 30mm depth. Transducer width is 30mm.
10 15 20 25 30 35 40 45 50 55 60 0
0.5 1 1.5
Total Transducer Width [mm]
Resolution [mm]
Axial Resolution Lateral Resolution
Fig. 5. The effect of the aperture width on spatial resolution at the
30mm depth for a transducer with a pitch of one wavelength and central frequency of 5MHz.
to unfocusing.
The results of this study show that the PWI lateral resolution value is directly proportional to the wavelength and imaging depth, and inversely proportional to the total transducer width. An empirical expression of the lateral resolution according to this study can be given by:
Rlat=k1.b (3)
where: b= λ.z
W (4)
wherezis the imaging depth,W is the total transducer width and k1 is a constant whose value was found using Matlab curve fitting tool to be 1.521. The degree of fitness between the data and the fitted curve is usually measured byR2where a value of 1 represents a perfect fitness [11]. Figure 8 shows the high fitness of the lateral resolution values measured from the simulations with the fitted curve of equation 3 (R2>0.97).
0 20 40 60 80 100 120 140 160 180 200 0
0.5 1 1.5 2 2.5 3
Imaging Depth [mm]
Resolution [mm]
[image:4.612.315.549.56.241.2]Axial Resolution Lateral Resolution
Fig. 6. The effect of the imaging depth on spatial resolution for a
transdcuer with 30mm width, a pitch of one wavelength and 5MHz central frequency.
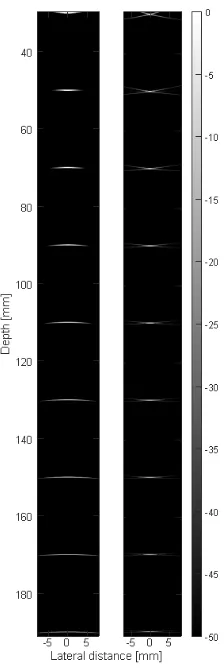
Fig. 7. 9 point scatterers located at the dpeths from 30 to 190mm
showing the change in the lateral resolution with increasing the depth in (Left) PWI and (Right) linear imaging focusing at 70mm depth.
IV. DISCUSSION
[image:4.612.369.481.282.616.2] [image:4.612.53.285.284.465.2]2 3 4 5 6 7 8 9 x 10⁻⁴
2 4 6 8 10 12 14x 10
−4
b [m]
LR [m]
[image:5.612.50.300.77.169.2]Lateral Resolution vs. b the fitting curve
Fig. 8. Matlab curve fitting tool for the lateral resolution versus b,
which resembles the wavelength multiplied by the imaging depth and divided by the total aperture width.
the lateral resolution was increasing logarithmically with the depth when attenuation presented. However, the curve was nearly linear for up to 50mm depth.
PWI lateral resolution according to the expression derived in this work is very close to that of linear imaging lateral resolution at the focal depth given in eq.1, this is due to the use of dynamic focusing at the receive in PWI. However, for the same transducer, PWI usually gives better lateral resolution as compared to linear imaging at the focal depth, as it uses all the transducer elements while linear imaging uses only part of these elements with each transmission. This can be noticed in figure 7.
A method to improve the imaging quality in PWI with preserving the high frame rate is to use Compounded PWI (CPWI), where multiple steered unfocused plane waves are av-eraged to produce a single high quality image. This technique reduces the noise level and improves the lateral resolution compared to PWI. However, compounding more than 3 angles adds no improvement to the lateral resolution [12]. Another way to improve the imaging quality of PWI is the use of the Minimum Variance adaptive beamforming [13], on the cost of increasing the amount of computations [14].
In Field II, the linear behaviour is simulated without con-sidering the non-linearity effect of the medium. In real life, harmonics that are multiples of the transmitted frequency are generated during the nonlinear propagation of ultrasound signals through the medium. When generated, the harmonic frequencies result in degrading the resolution in the fundamen-tal signal from which they take their energy. The amount of the generated harmonics is calculated by the shock parameter that depends on multiple factors according to the equation [15]:
σ= 2π
ρ0c30
P0f z(1 +
B
2A) (5)
Whereρ0,c0,P0,fandB/Aare the medium density, sound speed, transmitted pressure, fundamental frequency and non-linearity coefficient, respectively. The generation of the second harmonics increases and peaks when the shock parameter is between 1 and 3, where after 3, the harmonics are weakened by the attenuation due to their high frequencies.
The effect of the harmonics generation appears on both the central frequency and depth curves in figures 2 and 6; where
increasing f or z to a value that makes σ > 1 will result in increased harmonics amplitude. These harmonics weaken the fundamental and result in increasing the lateral resolution value to higher than the value given in the central frequency and depth curves starting from the limit that makesσ >1.
V. CONCLUSIONS
In this work, an empirical expression for PWI lateral reso-lution is produced, which clarifies the direct proportion of this resolution with the wavelength and the imaging depth, and its inverse proportion with the total width of the transducer. The bandwidth was confirmed to have no direct effect on lateral resolution. Axial resolution in PWI is not affected by the lack of focusing, but the bandwidth of the transmitted signal. The dependency of PWI spatial resolution on the transducer parameters makes the careful selection of the transducer an essential step for improving PWI quality.
REFERENCES
[1] J. J. Goldberger and J. Ng,Practical signal and image processing in
clinical cardiology. Springer, 2010.
[2] J. T. Bushberg and J. M. Boone, The essential physics of medical
imaging. Lippincott Williams & Wilkins, 2011.
[3] W. R. Hedrick,Technology for Diagnostic Sonography. Elsevier Health
Sciences, 2013.
[4] K. K. Shung,Diagnostic ultrasound: Imaging and blood flow
measure-ments. CRC press, 2005.
[5] J. Bercoff, “Ultrafast ultrasound imaging,”Ultrasound Imaging-Medical
Applications, pp. 3–24, 2011.
[6] J. A. Jensen and N. B. Svendsen, “Calculation of pressure fields from arbitrarily shaped, apodized, and excited ultrasound transducers,”
Ultrasonics, Ferroelectrics, and Frequency Control, IEEE Transactions
on, vol. 39, no. 2, pp. 262–267, 1992.
[7] J. A. Jensen, “Field: A program for simulating ultrasound systems,” in
10TH NORDICBALTIC CONFERENCE ON BIOMEDICAL IMAGING, VOL. 4, SUPPLEMENT 1, PART 1: 351–353. Citeseer, 1996. [8] S. Harput, J. McLaughlan, D. M. Cowell, and S. Freear, “New
perfor-mance metrics for ultrasound pulse compression systems,” inUltrasonics
Symposium (IUS), 2014 IEEE International. IEEE, 2014, pp. 440–443. [9] G. Montaldo, M. Tanter, J. Bercoff, N. Benech, and M. Fink, “Coherent plane-wave compounding for very high frame rate ultrasonography
and transient elastography,”Ultrasonics, Ferroelectrics and Frequency
Control, IEEE Transactions on, vol. 56, no. 3, pp. 489–506, 2009. [10] J.-G. Ng, R. T. Ssekitoleko, D. Flynn, R. W. Kay, C. E. D´emor´e,
S. Cochran, and M. P. Desmulliez, “Design, manufacturing and packag-ing of high frequency micro ultrasonic transducers for medical
applica-tions,” inElectronics Packaging Technology Conference (EPTC), 2011
IEEE 13th. IEEE, 2011, pp. 93–98.
[11] R. Righetti, S. Srinivasan, and J. Ophir, “Lateral resolution in
elastog-raphy,”Ultrasound in medicine & biology, vol. 29, no. 5, pp. 695–704,
2003.
[12] Z. Alomari, S. Harput, S. Hyder, and S. Freear, “Selecting the number and values of the cpwi steering angles and the effect of that on imaging
quality,” in Ultrasonics Symposium (IUS), 2014 IEEE International.
IEEE, 2014, pp. 1191–1194.
[13] I. K. Holfort, F. Gran, and J. A. Jensen, “Broadband minimum variance
beamforming for ultrasound imaging,”Ultrasonics, Ferroelectrics and
Frequency Control, IEEE Transactions on, vol. 56, no. 2, pp. 314–325, 2009.
[14] J.-F. Synnevag, A. Austeng, and S. Holm, “Adaptive beamforming
applied to medical ultrasound imaging,”Ultrasonics, Ferroelectrics and
Frequency Control, IEEE Transactions on, vol. 54, no. 8, pp. 1606–1613, 2007.
[15] F. A. Duck, “Nonlinear acoustics in diagnostic ultrasound,”Ultrasound