1
Declaration of interest: none1
A novel multi-objective decision support method for ship energy systems synthesis to enhance
2
sustainability
3
Nikoletta L. Trivyza a,*, Athanasios Rentizelas a, Gerasimos Theotokatos b
4
a Department of Design Manufacture and Engineering Management, University of Strathclyde, 75 Montrose
5
Street, G1 1XJ, Glasgow, UK
6
b Maritime Safety Research Centre, Department of Naval Architecture, Ocean and Marine Engineering,
7
University of Strathclyde, 100 Montrose Street, G4 0LZ, Glasgow, UK
8
*Corresponding Author. Email address: [email protected]
9
Abstract
10
The shipping industry has been facing great pressure to become more sustainable, emanating from the
11
increasingly stringent environmental regulations, fuel prices volatility and societal needs. As a result, a variety
12
of established technologies have been developed aiming to improve the environmental and economic
13
performance of the modern ship energy systems, however leading to additional challenges for the technology
14
selection during the design process. This study introduces an innovative method that integrates the economic
15
and environmental aspects of sustainability to support decisions on the synthesis of the modern ship energy
16
systems. The method includes a simulation model for predicting the energy systems performance during the ship
17
lifetime. A genetic algorithm, NSGA-II, is employed to solve the multi-objective combinatorial optimisation
18
problem of selecting the integrated ship energy systems configuration. The derived results are visualised to
19
reveal the Pareto front and the trade-offs among the objectives. The method is novel in supporting the synthesis
20
of the integrated ship energy systems, as it includes both environmental and economic objectives, as well as
21
evaluates the performance of the systems over an expected operational profile. The developed method is
22
implemented for the case study of an Aframax oil tanker and the derived results analysis indicates that the ship
23
energy systems sustainability can be improved by adopting LNG fuel and dual fuel engines technology, as well
24
as by introducing other emerging technologies like fuel cells and carbon capture, although the latter are
25
associated with a high cost. It is concluded that the inclusion of both environmental and economic objectives
26
highlights the trade-offs between more environmentally friendly or cost efficient configurations, thus supporting
27
2
Keywords: ship energy systems synthesis, multi-objective optimisation, operational profile, Pareto front,29
decision support, environmental and economic sustainability
30
1. Introduction
31
In the past few years, there has been a growing interest to enhance the sustainability of shipping operations.
32
Shipping has a very important role in the global economy, with 90% of the global trade being transported by
33
ships [1]. Although ship transportation is considered one of the most environmentally friendly modes of
34
transport [2], great attention has been placed on improving the environmental sustainability due to the
35
magnitude of the shipping operations [3,4]. Global shipping accounts for approximately 3% of global CO2
36
emissions [5] and in the case where international shipping was a country it would be ranked the sixth carbon
37
emissions producer [6]. With regard to other anthropogenic emissions, 4-9% of global SOx and 15% of NOx
38
emissions are attributed to shipping operations [7] and their further increase of around 40-50% is anticipated
39
from 2000 to 2020 [8]. Finally, shipping operations have a major impact on the fossil fuel depletion as more
40
than 350 million tonnes of fossil fuels per year are consumed [9], corresponding to 5% of the total transportation
41
sector energy consumption [10].
42
Due to the significant environmental impact of the shipping operations, the environmental regulations
43
imposed in the shipping industry by the International Maritime Organisation (IMO) as well as national
44
authorities have become more stringent. Regulations have been implemented to set limits on the emissions of
45
NOx and SOx from ship engines and the intention is to become even stricter in the future [11]. IMO introduced
46
the first maritime energy efficiency regulation in 2011 [11], which is highly related to the reduction of the CO2
47
gas emissions. According to this regulation, all new vessels have to comply with the Energy Efficiency Design
48
Index (EEDI) [12] and all new and existing ships need to have a specific Ship Energy Efficiency Management
49
Plan (SEEMP) [13]. However, these measures could not manage to reach the global targets set for CO2
50
emissions [14]. In consequence, a Monitoring, Reporting and Verification (MRV) system for carbon dioxide
51
emissions was introduced by the EU [15]. Furthermore, it is discussed to introduce shipping operations into the
52
European Emission Trading Market Scheme (EU ETS) for CO2 emissions as well as to tax the carbon emissions
53
[16], in a manner similar to land-based power plants. As a result of this changing regulatory landscape, in order
54
to achieve compliance with the existing and future regulations, ship-owners will be necessitated to retrofit their
55
ship energy systems with emission reduction technologies, to use more expensive low-sulphur fuel, or to
56
3
Therefore, the shipping industry is required to pursue more sustainable operations, due to the environmental58
regulatory pressure, as well as the fuel prices volatility and the pressure from society. To satisfy the regulatory
59
requirements and fulfil the goals for sustainability, a shift to new more environmentally efficient technologies
60
and greener fuels is required [17]. A variety of existing and emerging technologies can be used to that purpose,
61
which can though increase the complexity of the modern ship energy systems due to the large number of
62
potential combinations and alternative technologies and as a result, render the energy systems selection process
63
even more challenging. Thus, this work proposes a method to support decisions for the selection of ship energy
64
systems, which aims to improve the environmental and economic sustainability, addresses the multi-component
65
integrated ship energy systems selection challenge and takes into consideration the operational and regulatory
66
requirements.
67
1.1
Background68
Ship energy systems are employed for covering the ship requirements for energy of various forms. The
69
major ship energy producers include the propulsion system and the electric and thermal auxiliary machinery that
70
are responsible for completing the ship mission [18]. The selection of the energy systems components is defined
71
as the synthesis process. More specifically, the generation of a number of possible alternative systems and the
72
selection among them according to their performance analysis is part of the synthesis process [19]. Several
73
studies were published to support decisions on the selection of specific ship technologies, as discussed in the
74
following paragraphs.
75
An extended number of studies focused on alternative emission reduction solutions to reduce anthropogenic
76
emissions from ships. In [20] and [21] the authors explored the economic impact and possibilities of SOx
77
emission reduction technologies. The selection of black carbon reduction technologies was addressed in [22].
78
Other researchers investigated the combination of NOx and SOx emission abatement technologies, regarding
79
their economic impact [23–25], whereas the simultaneous usage of NOx, SOx and CO2 abatement technologies
80
were investigated in [26]. Classification societies have compared and discussed the performance of different
81
alternatives in order to comply with the air pollution regulations for NOx and SOx emissions [27] or to reduce
82
the carbon footprint [28]. It is evident that there is a large number of emission reduction alternatives and several
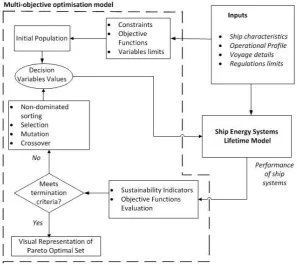
83
4
The waste heat recovery (WHR) system was also investigated as an alternative to reduce emissions and85
improve ship power plant energy efficiency. In a variety of studies, the performance of WHR systems regarding
86
economic and efficiency criteria was evaluated. Different WHR systems and their potential were reviewed in
87
[29]. Several authors focused on the evaluation of WHR systems applied to specific ship types; a
techno-88
economic evaluation of WHR system was performed in [30,31], whereas the energy and exergy efficiency of a
89
WHR was evaluated in [32]. The techno-economic performance of an Organic Rankine Cycle system (ORC)
90
was investigated in [33–35]. Simulating the ORC performance in order to optimise the energy efficiency was
91
reported in [36]. Studies on the optimisation of an ORC in order to improve the system efficiency were reported
92
in [37–39].
93
The evaluation of alternative propulsion systems and their integration with emission reduction or WHR
94
technologies, in order to reduce the environmental and economic impact of ships, have been extensively
95
discussed. The introduction of the LNG fuel for propulsion, in order to reduce CO2 emissions and operational
96
costs, has been addressed in [40]. The performance of a two-stroke dual fuel engine with respect of the NOx and
97
CO2 emissions reduction was investigated in [41]. The energy and exergy analysis of a turbo-generator and
98
steam turbine of an LNG carrier in order to improve the systems energy efficiency was discussed in [42]. The
99
technical and economic optimisation of the integrated power plant configuration of an LNG carrier that includes
100
a WHR, taking into account the weather conditions throughout the ship voyage was presented in [43]. The
101
techno-economic performance of alternative propulsion systems for Ferries and RoRo ships including dual fuel
102
engines and Selective Catalytic Reduction (SCR) was investigated in [44]. Regarding the carbon footprint
103
reduction, alternative propulsion systems for a tanker, including dual fuel engines and a WHR system were
104
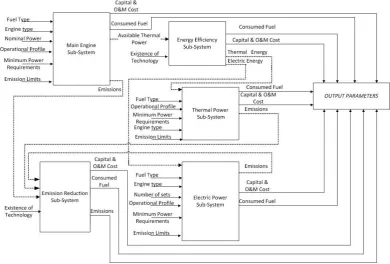
examined in [45]. In [46], the optimisation of a cruise ship propulsion system with a gas turbine and heat
105
recovery for steam and electric production was addressed. The economic optimisation of emission control
106
technologies simultaneously with the selection of the main engine was also analysed in [47]. Proposing more
107
innovative propulsion systems, an optimisation of the fuel consumption and the installation weight of a hybrid
108
propulsion system was performed in [48], the load allocation of a hybrid propulsion system on a cruise ship was
109
optimised in [49], whereas the economic optimisation of an electric propulsion system was addressed in [50].
110
Finally, innovative technologies that provide electric and thermal auxiliary power leading to an improved
111
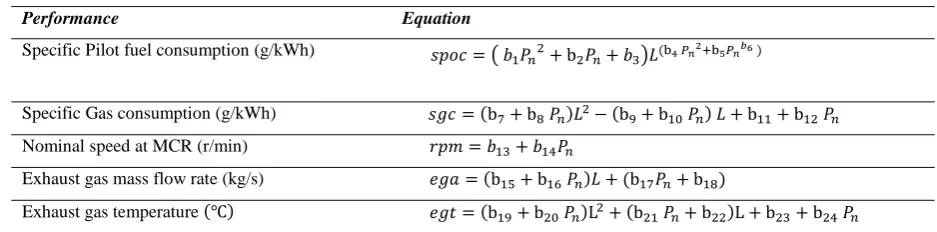
environmental impact have been investigated. The possibility of employing fuel cell systems as an auxiliary
112
5
thermal storage on board ships was discussed in [54], whereas the optimal photovoltaic system and the analysis114
of solar energy on board ships were addressed in [55] and [56], respectively.
115
Several studies aimed at improving the environmental impact of the ship energy systems by introducing
116
emission reduction technologies, energy efficient technologies, alternative fuels and emerging auxiliary
117
technologies. However, there is a lack in a systematic way of including the environmental objectives in the
118
optimisation process along with the economic objectives. Improving the sustainable performance of energy
119
systems requires adopting an approach that integrates the techno-economic and environmental assessment
120
[57,58]. Thus, the existing studies on ship energy systems synthesis lack in methods that integrate both aspects
121
of sustainability and therefore, ultimately fail to improve simultaneously both the environmental and economic
122
sustainability performance of ship energy systems.
123
The ship energy systems include a large number of components, which increase their complexity. In the
124
existing literature, studies have focused on the assessment of one or two specific components, a specific
125
predefined propulsion system or in other cases performed a comparative assessment of a limited number of
126
potential alternatives. However, an approach that addresses the integrated ship energy systems is required due to
127
the importance of the interconnections among the various sub-systems, the considerable number of components
128
and their non-linear interrelations [59]. Thus, a shift from component level to a more integrated approach has to
129
be adopted in order to address the system complexity, which is also recognised as a necessary step for
130
sustainable design [60]. In addition, since the systems are highly interactive, improving the performance of one
131
subsystem may lead to deteriorating another subsystem performance. It can therefore be inferred that an
132
integrated approach is required for the optimal synthesis and design of the ship energy systems.
133
According to the traditional ship energy systems synthesis techniques, the machinery is selected according
134
to previous experience or empirical criteria [46] aiming to address only one design point based on the nominal
135
power; thus, disregarding the variable operational profile and the off-design conditions that characterise the
real-136
life operation of ships. However, the ship during her lifetime follows a varying operational profile [61], usually
137
far away from the design point. In a specific case examined in the literature, even though the design speed of the
138
vessel was 21 knots, the ship-board measurements showed that the ship did not even reach 16 knots during her
139
operation [34]. In general, the ship operational profile differs significantly from the design points [62]. This
140
leads to underuse of the systems and as a consequence, to higher costs, potential reliability and safety issues
141
6
system in the design phase, the expected operational profile of the ship has to be employed [64]. Therefore, it is143
significant to incorporate the expected operational profile in the synthesis process of the ship energy systems, in
144
order to accurately assess the actual performance of the systems.
145
Based on the preceding discussion, two main gaps were identified in the literature. Firstly optimising the
146
ship energy systems synthesis considering the environmental and economic aspects of sustainability
147
simultaneously with the lifetime varying operational profile of ship systems and secondly, the lack of a method
148
capable of handling the generic energy ship systems synthesis problem challenges due to the variety of available
149
technologies and their interconnections. This work aims at addressing these gaps by proposing a novel method
150
to support decisions for the ship energy systems synthesis. To this purpose, a multi-objective method is
151
proposed that simultaneously considers and optimises environmental and economic objectives. In addition, a
152
simulation model of the integrated ship energy systems performance including all major systems is developed
153
and the evaluation of the ship energy systems is performed based on an expected operational profile.
154
The rest of the paper is organised as follows. The method developed in this work to support decisions for
155
ship energy systems synthesis is introduced in Section 2, which is subsequently applied to a case study, in order
156
to demonstrate its applicability in Section 3. The investigated case study results from the application are
157
discussed in Section 4 and the concluding remarks are presented in Section 5.
158
2. Method for supporting decisions on ship energy systems synthesis
159
A method is developed that supports the decision maker to make an informed decision regarding the
160
integrated ship energy systems synthesis. The proposed method includes a simulation tool and a multi-objective
161
optimisation algorithm and is illustrated in the flowchart shown in Figure 1. The ship energy systems
162
performance is estimated through mathematical modelling and is subsequently employed to obtain the specific
163
parameters required for the calculation of the environmental and economic indicators, leading to the
164
sustainability assessment of the investigated ship energy systems. A multi-objective optimisation algorithm is
165
finally used to simultaneously address the environmental and economic objectives providing a Pareto front of
166
7
168
Figure 1 Flowchart of the developed method for optimal ship energy systems synthesis
169
Based on the input and the variables ranges, the initial population is generated by the optimisation
170
algorithm. Subsequently, according to the decision variable values and the provided input parameters the
171
simulation model estimates the ship energy systems lifetime performance and uses it to calculate the indicators
172
for the assessment of the ship energy systems environmental and economic sustainability. These indicators form
173
the objective functions that are then evaluated. Following the evaluation of the objective functions, the
174
individual solutions are ranked and the selection, crossover and mutation operators are applied. The process is
175
repeated until the termination criteria are met and the Pareto front is visualised.
176
The optimisation requires a number of input parameters, regarding the ship characteristics (ship type and
177
deadweight), as well as the voyage details including the period of time the vessel sails in Emission Control
178
Areas (ECA) and the expected operating profile. The limits of the regulated emissions [65,66] and the minimum
179
propulsion power requirement [67] are calculated according to IMO regulations.
180
The inclusion of the operational profile is necessary in order to simulate the lifetime performance of the
181
ship energy systems. The operational profile represents the ship mechanical, thermal, and electric power
182
demands throughout the vessel lifetime. It is described through distinct operational phases, as have been
183
8
their duration, also defined as the frequency of occurrence. The developed method was implemented into a185
computational model in Matlab.
186
2.1
Mathematical modelling and simulation of ship energy systems187
Appropriate models were developed to simulate the performance and the behaviour of the investigated
188
system. Empirical models, also called black box, are often used since they do not require knowledge of the
189
system physical laws and can predict the output using a limited number of input parameters [59]. The empirical
190
models approach is selected as the most appropriate in this study due to the following reasons:
191
Only high-level details are needed, because a large number of technologies is modelled, including novel
192
technologies that are not yet established and their exact performance is not known.
193
There is interest only on the gaseous emissions and the cost of the systems.
194
An exact representation of reality is not needed for the assessment of energy systems at the design stage.
195
Only steady-state conditions are studied.
196
A ship is considered a complex system consisting of several subsystems that serve a function. Each
197
subsystem consists of components that have a different performance and are highly interconnected [59].
198
Applying a systems engineering approach to model the complex ship energy systems allows to tackle the
199
complexity and address the integrated system including the involved interactions [68]. Systems engineering
200
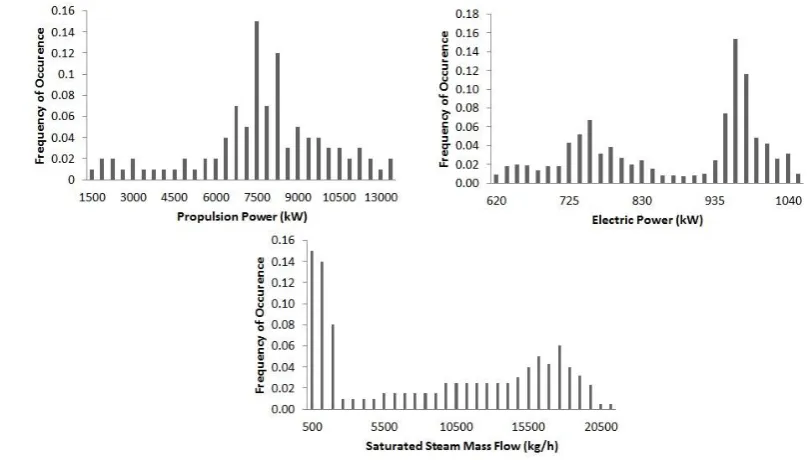
encompasses a hierarchical approach to deal with complexity, by decomposing the whole system into
201
subsystems [69].
202
The systems engineering approach is adopted in this work in order to develop the simulation model and it is
203
presented in Figure 2. The ship energy systems are decomposed into five sub-systems, which include the three
204
main energy sub-systems (main engine sub-system, electric and thermal auxiliary sub-systems), the emission
205
reduction technologies and the energy efficiency technologies sub-systems. Each sub-system performance is
206
modelled separately while considering the sub-systems interactions. The interactions between the sub-systems
207
are displayed through the dashed lines in Figure 2, where the input and output parameters for the sub-systems
208
9
210
Figure 2 Ship energy sub-systems and interactions
211
The specific parameters of the sub-systems performance that have an impact on the calculation of the
212
indicators are modelled in this work. For the propulsion subsystem, the engines performance equations are based
213
on multiple regression performed on data identified in the Project Guides of two-stroke engines manufacturers
214
[70] and are displayed in Tables 1 and 2.
215
Table 1: Diesel engine performance
216
Performance Equation
Specific Fuel consumption (g/kWh)
Nominal speed at MCR (r/min)
Exhaust gas mass flow rate (kg/s)
Exhaust gas temperature
217
The engine performance parameters (sfc, ega, egt, rpm) were modelled as functions of the nominal power Pn
218
(kW) at Maximum Continuous Rating (MCR) and the load L which is derived from the operational profile for
219
the propulsion power demand. The analysis was conducted by employing polynomial regression, using the least
220
square fitting method. The R-squared values for all the performed regressions were estimated to be above 80%,
221
thus indicating sufficient regression accuracy.
222
10
Table 2: Dual fuel Gas Injected (GI) (in gas mode) engine performance224
The calculations for superheated and saturated steam produced from the waste heat recovered from the
225
main engine and the total electric energy produced from the generator, are modelled for a single pressure boiler
226
and a turbo-generator [71]. The equations for the efficiency of the generators and the load correction factors are
227
estimated according to data reported in [71]. The urea consumption of the Selective Catalytic Reactor (SCR) is
228
modelled as a function of the engine power and the amount of NOx emissions reduction according to [72]. The
229
carbon capture system CO2 reduction capability and the required caustic soda consumption are modelled
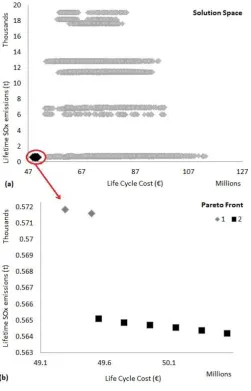
230
according to [73].
231
The modelling of the performance of diesel generators is conducted by using data from the engine
232
manufacturers project guides; in specific, data for four-stroke diesel engines with Tier II compliance were
233
derived from MAN Diesel & Turbo Project Guides [74], whereas data for dual fuel generator sets with Tier III
234
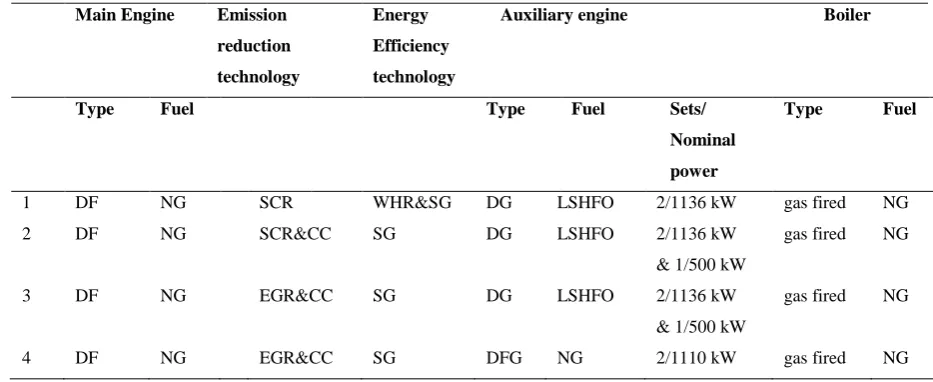
compliance were taken from Wärtsilä Project Guides [75]. The modelling of the fuel consumption of fuel cells
235
was conducted according to [52], whereas the fuel consumption of the thermal boiler is estimated by using the
236
Equation (1), based on the produced saturated steam thermal power.
237
(1)
2.2
Sustainability assessment indicators238
The environmental and economic sustainability of the ship energy systems are both addressed in this work;
239
however, the social dimension of sustainability is not included herein due to the limitations of existing social
240
assessment methods for marine technologies and the subjectivity introduced from the quantification of the social
241
impact [76]. In addition, lack of knowledge on developing relationships between the social criteria and the
242
economic and environmental ones exists [77], which may lead to inconsistent results. Indicators that represent
243
the major categories of the shipping operations impact have been used in order to compare the alternative
244
systems in terms of the environmental and economic sustainability assessment.
245
Performance Equation
Specific Pilot fuel consumption (g/kWh)
Specific Gas consumption (g/kWh)
Nominal speed at MCR (r/min)
Exhaust gas mass flow rate (kg/s)
11
2.2.1 Environmental assessment indicators246
The indicators selected to represent the environmental impact of the ship energy systems are expressed in
247
terms of gaseous emissions during the ship lifetime. The chosen approach has been widely used in the literature
248
in order to express the environmental impact of a vessel power plant [78,79] since gaseous emissions indicators
249
representatively reflect the environmental impact of the ship energy systems [80] and a variety of methods is
250
available to estimate them [81]. Is should be noted that only the gaseous emissions due to the vessel operational
251
phase are addressed in this work. The operational phase is by far the most impactful for the whole ship life cycle
252
in respect to energy consumption [82] and to gaseous emissions, as more than 95% of the life cycle SOx, NOx
253
and CO2 emissions [83] are related to the ship operational phase. A full life cycle environmental assessment
254
analysis is beyond the scope of this work; therefore, the building and decommissioning phases are not
255
considered herein from an environmental impact perspective.
256
In this study, the approach employed to quantify the emissions from the ship energy systems is through the
257
use of Emissions Factors (EF), that have been successfully employed in [81,84–86] in order to estimate the
258
emissions. Emission factors depend on the pollutant, the engine type, the fuel and the engine operational
259
activity. Emission factors are developed from machinery tests or combustion calculations and are either energy
260
based (EFeb) (measured in g/kWh) or fuel consumption based (EFfb) (measured in g pollutant/g fuel) [87].
261
Employing EF for the emissions calculation is an approach that emphasises on the differences among the
262
various engine types and fuels, thus EF are convenient for the comparison of the ship machinery environmental
263
impact. For energy-based pollutants, like NOx emissions, the annual emissions emitted per sub-system are
264
calculated according to Equation (2), whilst for the fuel consumption based pollutants, like SOx and CO2, the
265
emissions are calculated according to Equation (3).
266
(2)
12
2.2.2 Economic assessment indicators267
For the representation of the economic aspect of sustainability, the Life Cycle Cost (LCC) indicator is
268
employed. According to [77], the life cycle costs should be considered when making a financial decision, since
269
apart from the capital cost, operational cost is a considerable cost element. Particularly for the shipping
270
operations, techno-economic studies on the annualised machinery cost of various power plant alternatives
271
demonstrated that the operational costs are more than three times higher than the capital costs [44]. In addition,
272
similar conclusions were derived in [50], where it is stated that the fuel cost for a 20 years investment period, is
273
responsible for 91% of the total lifetime expenditure. Thus, the Life Cycle Cost is a useful tool to assess the
274
economic impact of the ship energy systems, as it is suitable for detailed financial analysis [3] and it is helpful
275
when making sustainable investment decisions [77].
276
LCC includes the capital and the operational cost (consisting of maintenance, fuel, spare parts cost and
277
consumables for the various subsystems and technologies) over the ship economic life. The yearly operational
278
costs are calculated, then brought to present value with an appropriate discounting function and added to the
279
capital cost in order to calculate the life cycle cost indicator according to Equation (4).
280
(4)
281
It is evident from Equations (2)-(4) that specific parameters of the performance of the systems are necessary
282
for the indicators calculation.
283
2.3
Multi-objective optimisation of ship energy systems synthesis284
The optimisation of the ship energy systems is described in this section; the optimisation uses the simulation
285
model of the systems (Section 2.1) to estimate the environmental and economic sustainability indicator values
286
presented in Section 2.2. These indicators form the objective functions presented herein.
287
The objectives of this multi-objective optimisation problem, as derived from the aim of this study, are to
288
minimise simultaneously the life cycle cost of the ship energy systems represented by Equation (5) and the
289
various gaseous emissions represented by Equation (6) throughout the vessel lifetime for an expected
290
13
(5)
(6)
Where p expresses the various pollutants, p= {CO2, NOx, SOx}, thus having in total four separate objective
292
functions. Other pollutants that affect the environmental footprint of the ship energy systems can be included in
293
the objective function, such as Particulate Matter, methane or Volatile Organic Compounds, by introducing
294
additional indicators.
295
The optimisation decision variables are as follows:
296
The main engine type (tme), the nominal power (Pn,me) and the fuel type (fme) for the propulsion subsystem
297
(ps). The nominal power is considered an integer variable for the purposes of this work and the values of
298
the decision variable increase with a 200 kW step.
299
The auxiliary engine type (tae), the number of auxiliary sets (Nae) and the fuel type (fae)for the auxiliary
300
electric subsystem (es).
301
The boiler type (tth), the number of the boilers (Nth) and the fuel type (fth) for the thermal subsystem (ts).
302
The existence (bz) of a particular energy efficiency technology for the energy efficiency technologies
303
subsystem (ee), where bz={1 if the technology tz is selected or 0 if it is not}. z=1…Oee is a set of alternative
304
technologies for energy efficiency.
305
The existence (bp,y) of a particular emission reduction technology, for the energy reduction technologies
306
subsystem (er) for each pollutant p, where bp,y ={1 if the technology ty is selected or 0 if it is not} and
307
y=1…Oer,p is a set of alternative technologies for emission reduction for each pollutant p.
308
In the environmental objectives of the optimisation problem represented by Equation (6), the first three
309
right-hand side terms are calculated according to Equations (2) and (3) depending on the pollutant, whereas the
310
last term represents the reduction of the emissions due to the emission reduction technologies.
311
14
(7)
Where Cc (€/kW) is the cost factor for the capital cost calculation that depends on the type of technology
313
and is derived from literature and manufacturer data.
314
In Equation (5), OPEX denotes the operational expenditure of the energy systems that consist of the fuel
315
costs (OPEX1) which are calculated according to Equation (8).
316
(8)
Cf (€/t) is the fuel cost factor that depends on the fuel type and is derived from online bunker prices data; cf
317
is the correction factor of the fuel from ISO to actual conditions; df is the deterioration factor of the engine
318
performance due to the fouling and wearing of its components, causing an increase of the fuel consumption, and
319
it is modelled according to [88] as a varying parameter throughout the engine lifetime.
320
The maintenance costs and consumables from emission reduction technologies like urea for SCR are
321
calculated according to Equation (9).
322
15
Cm (€/kWh) is the maintenance cost factor that depends on the technology type and is derived from323
literature and manufacturer data, whereas Ccon (€) is the cost of consumable chemicals required for the operation
324
of the emission reduction technologies.
325
The multi-objective optimisation is subject to the following regulatory, power demand related, technical
326
and design constraints.
327
The considered regulatory constraints are as follows.
328
Pn,me ≥ Pmpr, the nominal power of the main engine has to fulfil the minimum power requirements according
329
to the regulations [67].
330
The fuel sulphur content has to comply with the existing limitations; S% ≤ 3.5% for outside ECA waters
331
and ≤ 0.5% inside ECA waters [65] or otherwise a scrubber has to be employed.
332
The NOx Emission Factors for main and auxiliary engines have to comply with the existing limitations;
333
EFNOx to fulfil Tier II limits outside ECA waters and Tier III inside ECA waters [66].
334
The nominal power of the thermal and electric auxiliaries selected has to satisfy the maximum power
335
demand.
336
The considered demand-related constraints are as follows.
337
The operational profile is divided in I operational phases and the power demand for each operational phase i
338
has to be satisfied for each type of energy vector.
339
(10)
340
(11)
341
where i=1…I denoting the operational phases. (12)
342
The considered technical constraints are as follows.
343
The incompatibility of technologies is considered and modelled through constraints so that non-compatible
344
technologies are not selected within a single system configuration.
345
The considered design constraints are as follows.
346
The selection of the main engine, and multiple auxiliary and thermal boilers, in order to cover the adequate
347
16
, , (13)
349
The problem presented is a Multi-Objective Combinatorial Optimisation (MOCO) problem since the
350
decision variables are discrete and the objective functions, as well as the constraints, can take any form [89]. A
351
MOCO problem can be transformed into a single-objective by using a scalar function by employing the
352
weighted sum method to aggregate the objectives into a single objective, which is one of the most commonly
353
used methods in supporting decisions for enhancing sustainability [90]. However, it requires ‘a priori
354
knowledge’ of the decision makers preferences [89] and using weights leads into leaving regions of solutions
355
unmapped [91]. On the other hand, using separate objectives allows the trade-offs among the objectives to be
356
demonstrated, and subsequently, it is possible for the user to make more informed decisions [92]. Thus, the
357
latter approach is adopted in this work. Evolutionary algorithms are the state-of-the-art techniques in solving
358
multi-objective optimisation problems [93] and are commonly used to solve MOCO problems. One of the most
359
frequently used methods is the Non-dominated Sorting Genetic Algorithm II (NSGA-II) [89] that was developed
360
by Deb et al. [94]. In this work, the NSGA-II optimisation method was employed in order to determine the
361
Pareto front of the investigated problem. The NSGA-II is suitable for MOCO problems and it works efficiently
362
on problems such as the one described herein, where the objective function and constraints are derived from a
363
black box simulation. It offers a uniform distribution of the solutions on the Pareto front due to the crowding
364
distance metric and favours solutions that are quite diverse, due to the elitist mechanism it employs. It is a
365
method widely used for energy systems design [95–98], ship energy systems design [48,55,99–101] as well as
366
optimisation of energy systems with sustainability considerations [102,103].
367
The genetic algorithm parameters were calibrated after experimentation and repeated runs. The mutation
368
operator follows a Gaussian distribution, the crossover is set as arithmetic, the population selection is set as
369
tournament, whereas the population size was set to 500 to offer a rich set of solutions that approximate the
370
Pareto front.
371
Since the multi-objective optimisation offers a spectrum of optimum solutions in comparison with the
372
single objective optimisation, it makes it challenging to identify an optimum solution and therefore, the Pareto
373
optimal front is introduced. A solution from a multi-objective optimisation belongs to the Pareto front and is
374
considered Pareto-optimal and non-dominated when there is no other solution in the solution space that
375
performs equal in all objectives and better in at least one of them. The Pareto-optimal solutions cannot be
376
17
representation of the set of non-dominated optimal solutions, thus allowing the decision maker to explore the378
optimum alternatives and the trade-offs among them. In this work, the results from the multi-objective
379
optimisation are visualised through a Pareto front.
380
3. Case Study
381
A case study was performed in order to exemplify the method presented in this work. The environmental
382
and economic performance of alternative energy system configurations of an Aframax crude oil tanker having a
383
deadweight of 115000 tons was investigated. It was assumed that the ship sails 10% of the time at ECA waters.
384
The lifetime of the vessel was assumed to be 25 years, whereas the ship does not operate due to maintenance for
385
7% of her lifetime.
386
The data for the operational profile (speed distribution, frequency of occurrence) in ballast and laden
387
conditions for an Aframax tanker were taken from [61]. By using the speed distribution and the ship
388
characteristics the propulsion power was calculated according to empirical formulas provided in [104], whilst
389
the electric power and thermal operational profile figures were estimated according to operational measured
390
data. The considered operating profiles are shown in Fig. 3.
391
[image:17.595.98.502.437.667.2]392
Figure 3 Typical Operational Profiles for Aframax tankers
393
18
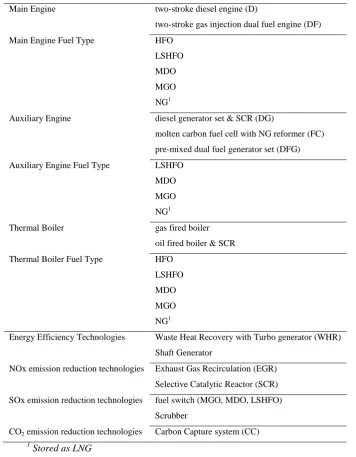
Table 3: List of alternative energy system components for the case study396
Main Engine two-stroke diesel engine (D)
two-stroke gas injection dual fuel engine (DF)
Main Engine Fuel Type HFO
LSHFO
MDO
MGO
NG1
Auxiliary Engine diesel generator set & SCR (DG)
molten carbon fuel cell with NG reformer (FC)
pre-mixed dual fuel generator set (DFG)
Auxiliary Engine Fuel Type LSHFO
MDO
MGO
NG1
Thermal Boiler gas fired boiler
oil fired boiler & SCR
Thermal Boiler Fuel Type HFO
LSHFO
MDO
MGO
NG1
Energy Efficiency Technologies Waste Heat Recovery with Turbo generator (WHR)
Shaft Generator
NOx emission reduction technologies Exhaust Gas Recirculation (EGR)
Selective Catalytic Reactor (SCR)
SOx emission reduction technologies fuel switch (MGO, MDO, LSHFO)
Scrubber
CO2 emission reduction technologies Carbon Capture system (CC) 1 Stored as LNG
397
For the investigated vessel, the subsystem options presented in Table 3 were considered as alternatives for
398
the configurations considered in the proposed method application. Not all the potential combinations among the
399
subsystems in Table 3 are possible; the compatibility of the various subsystems combinations is ensured through
400
the technical constraints.
401
The following assumptions were employed for the presented case study. For the efficiency of the fuel cells,
402
the reformer, DC-AC inverter and frequency converter efficiencies were considered, leading to a 42%
403
alternating current electric efficiency, which is assumed to be constant with the load. The weight and volume of
404
the technologies were not included in the scope of this work, and no economic profit was assumed from
405
19
technologies was modelled according to [105], whereas it was assumed that the scrubber reduces the sulphur407
content so that the ship complies with the ECA and global water regulations for SOx emissions. The Carbon
408
Capture system is assumed to capture 10% of the CO2 emissions from the main engine.
409
The average values from online bunker prices for the first six months of the year 2017 were considered as
410
provided in Table 4. The urea price is assumed 350 €/t and caustic soda price is 300 €/t according to current
411
market prices.
412
Table 4: Fuel Cost Factors (Cf)
413
Price (€/t)
HFO (IFO 380) 260
LSHFO (LS380) 300
MDO 430
MGO 500
NG 235
The equipment capital cost and maintenance cost were adapted from the literature or technical reports and
414
are displayed in Table 5. The prices were converted to 2017 values using the Producer Prices Index in the
415
[image:19.595.66.529.449.699.2]industry (total EU-28) according to [106].
416
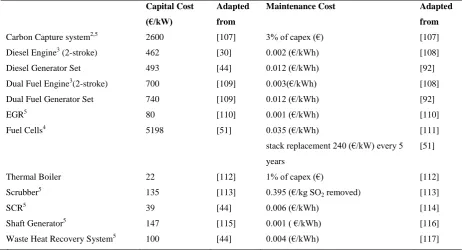
Table 5: Economic Input (components capital Cc and maintenance cost Cm factors)
417
Capital Cost (€/kW)
Adapted
from
Maintenance Cost Adapted
from
Carbon Capture system2,5 2600 [107] 3% of capex (€) [107]
Diesel Engine3 (2-stroke) 462 [30] 0.002 (€/kWh) [108]
Diesel Generator Set 493 [44] 0.012 (€/kWh) [92]
Dual Fuel Engine3(2-stroke) 700 [109] 0.003(€/kWh) [108]
Dual Fuel Generator Set 740 [109] 0.012 (€/kWh) [92]
EGR5 80 [110] 0.001 (€/kWh) [110]
Fuel Cells4 5198 [51] 0.035 (€/kWh) [111]
stack replacement 240 (€/kW) every 5
years
[51]
Thermal Boiler 22 [112] 1% of capex (€) [112]
Scrubber5 135 [113] 0.395 (€/kg SO2 removed) [113]
SCR5 39 [44] 0.006 (€/kWh) [114]
Shaft Generator5 147 [115] 0.001 ( €/kWh) [116]
Waste Heat Recovery System5 100 [44] 0.004 (€/kWh) [117]
2 Tank storage of carbon included.
418
3 The storage and treatment of the fuel are considered.
419
4 Technology with an internal reformer.
420
20
The data used for the calculation of the environmental indicators are presented in Tables 6 and 7 and have422
been adapted from [84,85,87].
423
Table 6: Environmental Input
424
CO2
(g/g of fuel)
Sulphur content (%) Lower Heating Value (kJ/kg)
HFO 3.021 2.7 39000
LSHFO 3.075 0.1 42500
MDO 3.082 0.1 42700
MGO 3.082 0.1 42800
NG 2.75 0 48600
NG & MDO pilot fuel6 2.77 0.1 48600
6
EFCO2=0.94EFCO2, NG+ 0.06EFCO2, MDO.
425
Table 7: Environmental Input (NOx EF)
426
NOx Emission Factor Adapted from
Diesel Engine According to Tier II & Tier III regulations [66]
Dual Fuel Engine (in gas mode) 8.7 (g/kWh) [118]
Molten Carbon Fuel Cell 0.08 (g/kg fuel) [52]
Oil Fired Boiler 5.6 (g/L fuel) [119]
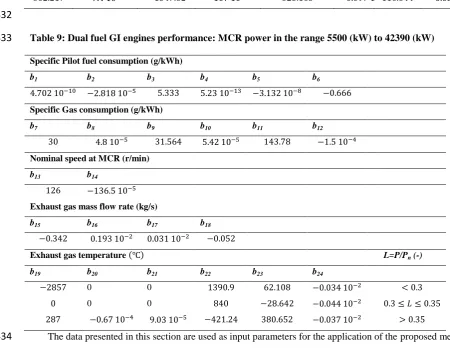
The parameters for the specific case study for the performance of the two-stroke diesel and dual fuel
427
engines with nominal power varying between 5500-42390 kW are given in Tables 8 and 9, respectively.
428
Representative figures with the raw data points used for the regression are presented in Appendix A for one
429
nominal power7. The power range considered for the auxiliary generator sets is 500-1470kW.
430
Table 8: Diesel engines performance: MCR power in the range 5500 (kW) to 42390 (kW)
431
Specific Fuel consumption (g/kWh)
a1 a2 a3 a4 L=P/Pn (-)
140 0
Nominal speed at MCR (r/min)
a5 a6
Exhaust gas mass flow rate (kg/s)
a7 a8 a9 a10
7
21
Exhaust gas temperature
a11 a12 a13 a14 a15 a16 a17 a18
[image:21.595.42.493.113.463.2]
432
Table 9: Dual fuel GI engines performance: MCR power in the range 5500 (kW) to 42390 (kW)
433
Specific Pilot fuel consumption (g/kWh)
b1 b2 b3 b4 b5 b6
Specific Gas consumption (g/kWh)
b7 b8 b9 b10 b11 b12
Nominal speed at MCR (r/min)
b13 b14
Exhaust gas mass flow rate (kg/s)
b15 b16 b17 b18
Exhaust gas temperature L=P/Pn (-)
b19 b20 b21 b22 b23 b24
0 0
0 0
The data presented in this section are used as input parameters for the application of the proposed method.
434
4. Results and Discussion
435
Representative results from the optimisation process for the investigated Aframax tanker are presented in
436
this section to demonstrate the application of the method. The Pareto front curves are displayed both for a
bi-437
objective optimisation scenario, where only two objectives were considered in the optimisation and a
multi-438
objective optimisation scenario, where all four objectives were included in the optimisation process. Each point
439
of the curve represents an optimum ship energy system configuration according to the considered objectives. All
440
the presented solutions comply with the IMO Annex VI regulations for NOx and SOx emissions [65,66], as well
441
as the EEDI regulations for energy efficiency. Finally, a preliminary sensitivity analysis was performed in order
442
to investigate the influence of the input parameter values on the derived optimal solutions.
443
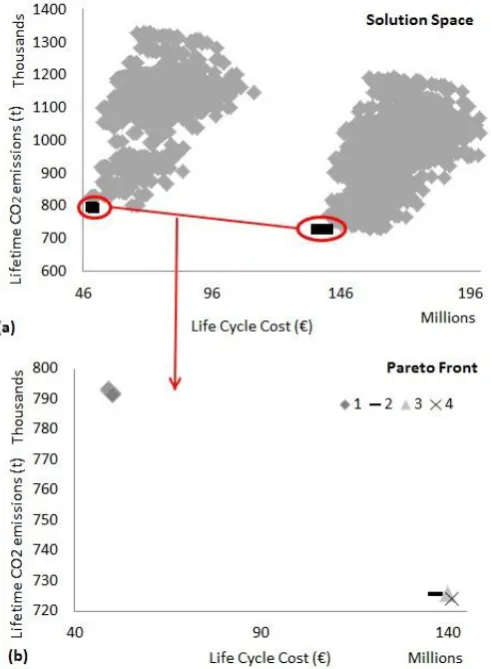
22
The results from the bi-objective optimisation on the lifetime CO2 emissions and the Life Cycle Costs are445
presented in Figure 4. Figure 4a shows the complete solution space with light grey colour, whereas the Pareto
446
front that includes the optimum non-dominated solutions is presented with black colour. In Figure 4b, only the
447
Pareto front results are displayed with more detail. From Figure 4a, it is evident that a variety of solutions exist
448
in the solution space and the optimisation method was able to identify the optimum solutions in the Pareto front
449
(black marks). It is inferred that among the solutions on the solutions space there are many alternatives that are
450
not efficient in terms of environmental and economic objectives.
451
[image:22.595.184.430.247.582.2]452
Figure 4 CO2-LCC bi-objective optimisation: a) Solution Space b) Pareto Front
453
The Pareto Front shown in Figure 4b displays a variety of solutions for the investigated ship energy systems
454
configurations. The set of optimal solutions is presented in Table 10. It is evident from the results of the
bi-455
objective optimisation that the dual fuel engine running with natural gas and a range of nominal power varying
456
between 17300 and 18800 kW, as well as the gas fired boiler, are dominant components. Solutions for the
457
auxiliary electric sub-system include either diesel generators running with LSHFO (solutions 1, 2 and 3), which
458
23
4), with a higher capital cost and reduced carbon footprint. It is observed that in solutions 2 and 3, three460
generators are selected; two with the maximum nominal power that is required by the regulations and one with a
461
smaller nominal power to operate more efficiently at the lower loads range. In addition, in some cases the
462
Carbon Capture technology is selected (2, 3 and 4), thus reducing the CO2 emissions drastically, however
463
significantly increasing the LCC due to the high capital, as well as the operational cost of this technology. By
464
installing a Carbon Capture system there is a cost increase of 1.29 € per kg of CO2 emissions saved. The carbon
465
emissions reduction in solution 2 is 10% lower in comparison with the ones of solution 1 over the ship lifetime;
466
however, the life cycle cost is almost tripled due to the emissions reduction technology. The installation of the
467
Carbon Capture system has an additional economic drawback, which is the occupation of approximately 0.15%
468
of the payload of the vessel per day of sailing, resulting in lower revenues from operations. This additional
469
economic impact has not been accounted in this research. Ultimately, comparing the last six months average
470
price of 5.93 € per ton of CO2 of the EU ETS with the cost of 1290 € per ton of CO2 that is offered with the
471
Carbon Capture renders the technology prohibitive in the real-life context for the particular application, despite
472
[image:23.595.61.528.430.621.2]the significant carbon emissions reduction.
473
Table 10: Configurations of Figure 4
474
In Figure 5, the results from the bi-objective optimisation of the investigated ship energy systems with
475
objectives the lifetime SOx emissions and the Life cycle cost are displayed. In Figure 5a, the variety of solutions
476
of the complete solution space is presented with a wide range of the values of the objectives. The solutions on
477
the complete solutions space include also non-efficient technologies. Due to the wide scaling of this plot vertical
478
axis it appears that there is a variety of solutions with similar SOx lifetime emissions to the Pareto optimal
479
solutions at the bottom of the vertical axis; however, a closer look at these solutions reveals that the SOx
480
emissions actually vary considerably between the optimal solutions identified (highlighted in black) and the
481
Main Engine Emission
reduction
technology
Energy
Efficiency
technology
Auxiliary engine Boiler
Type Fuel Type Fuel Sets/
Nominal
power
Type Fuel
1 DF NG SCR WHR&SG DG LSHFO 2/1136 kW gas fired NG
2 DF NG SCR&CC SG DG LSHFO 2/1136 kW gas fired NG
& 1/500 kW
3 DF NG EGR&CC SG DG LSHFO 2/1136 kW gas fired NG
& 1/500 kW
24
non-optimal solutions (in grey). The non-dominated solutions of the Pareto front that perform better in both482
objectives are highlighted and displayed in Figure 5b.
483
In Figure 5b, two sets of alternative ship energy system configurations for the investigated Aframax are
484
identified in the Pareto front. The configurations of Figure 5b are detailed in Table 11. In both solutions, the
485
dual fuel engine is preferred as the main engine as well as the gas fired boiler as the system thermal energy
486
producer. The nominal power of the main engine is in the range of 17300-18800 kW. The main difference
487
between the two solutions lies in the auxiliary electric engine; in solution 1, two diesel generator sets running
488
with LSHFO are selected, whereas in solution 2 dual fuel generator sets were selected. It is evident from the
489
performance of the solutions that the natural gas on the generators offers a reduction in the SOx emissions,
490
however at the same time due to the higher cost of the dual fuel generator sets, an increase in the Life Cycle
491
Cost is observed. From the installation of the dual fuel generator sets (solution 2) instead of the typical diesel
492
generator sets (solution 1), a cost increase of around 37 € per kg of SOx emissions saved is identified. It is
493
inferred from these results that a configuration with all the main energy systems running with natural gas, offers
494
the minimum SOx emissions and therefore, it is recognised as a possible configuration to comply with the future
495
25
497
Figure 5 SOx-LCC bi-objective optimisation: a) Solution Space b) Pareto Front
498
Table 11: Configurations of Figure 5
499
In Figure 6, the optimisation of the investigated ship energy systems with respect to the lifetime NOx and
500
LCC objectives is presented. The solution space of the bi-objective optimisation is displayed in Figure 6a where
501
the non-dominated solutions are presented in black.
502
Main Engine Emission
reduction
technology
Energy
Efficiency
technology
Auxiliary engine Boiler
Type Fuel Type Fuel Sets/
Nominal
power
Type Fuel
1 DF NG EGR WHR&SG DG LSHFO 2/1136 kW gas fired NG
[image:25.595.42.529.535.673.2]26
503
Figure 6 NOx-LCC bi-objective optimisation: a) Solution Space b) Pareto Front
504
Table 12: Configurations of Figure 6
505
In Figure 6b, the Pareto front is presented with more detail from which five different sets of solutions are
506
identified and displayed in Table 12. Similarly to the two previous cases, the dual fuel engine (with its nominal
507
power varying from 17050 to 18800 kW) and the gas fired boiler are preferred; furthermore, the WHR as well
508
as the shaft generator, are selected for improving the plant energy efficiency. There are variations of the
509
solutions on the emission reduction technology so that the ship complies with the NOx regulations inside ECA
510
Main
Engine
Emission
reduction
technology
Energy
Efficiency
technology
Auxiliary engine Boiler
Type Fuel Type Fuel Sets/
Nominal
Power
Type Fuel
1 DF NG SCR WHR&SG DG LSHFO 2/1136 kW gas fired NG
2 DF NG EGR WHR&SG DFG NG 2/1110 kW gas fired NG
3 DF NG EGR&SCR WHR&SG DG LSHFO 2/1136 kW gas fired NG
4 DF NG EGR&SCR WHR&SG DFG NG 2/1110 kW gas fired NG
[image:26.595.39.533.478.710.2]27
waters. When both SCR and EGR technologies are selected (Solutions 3, 4 and 5), there is a 600 tonnes511
decrease in the lifetime NOx emissions, however, followed with an 18 M€ increase in the life cycle cost, due to
512
the operational and capital cost of the technologies. In addition, the solution with the lower lifetime NOx
513
emissions appears when the fuel cell technology (Solution 5) is selected for covering the ship electric power
514
demand; on the other hand, the economic objective is increased due to the high investment cost of the fuel cells
515
technology. Comparing the two extreme solutions 1 and 5, a cost increase of 22 € per kg of NOx emissions
516
saved is observed, by installing both emission reduction technologies as well as the fuel cells instead of the
517
traditional diesel generators. Installing both emission reduction technologies is not a current practice; however,
518
from the results, it is inferred that it is a possible alternative that could be employed in the future when the
519
regulations for NOx emissions are going to be more stringent.
520
4.2
Multi-objective optimisation results521
The derived results from the multi-objective optimisation, with the four objective functions of the lifetime
522
SOx, NOx, CO2 emissions and the Life Cycle Cost are presented in Figure 7.
523
[image:27.595.159.453.408.595.2]524
Figure 7 Multi-Objective Optimisation (SOx, NOx, CO2, LCC)
525
The results are displayed in four different views, in order to obtain a better understanding. Figure 7 provides
526
the complete view of the four-dimensional space including all dimensions of the analysis, whereas Figure 8 (a, b
527
and c) are extracted from Figure 7 and provide a three-dimensional view of the original figure. The solutions are
528
clustered into 13 categories; each one includes solutions having a similar configuration. The details for the
529
28
objective optimisation are displayed in detail along with the values of the objective functions, expressed as the531
difference from the best case. It is evident from Figures 7, that there is a variety of alternative configurations and
532
it is not possible to identify a single optimum solution. However, a variety of environmental and cost-efficient
533
solutions are generated supporting the decision process and giving the opportunity to the decision maker to
534
understand the trade-offs among the objectives.
535
536
Figure 8 Multi-objective optimisation: a) SOx-CO2-LCC view, b)NOx-SOx-LCC view, c)NOx-CO2-LCC
537
view
538
It is evident from the results of Figure 7 and 8 that there are trade-offs observed, similarly to the majority of
539
real-life problems. The solutions 1-7 and 9 appear to have LCC below 84 M€ with the solution 1 having the
540
lowest LCC, whereas the LCC of the alternatives 8 and 10-13 is estimated to be in the region 144-180 M€. For
541
the lifetime SOx emissions objective all the solutions, except for the solutions 1, 2 and 9 are expected to emit
542
SOx emissions below 2 thousand tonnes throughout the ship lifetime. Regarding the lifetime CO2 emissions, the
543
solutions 12 and 13 exhibit the lowest carbon footprint with the estimated CO2 emissions being in the region of
544
700-800 thousand tonnes. Finally, all the solutions except for the solution 1 are estimated to have lifetime NOx
545
[image:28.595.78.542.199.485.2]29
Table 13: Configurations of Figure 8547
548
549
550
Main Engine Emission reduction
technology
Energy
Efficiency
technology
Auxiliary engines Thermal Boiler Percentage Difference from the best solution
Type Fuel Type Fuel Type Fuel LCC CO2
emissions
SOx emissions NOx
emissions
1 D HFO LSHFO switch &SCR SG DG LSHFO gas fired NG 0 +50% +22% +46%
2 DF NG EGR&SCR none FC NG oil fired HFO & Fuel
switch
+20% +47% +11% +0.01%
3 DF NG EGR WHR FC NG oil fired HFO & Fuel
Switch
+21% +40% +6% +0.9%
4 DF NG EGR none FC NG oil fired LSHFO +39% +34% +5% +0.9%
5 DF NG EGR&SCR none FC NG oil fired LSHFO +42% +34% +5% +0.002%
6 DF NG EGR WHR DFG NG oil fired LSHFO +20% +25% +5% +2.5%
7 DF NG SCR WHR FC NG gas fired NG +12% +29% 0 +1%
8 DF NG EGR&CC WHR FC NG oil fired LSHFO +192% +27% +5% +0.9%
9 DF NG EGR or SCR or both SG&WHR DG LSHFO oil fired LSHFO +15-30% +20% +7-10% +1.5-2.5%
10 DF NG CC& EGR or SCR or
both
WHR FC NG oil fired LSHFO +205-225% +19% +4.5% +0-1%
11 DF NG CC& EGR& SCR none DFG NG oil fired LSHFO +190% +15% +5% +2%
12 DF NG EGR SG&WHR FC NG oil fired LSHFO +190-210% +5% +6% +1.7-2.5%