TOWARDS A DATA ANALYTICS FRAMEWORK FOR MEDIUM
VOLTAGE POWER CABLE LIFETIME MANAGEMENT
Jose I. Aizpurua, Brian G. Stewart and Stephen D. J. McArthur
Institute for Energy and Environment, Department of Electronic & Electrical Engineering University of Strathclyde
99 George Street, G1 1RD, Glasgow, Scotland, UK
[email protected]; [email protected]; [email protected]
Nitin Jajware Bruce Power Kincardine, Canada [email protected]
Martin Kearns EDF Energy
East Kilbridge, G76 9HW, Glasgow, Scotland, UK [email protected]
Sarajit Banerjee Kinectrics Inc. Toronto, Canada
ABSTRACT
Power cables are critical assets for the reliable and cost-effective operation of nuclear power plants. The unexpected failure of a power cable can lead to lack of export capability or even to catastrophic failures depending on the plant response to the cable failure and associated circuit. Prognostics and health management (PHM) strategies examine the health of the cable periodically to identify early indicators of anomalies, diagnose faults, and predict the remaining useful life. Traditionally, PHM-related strategies for power cables are considered separately with the associated penalties involved with this decision. Namely, there is a lack of consideration of the interactions and correlations between failure modes and PHM tests, which results in scalability issues of ad-hoc experiments, and accordingly incapability to exploit the full potential for PHM strategies in an effective manner. An effective and flexible PHM strategy should be able to consider not only different PHM strategies independently, but also it should be able to fuse these tests into a cable health state indicator. The main contribution of this paper is the proposal of a PHM-oriented data analytics framework for medium voltage power cable lifetime management which incorporates anomaly detection, diagnostics, prognostics, and health index modules. This framework includes the characterization of existing data sources and PHM-oriented data analytics for cable condition monitoring. This process enables the creation of a database of existing datasets, identification of complementary PHM techniques for an improved condition monitoring, and implementation of an end-to-end PHM framework.
1
INTRODUCTION
The main goal of nuclear power plants (NPP) is the safe and reliable generation of electricity. The availability of electricity is a crucial requirement to operate a NPP in a safe and reliable mode. Most of the electrical assets operating in a NPP are interconnected through power cables (e.g., transformers, generators, motors, unit boards, interconnectors, boiler feed pumps, gas circulators, gas turbines), and therefore the correct and reliable operation of nuclear power plants is influenced by the performance of the cables.
The adoption of prognostics and health management (PHM) strategies is rapidly increasing within the power industry due to the increase of monitored data for different assets such as transformers [1], circuit breakers [2] and cables [3]. PHM strategies focus on monitoring the key degradation parameters of the asset under study so as to implement anomaly detection, diagnostics and prognostics analytics for condition monitoring and maintenance-related decision-making [4].
Monitoring tests and maintenance strategies are different for different cables. For example, more critical cables will be subject to more frequent and exhaustive testing than non-critical cables. The main focus of this paper is on medium voltage (MV) power cables. In order to track the health state of a cable it is critical to identify trending parameters which are consistent over time, ideally until cable failure occurrence. The performance of the cables is influenced by different stressors and ageing mechanisms that will be dependent on the operation context. Generally, the main power cable ageing causes can be classified into the following groups [5]:
Thermal ageing: caused by ambient temperature or Joule heating. It may result in oxidation, decomposition and/or evaporation.
Electrical ageing: caused by voids, protrusions, or defects. It may result in partial discharges.
Mechanical ageing: caused by bending, tension, compression, torsion or vibration. It may result in water or electrical trees.
Environmental ageing: caused by moisture, gases (e.g. oxygen), chemicals or radiation. It may result in space charge.
These degradation mechanisms can affect the cable lifetime independently or simultaneously. However, there is not always a direct correlation between these parameters and the failure occurrence time and this complicates the implementation of effective PHM strategies.
For industrial implementation purposes, the design of PHM analytics requires moving from ad-hoc algorithms towards the development of a flexible end-to-end data analytics framework which takes into account end-user requirements. In this context, the main goal of this paper is the specification of appropriate PHM analytics for lifecycle power cable health monitoring, which will assist engineers in the asset management process within an NPP. The paper demonstrates the application of some of the PHM analytics for cable health state diagnostics predictions.
The paper is organized as follows. Section 2 describes the proposed data analytics framework. Section 3 develops further some of these analytics. Finally, Section 4 draws conclusions and identifies future goals.
2
A DATA ANALYTICS FRAMEWORK FOR CABLE HEALTH MONITORING
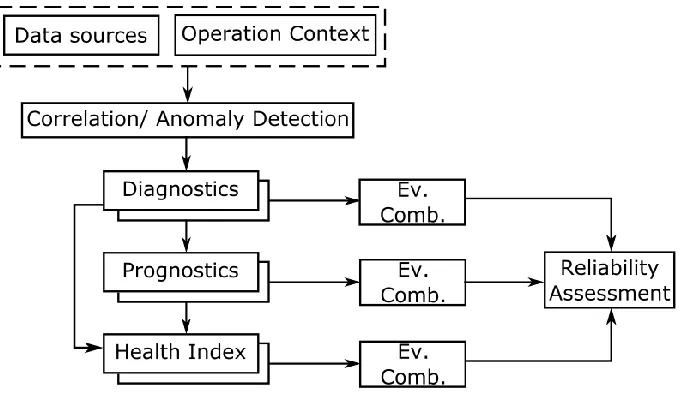
Cable lifetime management and PHM analytics are comprised of a number of connected activities such as failure cause-effect analysis, criticality analysis, condition monitoring, anomaly detection, diagnostics, prognostics and optimization maintenance strategies. Figure 1 shows the high-level conceptual diagram of the main PHM modules included in the cable lifetime management data analytics framework.
The starting point of the data analytics framework will be determined by the available data sources
each company for the asset under study, for example the polarization insulation resistance (PIR) and partial discharge (PD) tests are widely adopted tests to monitor the insulation health of the cable (see also Section 2.3). Based on the collected data, correlation trends can be evaluated between tests and the operational context so as to determine patterns that represent normality and detect anomalies, e.g. [6].
Figure 1. Prognostics and health management analytic modules.
Subsequently, depending on the collected data and available cable physics-of-failure specifications,
diagnostics, prognostics and health index modules can be implemented. For example, the cable conductor temperature and associated lifetime can be determined from the physics of operation of the cable [5], whereas other tests may be used to evaluate the health of the insulation of the cable such as partial discharge. If there are different models that perform diagnosis or prognostics of the cable, it is possible to combine them to obtain a single diagnostics or prognostics indicator. Similarly, if there are multiple health indexes corresponding to different subsystems, they can be combined to generate a single cable health index. The
evidence combination activity enables the end-user to adopt a more intuitive decision based on a single indicator. If more detailed information about the cable health is needed, it is possible to evaluate lower level indicators and further examine the cause.
Finally, all the previously generated monitoring information can be integrated into a reliability assessment module which estimates the failure probability of the cables including all the monitoring data and predictive models [7].
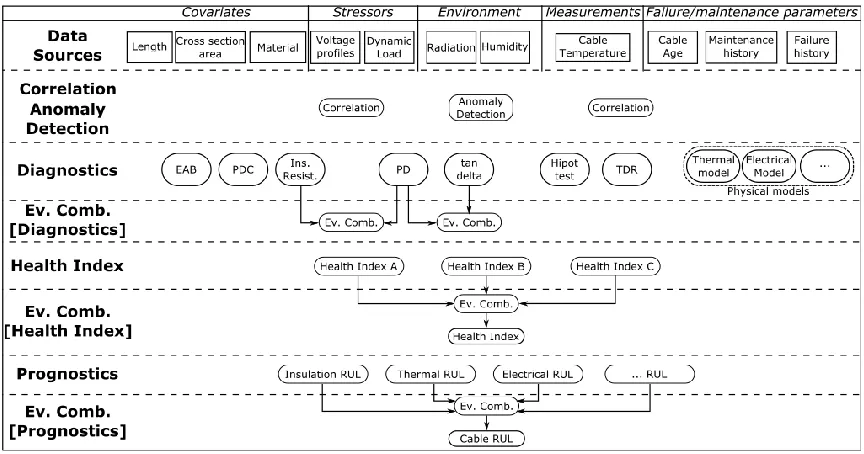
Figure 2. High-level data analytics suite.
2.1
Data Sources
Cable data sources and their operation context can be divided into the following groups:
Covariates: cable parameters indirectly related to its health such as length, cross section area, material, or manufacturer.
Stressors: external variables that affect the cable lifetime such as voltage and loading profiles.
Environment: operation context specific parameters that affect the operation and degradation of the cable such as radiation or humidity.
Measurements: cable-specific measurements such as temperature.
Failure-related parameters: cable age, survival time, failure history, maintenance history.
2.2
Correlation and Anomaly Detection
Once the available data sources are identified, the correlation between these variables needs to be analyzed in order to define normal or acceptable cable operational patterns. The correlation tests can also be extended to diagnostics modules (see Subsection 2.3) to further complement cable health information.
This activity will be dependent on the available data sources and their sampling rates. In order to obtain meaningful correlation results for the variables that will be correlated, it is crucial that their sampling rates are in agreement and the sampling dates match.
2.3
Diagnostics
According to the performed diagnostics test, it is possible to analyze cable health from different degradation perspectives. Additionally, thermal, electrical and electro-thermal experimental degradation models can be implemented to study the current health state of the cable according to physics-based models. A number of condition monitoring tests are available to evaluate the cable health [9]:
Tan delta is based on the concept that a cable free of defects is similar to a capacitor with the conductor and the neutral being the two plates separated by the insulation material. When there are impurities, the cable is no longer a capacitor and the shift angle between the current and voltage indicates cable quality. This test indicates the integral degradation of cable insulation.
In the hipot test (or dielectric withstanding test) high voltage is applied between the cable conductor and the shielding. The resulting current that flows through the insulation is measured, known as leakage current. If the application of a test over-voltage does not cause insulation breakdown the cable is assumed to be safe to use under normal operating conditions.
Insulation resistance (IR) test applies a known voltage to the cable, then measures the leakage current and finally calculates the resistance. The better the insulation of the cable, the smaller the leakage current and greater the insulation resistance value.
Partial discharge (PD) is an electrical discharge that occurs across a localised area of the insulation between two conducting electrodes without completely bridging the gap. It can be caused by imperfections in the insulation. PD testing gives an indication of deterioration of the insulation and incipient faults.
Elongation at break (EOB) is a measure of material’s resistance to fracture under applied tensile stress. It is defined as the percent increase in elongation at the time of the fracture. It is a destructive test and requires a large amount of cable samples.
Time domain reflection (TDR) is a remote sensing method in which the reflection characteristics of a known signal within a cable are used to determine the location of the defects. To improve the accuracy and resolution of signals joint time-frequency domain reflectometry is frequently used.
A number of empirical models have been defined to model the effect of electrical and thermal stresses on cable lifetime. For example, the Arrhenius-IPM model relates the cable lifetime with thermal and electrical stresses as follows [8]:
𝐿𝑡 = 𝐿𝑡0𝑒−𝐵𝑐𝑇 𝐸𝐸 0
−(𝜂0−𝑏𝑐𝑇)
(1)
where Ltis the lifetime at instant t, Lt0is the lifetime at instant t0, B=Δw/k, where Δw is the activation energy of the main thermal degradation reaction and k is the Boltzmann constant, b is a parameter that models the synergism between electrical and thermal stresses, Ct= 1/T0-1/T, where T is temperature in Kelvin degrees and T0 is a reference temperature, η0 models is the voltage endurance coefficient at T=T0, and b is a parameter that models the synergism between electrical and thermal stresses.
However, the diagnostics of the cable health state through Eq. (1) is hampered because cable temperature estimation is a non-trivial task. It is dependent on a number of factors including the operation environment, cable configuration and applied load among others [5].
There have been few authors who have focused on exclusively using data-driven methods to estimate the lifetime or the time to failure of a cable, e.g. [3]. This is mainly because it is complex to obtain test results which are directly correlated with failure times and degradation trends.
using evidence combination strategies so as to generate a single consistent cable health state estimation. This is traditionally used to avoid inconsistencies when there are different test for the same subsystem [4].
2.4
Health Index
Cable diagnostics outcomes can be converted into a health index form which indicates the health status of the cable according to specific properties. These independent indicators reflect the cable health state according to different criteria. Then it is possible to combine different health indices using evidence combination strategies so as to generate a single, consistent health index. With this modular health index strategy, the implementation of the final health index will depend on the type of approach taken for diagnostics and prognostics models.
2.5
Prognostics
It is possible to use different models to predict the remaining useful life (RUL) of a cable given hypothetical future operation scenarios such as load or ambient temperature profiles. In this context, a possible approach is to use lifetime models which estimate the time-to-failure according to different stress factors, e.g. load, temperature or combinations thereof [see Eq. (1)].
Generally, different prognostics models use different information sources to estimate the RUL of the asset under study, e.g. for cables it is possible to obtain the RUL according to thermal, electrical or insulation stresses or tests [9]. Subsequently, the lifetime predictions generated from different models can be integrated using evidence combination strategies so as to generate a single cable RUL prediction.
Prognostics prediction models determine the RUL according to the developed model. There may be different models that can be used to predict the RUL according to different subsystems, models or test results. If a single consistent RUL is desired, it is possible to study how to combine these subsystem RUL indicators through evidence combination strategies so as to obtain a cable-level RUL estimation.
3
APPLICATION EXAMPLES
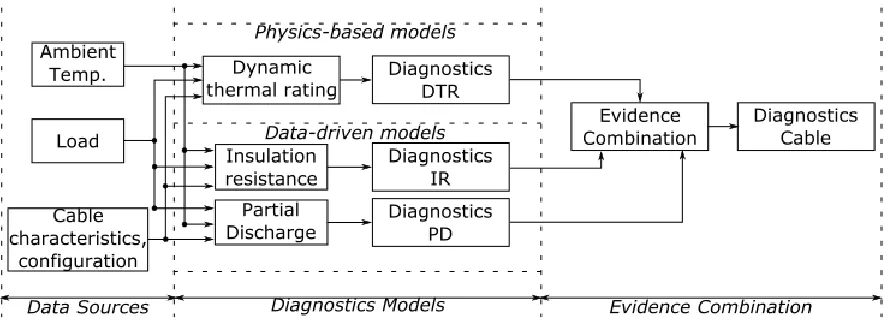
[image:6.612.95.539.512.674.2]Figure 3 shows a cable data analytics framework example suited to a company which performs IR and PD measurements along with load and ambient temperature measurements. Figure 3 is a specific instance of Figure 2, i.e. Figure 3 focuses on a subset of data sources, diagnostics, evidence combination and health index activities from Figure 2.
The analytics in Figure 3 are focused on diagnostics modules and they are further divided into physics-based and data-driven models. Subsequently the diagnostics results are normalized between 0 and 1 for subsystem level decision-making and post-processing purposes. The simplest evidence combination strategy for cable-level diagnostics is to do a weighted average of physics-based and data-driven models, but there are more advanced methods based on data fusion and machine learning concepts [4].
For confidentiality reasons, this section will focus on physics-based models with hypothetical ambient temperature, load and cable characteristics because data-driven models rely on test results which include sensitive information.
[image:7.612.117.510.325.567.2]The main goal of the dynamic thermal rating (DTR) model of the cable is to continuously calculate the cable temperature according to dynamic operation conditions such as changing load or ambient temperature. The development of a physics-based DTR model of the cable requires the calculation of a number of parameters dependent on the physical configuration of the cable and the temporal response of the cable to input load profiles. There are different alternatives to model the cable temperature such as finite element models or equivalent electric circuits [5]. The approach adopted in this paper calculates the cable temperature using an equivalent electrical ladder circuit as shown in Figure 4. The thermal response of each layer of the cable (conductor, insulation, sheath armor, external covering) is modelled using thermal resistances, T, capacitances, Q, and power losses, W.
Figure 4. Cable thermal ladder circuit [5].
Figure 5 shows the conceptual block diagram so as to calculate the cable conductor temperature based on the electrical circuit in Figure 4 through different thermo-electric equations.
First the thermal resistance and thermal capacitance are calculated from Eqs. (2) and (3) [5]:
𝑇 =2𝜋𝜌 𝑙𝑜𝑔 (𝐷𝑒𝑥𝑡
𝐷𝑖𝑛𝑡) (2)
𝑄 =𝜋4(𝐷𝑒𝑥𝑡2 − 𝐷𝑖𝑛𝑡2 )𝐶 (3)
where Dext and Dint are the internal and external diameters of the cable, C is the heat capacity of the material and ρ is the thermal resistivity of the cable.
After calculating the rest of time-independent variables shown in Figure 5 (AC resistance, sheath jacket losses, steady state response and equivalent conductor temperature), subsequently the thermal ladder model in Figure 4 is reduced to a two resistance and two capacitance model by grouping resistances and capacitances. The thermal response of the reduced equivalent circuit is then calculated from Eq. (4) [5]:
𝜃𝑠𝑒𝑙𝑓(𝑡) = 𝑊𝑠𝑒𝑙𝑓(𝑇𝑎(1 − 𝑒−𝑎𝑡) + 𝑇
𝑏(1 − 𝑒−𝑏𝑡)) (4)
where Wself refers to the losses of the cable, Ta, Tb, a, and b are calculated from predefined equations [5]. For each time instant, the temperature of the cable is calculated starting from load and ambient temperature measurements. Firstly the conductor losses are calculated, Wc(t)=I(t)2RAC, where I is the load and RAC is the AC resistance, and then the influence of the soil and the mutual heating of the cables are estimated from Eqs. (5) and (6):
𝜃𝑠𝑜𝑖𝑙(𝑡) = 𝛼(𝑡) [𝑊𝑠𝑒𝑙𝑓(𝑡)4𝜋𝜌 (𝐸𝑖 (−𝐿 2
𝛿𝑡) − 𝐸𝑖 ( −𝐷𝑠𝑢𝑟𝑓2
16𝛿𝑡 ))] (5)
𝜃𝑚𝑢𝑡𝑢𝑎𝑙(𝑡) = 𝛼(𝑡) ∑ [𝑊𝑠𝑒𝑙𝑓(𝑡) 𝜌
4𝜋(𝐸𝑖 ( −𝑑𝑝𝑘2
4𝛿𝑡) − 𝐸𝑖 ( −𝑑𝑝𝑘′2
4𝛿𝑡 ))] 𝑁−1
𝑘=1 (6)
where α(t) is the attainment factor, L denotes the depth burial of the cable, Dsurfdenotes the external surface diameter of the cable, dpk denotes the distance from the cable p to cable k and dpk’ denotes the virtual distance from cable p to k, and σ denotes the diffusivity of the soil (see [5] for a detailed explanation).
Finally, given load and ambient temperature measurements, the cable conductor temperature rise, θrise, and final cable conductor temperature, θc, are calculated as follows [5]:
𝜃𝑟𝑖𝑠𝑒(𝑡) = 𝜃𝑠𝑒𝑙𝑓(𝑡) + 𝜃𝑠𝑜𝑖𝑙(𝑡) + 𝜃𝑚𝑢𝑡𝑢𝑎𝑙(𝑡) (7)
𝜃𝑐(𝑡) = 𝜃𝑟𝑖𝑠𝑒(𝑡)
1+𝜃(∞)−𝜃𝑟𝑖𝑠𝑒(𝑡) 234.5+𝜃𝑎𝑚𝑏(𝑡)
(8)
where θ(∞) is the steady-state response of the cable and θamb is the ambient temperature.
Figure 5. Load, ambient temperature and cable conductor temperature estimation.
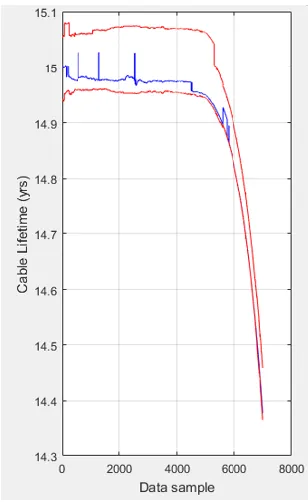
The calculated cable conductor temperature is subsequently used to estimate the cable lifetime. Namely, assuming constant electrical stress, an initial lifetime of 15 years, and using the estimated cable temperature in Figure 5 as the thermal stress in Eq. (1), Figure 6 shows the lifetime degradation with its confidence bounds (red line) and the maximum likelihood lifetime value (blue line).
Figure 6. Cable lifetime estimation.
[image:9.612.239.393.397.648.2]4
CONCLUSIONS
This paper presents a novel high-level data analytics framework for cable lifetime management based on prognostics and health management methods. The proposed framework includes correlation, anomaly detection, diagnostics, evidence combination, health index estimation and prognostics modules. A specific instance of the high-level framework along with diagnostics prediction examples have been shown to illustrate the applicability of the proposed framework. As a consequence, the analytic framework can assist maintenance engineers in the cable lifecycle management process through the identification of early malfunction indicators and estimation of the influence of future operational conditions on cable health.
Future goals will focus on the implementation of the proposed analytics framework through prototyping of different analytic modules and generating useful technical outcomes for maintenance scheduling.
5
ACKNOWLEDGMENTS
The work was funded by Bruce Power, EDF Energy, Babcock International and Kinectrics through the Advanced Nuclear Research Centre (ANRC) at the University of Strathclyde.
6
REFERENCES
1. J. I. Aizpurua, S. D. J. McArthur, B. G. Stewart, B. Lambert, J. G. Cross and V. M. Catterson, “Adaptive Power Transformer Lifetime Predictions through Machine Learning & Uncertainty Modelling in Nuclear Power Plants,” IEEE Trans. Industrial Electronics, Accepted/In Press (2018).
2. J. I. Aizpurua, V. M. Catterson, I. F. Abdulhadi and M. S. Garcia, “A Model-Based Hybrid Approach for Circuit Breaker Prognostics Encompassing Dynamic Reliability and Uncertainty,” IEEE Transactions on Systems, Man, and Cybernetics: Systems, 48, pp. 1637-1648 (2018).
3. T.V. Santhosh, V. Gopika, A.K. Ghosh, B.G. Fernandes, “An approach for reliability prediction of instrumentation & control cables by artificial neural networks and Weibull theory for probabilistic safety assessment of NPPs,” Reliability Engineering & System Safety, 170, pp. 31-44 (2018).
4. J. I. Aizpurua, V. M. Catterson, B. G. Stewart, S. D. J. McArthur, B. Lambert, B. Ampofo, G. Pereira and J. G. Cross, “Determining Appropriate Data Analytics for Transformer Health Monitoring,”
Proceeding of NPIC&HMIT 2017, San Francisco, June 11-15, Vol. n, pp.36-46 (2017).
5. G. Anders, Rating of Electric Power Cables in Unfavorable Thermal Environment, Wiley (2005).
6. V. M. Catterson, S. D. J. McArthur and G. Moss, “Online Conditional Anomaly Detection in Multivariate Data for Transformer Monitoring”, IEEE Trans. Pow. Delivery, 25, pp. 2556-2564 (2010)
7. J. I. Aizpurua, V. M. Catterson, Y. Papadopoulos, F. Chiacchio and G. Manno, “Improved Dynamic Dependability Assessment Through Integration With Prognostics”, IEEE Transactions on Reliability, 66, 893-913 (2017)
8. G. Mazzanti, “The combination of electro-thermal stress, load cycling and thermal transients and its effects on the life of high voltage ac cables”, IEEE Transactions on Dielectrics and Electrical Insulation, 16, pp. 1168-1179 (2009)
![Figure 4. Cable thermal ladder circuit [5].](https://thumb-us.123doks.com/thumbv2/123dok_us/1328745.86779/7.612.117.510.325.567/figure-cable-thermal-ladder-circuit.webp)