Are they Working?
Market Orientation and the Effectiveness of
Active Labour Market Programmes in Ireland
*Philip J. O’Connell
June 1999
ESRI Working Paper No. 105
Abstract
This paper presents the first findings of a new study of the labour market impact of a range of active labour market programmes (ALMPs) in Ireland. The paper combines the results of two individual-level data sets to compare the employment outcomes of participants in ALMPs with a comparison group of non-participants over the 1994-1996 period. The analysis focuses on employment probabilities two years post-programme, and shows that programmes with strong linkages to the labour market are more likely to improve the job prospects of participants than those characterised by weak market linkages. The importance of market orientation is maintained when account is taken of the influence of individual characteristics such as age, gender and educational qualifications as well as previous labour market experience.
The study builds on earlier work which demonstrated the importance of the market orientation of programmes for young peoples’ employment prospects (O’Connell and McGinnity, 1997a), but the new analysis extends these findings to the entire population of participants in ALMPs – including older as well as young participants. The paper also examines the impact of programmes among different population sub-groups, including: the long- versus the short-term unemployed, women versus men, and older versus younger participants.
*
1.
Introduction
With rising unemployment there has been a general tendency throughout the OECD countries to move from passive measures which provide financial supports for unemployed workers to active measures designed to improve the skills and competencies of workers and support the search process in the labour market. Such measures include education and training programmes as well as the provision of temporary employment schemes and recruitment subsidies. Averaging across the OECD countries, annual public expenditures on active labour market programmes, including public employment services, and training and temporary employment programmes, amount to about 1 per cent of GDP. Expenditures on active labour market programmes (ALMP) in Ireland amounted to 1.75% of GDP in 1996. This was considerably higher than the average of about 1% of GDP for the OECD group of industrial countries, although lower than in a number of Scandinavian countries, particularly Sweden, Denmark and Finland, where active policies play a particularly important role. Given that labour market programmes represent a very significant investment of resources in Ireland, it is important to assess the effectiveness of the interventions. The following section outlines the international evidence on the impact of ALMPs, focusing in particular on what kinds of programmes have been found to be effective in enhancing participants’ employment prospects ands earnings. Section 3 describes the two surveys which provide the empirical basis for the present study and outlines the methodological issues in the analysis of programmes effectiveness. Section 4 presents the findings on the net impact of different types of programmes on subsequent employment chances, while Section 5 presents a simple model of the effects of programme participants on earnings from employment. The final section draws conclusions.
2.
What Works? – Evidence from the International Literaturegenerate additional employment under conditions of skills shortages or mismatches (see Calmfors (1994) and OECD (1993) for a comprehensive review of the effects of ALMPS on total employment). In fact, there are good reasons to believe that training may have such positive effects in the Irish context, both because of the relatively low level of in-company training in Irish firms (Sexton and O’Connell, 1996), and also because of the emergence of skill shortages in the booming economy.
Even where ALMPs have little or no effect on the level of employment at the aggregate level, they may nevertheless serve to redistribute employment opportunities among the unemployed: for example, from relatively advantaged to less advantaged competitors for work. Evaluating the micro level effects of ALMPs has generated a large and increasingly sophisicated international empirical literature. Fortunately, a number of excellent survey of that literature are available – including the OECD (1993), US Department of Labour (1995), Fay (1996) and Friedlander et al. (1997). The general thrust of this international literature is that the effectiveness of ALMPs may be quite limited, although effects on both employment prospects and earnings have been found to differ both across different types of programmes and target groups.
With regard to supply oriented, i.e. training, programmes the findings of the empirical literature are mixed. A number of studies have found positive effects of participation in training programmes on employment chances, earnings, or both (Raum, et al. 1995; Payne et al., 1996; Card and Sullivan, 1988). On the other hand, however, studies of training programmes in Canada found insignificant long-run effects for most participants with the exception of young people and women re-entrants (Abt Associates, 1993). Moreover, while Axelsson, (1989) found strong positive effects of training in Sweden in 1981/82, a later study of the same programme relating to 1989/90 found negative effects (Andersson, 1993).
public sectors is limited, although, as in the case of other measures, the evidence is mixed (Erhel et.al., 1996).
The OECD survey (1993), in its wide-ranging review of 51 studies of the effectiveness of ALMPs in various countries conducted by the OECD (1993) suggests that their effectiveness in improving employment chances is limited. With regard to broadly targeted training programmes for unemployed adults - the most common category of active labour market programme - the review found "remarkably meagre support for a hypothesis that such programmes are effective." (p. 58). The review did, however, suggest that training targeted specifically at disadvantaged did yield more positive results. With regard to public subsidies to employment or self-employment in the private sector, the review suggested high levels of deadweight, substitution and displacement. The OECD concluded that there was little to justify broad targeting of such subsidies, although specific targeting could be justified if the policy objective is to redistribute employment opportunities. Finally, the review suggested that direct job creation schemes were less likely to suffer from high deadweight than employment subsidies - since most participants would have few alternative employment opportunities - and that programmes can be designed to minimise substitution and displacement. Nevertheless, the evidence is inconclusive regarding the impact of broadly targeted public works, although as in the case of training, positive employment effects have been found for specialised schemes designed for particular groups.
Fay’s (1996) review of the literature provides a useful updating of the original OECD survey and introduces some clarity into the assessment of what kinds of programmes work and for which target groups:
• Job-search assistance appears to be effective for most groups of unemployed persons. • The effects of formal classroom training appear to be mixed, with most programmes having
little impact on employment prospects, although well-targeted programmes have been found to have beneficial outcomes.
• Employment subsidies can have beneficial effects, particularly those targeted on the long-term unemployed and women re-entrants.
• Subsidies to aid the unemployed to start their own businesses appear to be successful for some individuals, although they incur high deadweight losses and displacement effects can be high.
• Public sector job creation or direct employment schemes may be of benefit to those facing particularly severe barriers to labour market entry or re-entry, but few evaluations have found any positive effects on either employment prospects or earnings.
• Women appear to benefit from a wide range of interventions, including job-search assistance, formal classroom training and wage subsidies. While women have been found to benefit more form ALMPs than men, the evidence is less clear about which types of programme, or combinations of programmes, are most effective.
• The evidence on effects of ALMPs on the long-term unemployed is mixed, although they do appear to benefit from specially-tailored programmes, job-search assistance and wage-subsidies.
O’Connell and McGinnity, (1997a) argue that a common weakness of the international empirical literature is a failure to take adequate account of the importance of qualitative differences between programmes. Not all ALMPs are of equal value to their participants, and evaluations should pay more attention to the question of what kinds of ALMP are more effective. In fact, however, not all programmes incorporate even the conventional distinction between supply and demand oriented measures. This is the case in Britain where the Youth Training Scheme (YTS) combines features of both subsidised work experience and formal training (Jones, 1988). Most evaluations of the YTS have found positive effects on employment (Main and Shelly, 1990; Whitfield and Bourlakis, 1991; O’Higgins, 1994). Dolton, Makepeace and Treble (1994), moreover, found negative employment effects of YTS for men but positive effects for women. The results in relation to earnings were, however, inconsistent, with Whitfield and Bourlakis finding negative effects, and Main and Shelly arriving at inconclusive results.
Much of the literature on US programmes also appears to encounter difficulties distinguishing between different programme types. Bassi’s (1984) evaluation of schemes funded under the Comprehensive Employment and Training Act (CETA), found positive earnings effects for women but not for men. Bassi, however, did not distinguish between the different types of programme funded under the CETA umbrella. Haveman and Hollister did distinguish between different types of CETA programme, and concluded that public service employment and on-the-job training were more effective than work experience or classroom training. Yet Card and Sullivan (1988), in a three year follow-up study, found the opposite effects; namely, that classroom training was more effective than other CETA programmes. In Card and Sullivan, however, the key distinction was that between ‘classroom trainees’ and ‘non-classroom trainees’, a category which included on the job training, and work experience in public sector jobs, and which, therefore, confounded the conventional distinction between supply and demand measures. Thus, part of the inconsistency in the US research may be also due to the lack of attention to differences between programme types.
frequently pessimistic, although there is some evidence to suggest that well designed programmes targeted specifically at the ‘hard-to-place’, may have positive effects. They also argue,however, that this general confusion surrounding the impact of active labour market policies is due partly to two related shortcomings in the literature, one methodological; one conceptual. At the methodological level, most, but not all, empirical studies tend to evaluate the impact of single programmes (Bassi, 1984; Main & Shelly, 1990; Whitfield & Bourlakis, 1991; O’Higgins, 1994; Dolton, Makepeace & Treble, 1994). Many such evaluations display considerable technical sophistication in controlling for the individual characteristics of individuals and adjusting for selection effects, but single-programme evaluations, by their nature, are unable to take account of qualitative differences between programmes.
At the conceptual level, there is a general tendency in the literature to treat programmes as “black boxes”, examining inputs to and outputs from programmes, without enquiring too deeply into what goes on in programmes, or to qualitative differences between differing components within programmes - this characterises much of the literature on the YTS programme in the UK and CETA in the US.
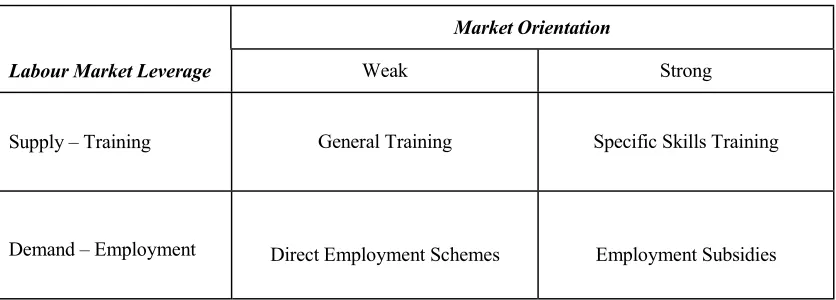
[image:6.595.90.508.525.675.2]In order to incorporate qualitative differences between different types of ALMPS, O’Connell and McGinnity (1997a) develop a typology of ALMPs which goes beyond the conventional distinction between supply and demand measures to distinguish also between programmes in terms of the strength of their linkages with the labour market, giving rise to the fourfold typology of active labour market programmes outlined in Figure 1.
Figure 1
A Typology of Active Labour Market Programmes
Market Orientation
Labour Market Leverage Weak Strong
Supply – Training General Training Specific Skills Training
Demand – Employment Direct Employment Schemes Employment Subsidies
training courses designed for women seeking to return to the labour market; and community training programmes, oriented toward the development of community resources and responses to unemployment.
Specific Skills Training courses provide training in specific employable skills to meet skill needs in local labour markets. The distinction between General and Specific Skills Training is not simply a question of the level of training, although the latter may often be at a more advanced level than the former. Specific Skills Training can cover a wide range of skill levels - in the Irish case, for example, the category includes courses in retail sales as well as advanced courses in Computer Aided Engineering. What these training courses share in common is that they are designed to meet specific skill needs in particular occupations and industries.1
Direct Employment Schemes. These programmes consist of subsidised temporary employment in the public or voluntary sectors - variants of the conventional public works programmes. Most work in this type of programme is of a nature which would not be commercially viable - e.g. environmental improvements, provision of community-based child care.
Employment Subsidies. These provide subsidies to the recruitment or self-employment of unemployed workers in the private sector. Typically they are targeted on those who would otherwise be hard to place in employment - e.g. the long-term unemployed.
O’Connell and McGinnity (1997a and 1997b) test the hypothesis that programmes with a strong orientation to the open labour market are more likely to enhance the employment prospects of participants than programmes with weak market linkages. Thus skills training programmes should have a greater positive impact on subsequent employment to the extent that they provide participants with skills that meet identified needs of employers. Similarly, employment subsidies are designed to insert participants in real jobs in the marketplace, with the result that the work experience and skills learned on the job are likely to be closer to those in demand in the labour market than work experience or skills learned while participating in direct employment schemes on projects which, by their nature, are not viable in the market. The findings, based on a follow-up survey of young programme participants and a
comparison group of non-participants, provide strong support for the importance of market orientation: programmes with strong linkages to the labour market were found to both enhance the employment prospects of their participants, and increase their employment duration, and earnings from employment, even when account was taken of relevant individual characteristics such as education and previous labour market experience.
O’Connell and McGinnity’s contribution to the literature is to develop a typology of ALMPs based on underlying labour market processes – the nature and strength of the relationship between programmes and the open labour market – and to use that typology to assess what kinds of programmes are of greater benefit to their participants. In the Irish case, previous research by Breen (1991) has only been able to distinguish between supply and demand oriented programmes. This distinction is not sufficiently precise to assess the relative effects of different kinds of programmes, and Breen’s finding on the long-term effects of programmes were inconclusive.2 In further work, O’Connell and McGinnity (forthcoming, 1999) found that the effects of market oriented programmes are greater among women than men, which is consistent with the general thrust of the international literature.
The principal caveat which applies to O’Connell and McGinnity’s work (and indeed, to Breen’s) is that the findings relating to the differential effects of ALMPS relate are most robust in relation to young people aged under 23 years. This was because they lacked a comparison group of older non-participants to compare with the programme experiences of older participants. However, the pattern of post-programme employment and earnings among older participants are consistent with the pattern found to obtain among young people.
3.
Data and Methodology
This study combines the results of two individual-level data sets to examine the labour market impact of a range of different active labour market programmes (ALMPs) in Ireland. The study combines data from: (a) The 1996 FÁS Follow-up Survey - covering programme participants in a range of different labour market programmes; and (b) A comparison group drawn from the 1994 and 1995 waves of the Living in Ireland Survey. Combining the two data sets allows us to compare labour market outcomes of participants with non-participants over a similar 2-year time period - with the result that macro-economic and labour market conditions are similar for both groups. O’Connell and McGinnity (1997) show that placement rates
in employment tend to stabilise within the first 12 months after leaving a programme, suggesting that our two-year comparison represents an adequate post-programme duration over which to assess programme effectiveness.
3.1 The FAS Follow-up and Living in Ireland Surveys
The data on programme participants comes from the FAS Follow-Up Survey conducted by the ESRI in 1996. The survey is described in detail in Watson (1996). The population for that survey consisted of the 20,938 individuals who left a FAS course or scheme between April and July 1994. A random sample of 2,078, roughly 10% of programme leavers, was taken. The sample was disproportionately stratified by programme to ensure adequate numbers of cases in the smaller programmes, and proportionately by age, gender and region within programmes. Data collection was conducted between January and June 1996, about 2 years after they had left their programmes. Data collection was initially conducted by post, followed by telephone or personal contact of those who did not respond to the postal questionnaire. Identical questionnaires were used in each of the survey methods. A total of 1473 questionnaires were completed, representing a response rate of 71% of the target sample, of which 40% were conducted by post, 37% by telephone and the remaining 23% by personal interview. Following the survey, weights were generated to render the sample data representative of the population of programme leavers in terms of programme, age group, gender and region. The survey collected a range of indicators relating to experience of and satisfaction with the training or employment programme, previous labour market history, post-programme work and training experiences, current employment situation and earnings, as well as standard socio-demographic information on age, gender and educational attainment.
The comparison group of non-participants was drawn from the 1994 and 1996 waves of the longitudinal Living in Ireland Survey (LIS). The Living in Ireland Survey is the Irish component of the European Community Household Panel Survey (ECHP) and is described in detail in Callan et al (1996). The 1994 wave of the Living in Ireland Survey is a nationally representative sample of over 4,000 households, with almost 10,000 individuals aged 17 years or over. The 1994 wave provides data on a range of individual characteristics, including age, gender, educational attainment, and labour market experience and unemployment. The third (1996) wave of the panel survey provides a detailed record of labour market and employment experience over the twelve months to Autumn 1996.
immediately prior to their programmes - most were engaged in home duties. In order to provide a comparison group for this latter group, I selected an additional group of 120 individuals from the LIS who were not economically active in at the time of interview in 1994 but who did respond that they were looking for work. The comparison group constructed from the first wave of the LIS were then tracked through the 1995 and 1996 waves to record their labour market situation and income from employment in the two subsequent years. This generated a comparison group of 558 individuals who were unemployed, or economically inactive but seeking work, at about the same point in time that the participant group left their programmes.
Table 1
Descriptive Statistics, Participant and Comparison Group
Participants Non-participants
Mean Std.
Deviation
Mean Std.
Deviation
Female 0.45 0.50 0.40 0.49
Age 27.99 11.06 35.54 12.45
Married or with partner 0.32 0.47 0.54 0.50
No Qualification 0.19 0.39 0.43 0.50
Junior Cert. 0.29 0.46 0.28 0.45
Leaving Cert. 0.28 0.45 0.18 0.38
Third Level 0.22 0.42 0.10 0.30
Unemployed less than 6 months 0.47 0.50 0.19 0.39
Unemployed 6-12 months 0.14 0.34 0.06 0.24
Unemployed 1-2 years 0.10 0.30 0.11 0.31
Unemployed 2+ years 0.18 0.38 0.42 0.49
Never worked 0.24 0.43 0.15 0.36
Not in Labour Force (prior) 0.10 0.30 0.22 0.41
N of cases 1433 558
Table 1 shows descriptive statistics for the participant and comparison group.3 While the two groups shared similar labour market situations in mid-1994, there were some differences between the two groups. The average age of the comparison groups, 35.5 years is somewhat older than the participants group, 28 years. A greater proportion of the comparison group is married or living with a partner, and the distribution of educational qualifications is lower than among the participant group. More of the participant group was unemployed for relatively short durations immediately prior to programme participation than the comparison group. A greater proportion of the
3 In the case of the comparison group, about 40 respondents were excluded from the analysis because
participant group had never worked, and less were outside of the labour force than was the case for the comparison group.
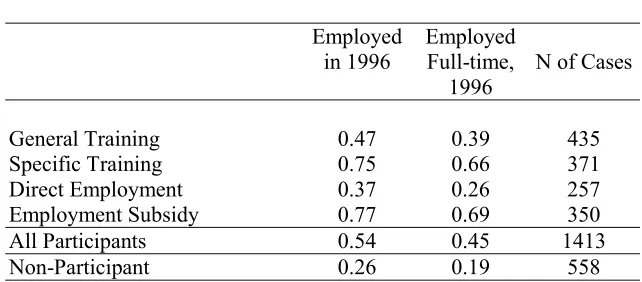
[image:11.595.136.457.377.518.2]Table 2 shows the proportions employed and employed full-time at the time of interview in 1996 by programme and for the comparison group. The table shows that more than half of all participants who left programmes in 1994 was employed two years later in 1996. This is substantially higher than the employment rate for the comparison group, about one-quarter of whom were at work two years after their first interview. Somewhat lower proportions were employed full-time, as would be expected, although large the differential between the two groups is maintained. The data also show substantial variation within the participant group by programme, with only 37% of participants in Direct Employment schemes at work in 1996, compared to 77% of participants in Employment Subsidies.
Table 2
Proportions Employed and Employed Full-time in 1996 by Programme
Employed in 1996
Employed Full-time,
1996
N of Cases
General Training 0.47 0.39 435
Specific Training 0.75 0.66 371
Direct Employment 0.37 0.26 257
Employment Subsidy 0.77 0.69 350
All Participants 0.54 0.45 1413
Non-Participant 0.26 0.19 558
Training is mainly targeted on younger unemployed people, often with shorter periods of pre-programme unemployment and better educational qualifications.
These considerations simply reinforce the well-established argument that ‘raw’ placement rates are poor indicators of programme. Assessing the net effects of programmes entails both taking account of relevant individual characteristics participants, such as age, gender, education and previous labour market experience, as well as comparing outcomes for participants with an appropriate comparison group of non-participants. To achieve this it is necessary to shift to multivariate analysis of individual level data.
3.2 Modelling the Effectiveness of Programmes
The behaviour of individuals in relation to ALMPs can be depicted in the following equation:
Yit = ay + bt*Pit-1 + b2*Xi + uit (A)
In this model, Yit represents the outcome of interest (say, earnings or employment
probability) for the Ith person in period t (i.e at some period post-programme), where t-1 is the period when the intervention takes place (this may be measured at time of programme entry or leaving). Xi is a sets of exogenous variables and personal
characteristics for individual i, usually measured at or before programme entry. Pit-1 is a
dichotomous variable, valued 1 if the individual is a programme participant and zero if a non-participant. uit is the random error term. The mean effect of programme
participation is given by bt. In the present instance P takes the form of a vector of
dichotomous participation variables measuring participation in one of the fourteen different programmes covered in the FAS Follow-up Survey.
While Equation (A) depicts the outcome as a simple linear variable, Y can be transformed as appropriate to the specific outcome of interest. Thus, models of employment probabilities are typically estimated using a Logit regression analysis where:
Yit = ln (E/(1-E))ti
4.
Modelling Employment Chances
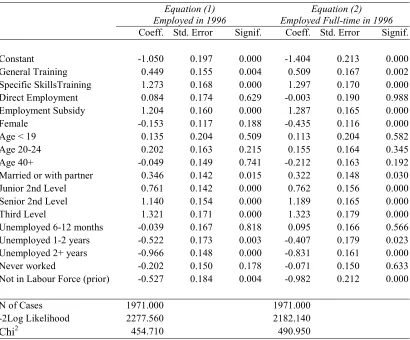
Table 3 shows the results of a simple logistic regression analysis of employment chances in 1996 as a function of type of programme. Equation (1) refers to the probability of being at work either full- or part-time in 1996, and Equation (2) relates only to part-time work. The reference category for the equations is non-participation – membership of the control group. The model also controls for a series of variables measuring individual characteristics and previous labour market experience, all operationalised as dichotomous variables. The control variables include: gender, age group, marital status, educational qualifications, duration of previous employment, whether the individual had ever previously worked, and whether the individual was outside of the labour market immediately prior to programme participation (or the first interview in the case of non-participants).
The results in Table 3 tell a very different story to Table 2, which showed that the two-year placement rates in employment for all were higher than the placement rate for non-participants. Table 3 shows that, when we take account of individual characteristic and labour market histories, participants in three programmes, General and Specific Training, and Employment Subsidies, had higher employment probabilities than non-participants, but that the employment probability of participants in Employment Subsidies was not significantly different from the participant group. Moreover, the positive effects of participation in either of the market-oriented programmes, Specific Training and Employment Subsidies, were substantially greater than the effect of General Training.
The effects of the control variables are in accordance with conventional understandings of the labour market. Neither gender nor age had significant effects, although those aged over 40 have somewhat lower, but non-significant, employment prospects than those aged 25-39, the reference category. Married people and those living with partners are more likely than single people to be at work after two years have elapsed. Educational qualifications were strongly related to employment prospects: those with no qualifications were much less likely to be at work than those with a Junior level certificate, and possession of a Leaving Certificate, or attendance at third level education both had positive effects on employment chances.
having been unemployed for over two years was even stronger. The effect of never having worked was negative, but non-significant, but those who were outside of the labour force before programme participation, or in the summer of 1994 in the case of non-participants, did significantly reduce employment chances.
Table 3
Logistic Regression of Employment Chances 2 Years Post-Programmme
Equation (1) Employed in 1996
Equation (2) Employed Full-time in 1996 Coeff. Std. Error Signif. Coeff. Std. Error Signif.
Constant -1.050 0.197 0.000 -1.404 0.213 0.000
General Training 0.449 0.155 0.004 0.509 0.167 0.002
Specific SkillsTraining 1.273 0.168 0.000 1.297 0.170 0.000
Direct Employment 0.084 0.174 0.629 -0.003 0.190 0.988
Employment Subsidy 1.204 0.160 0.000 1.287 0.165 0.000
Female -0.153 0.117 0.188 -0.435 0.116 0.000
Age < 19 0.135 0.204 0.509 0.113 0.204 0.582
Age 20-24 0.202 0.163 0.215 0.155 0.164 0.345
Age 40+ -0.049 0.149 0.741 -0.212 0.163 0.192
Married or with partner 0.346 0.142 0.015 0.322 0.148 0.030
Junior 2nd Level 0.761 0.142 0.000 0.762 0.156 0.000
Senior 2nd Level 1.140 0.154 0.000 1.189 0.165 0.000
Third Level 1.321 0.171 0.000 1.323 0.179 0.000
Unemployed 6-12 months -0.039 0.167 0.818 0.095 0.166 0.566
Unemployed 1-2 years -0.522 0.173 0.003 -0.407 0.179 0.023
Unemployed 2+ years -0.966 0.148 0.000 -0.831 0.161 0.000
Never worked -0.202 0.150 0.178 -0.071 0.150 0.633
Not in Labour Force (prior) -0.527 0.184 0.004 -0.982 0.212 0.000
N of Cases 1971.000 1971.000
-2Log Likelihood 2277.560 2182.140
Chi2 454.710 490.950
The pattern of effects in Equation (2), which models the chances of full-time employment in 1996, is very similar to Equation (1). The pattern of programme effects on full-time employment is virtually identical to that found for all employment, although the negative effect of TPW is non-significant in Equation (2). The second equation also suggests that women are less likely than men to be at work full-time. This is consistent with the general growth in women’s part-time work observed in the Irish labour market in recent years (O’Connell, 1999).
(1).4 The employment probability of a single male in the 25-39 year age group, with no qualifications, unemployed for less than six months in 1994 and who had not participated in any employment or training programme was .26, equivalent, as it happens, to the employment or placement rate for the comparison group. While the gross placement rates suggest that participation in any programme had a strong positive effect on subsequent employment chances, the probabilities derived from the model which controls for individual characteristics and labour market history provide a more appropriate picture of the net effects of programme participation.
[image:15.595.92.504.471.617.2]The strongest programme effects relate to participation in the two market oriented programmes, both of which more than doubled employment chances two years later. Participation in General Training had a modest effect, increasing employment chances by 9 percentage points, and participation in Community Employment, the Direct Employment Scheme had no effect on employment two years later. Some indication of the scale of programme effects can be gleaned from looking at the effects of changes in the educational attainment or previous unemployment duration compared to the model reference group. Completion of a Leaving Certificate increased employment chances by 26 percentage points, compared to possession of no qualifications. Unemployment for 2 or more years reduced employment probabilities by 14 points, compared to an individual unemployed for less than 6 months.
Table 4
Measures of Programme Effectiveness
Observed and Predicted Probability of Employment After 2 Years
Placement Rate Model Predictions*
Comparison Group .26 .26
Difference:
General Training +.21 +.09
Specific Skills +.49 +.30
Direct Employment +.11
Employment Subsidies +.51 +.28
Completed Secondary Education -- +.26
Unemployed 2+ years -- -.14
* Model predictions based on:
Single male, aged 25-39 years, no qualifications, unemployed less than 6 months
4 Employment probability in respect of significant coefficients is calculated as eb /(1+eb) where eb is the
Up to this point we have looked at programme effects for all participants. It is useful also, however, to consider differences in programme effectiveness for certain sub-groups in the population, including duration of previous unemployment, gender, and age group. Thus, for example, while the results of the initial models indicate that duration of previous unemployment has an influence on post-programme chances of employment, they do not tell us whether the estimated effects of programmes are similar between those short and long-term unemployed.
Programme Effects by Duration of Prior Unemployment
Table 5 shows the results of estimating separate models of the logistic regression equation for any employment at the time of interview in 1996 for those unemployed less than 1 year in 1994 versus those long-term unemployed in 1994 (Equations 3a and 3b).5 Statistically, the separate equations are very similar to Equation (1), where unemployment-duration categories are pooled, although age has statistically significant effects among the short-term unemployed group, but not the long-term unemployed group. The table reveals interesting differences between the short- and long-term unemployed. First, as might be expected, the intercept suggests that the long-term unemployed in the comparison group reference category have lower employment chances than the short-term unemployed. In these models, only the market oriented programmes have positive effects, and the effects of both are substantially stronger among the long- than the short-term unemployed. Thus, when we convert the coefficients into employment probabilities, Specific Training increases the employment probabilities of the short-term unemployed by 20 percentage points (from a baseline employment probability of .26) and the employment probability of the long-term unemployed by 35 percentage points (from a baseline probability of .22). Differences in the effects of Employment Subsidies are even more dramatic, increasing the employment probability of the short-term unemployed by 21 percentage points, and that of the long-term unemployed by 41 percentage points. These differences in programme effectiveness by duration of prior unemployment suggest that effective programmes have the added advantage of having a greater net impact on the employment chances of the long-term unemployed. The table also show that the effect of educational qualifications is much stronger among the short- than the long-term unemployed group.
5 In order to ensure a precise comparison between the short- and long-term unemployed, we excluded
Table 5
Logistic Regression of Employment Chances 2 Years Post Programme, Separate Models for ‘Short-’ and ‘Long-term’ Unemployment
Equation (3a) Unemployed less than
1 year in 1994
Equation (3b) Long-term Unemployed
In 1994
Coeff. Std. Error Signif. Coeff. Std. Error Signif.
Constant -1.021 0.309 0.001 -1.291 0.335 0.000
General Training -0.012 0.237 0.962 0.192 0.353 0.587
Specific SkillsTraining 0.881 0.243 0.000 1.557 0.348 0.000
Direct Employment 0.143 0.273 0.601 -0.140 0.285 0.622
Employment Subsidy 0.934 0.240 0.000 1.799 0.302 0.000
Female -0.126 0.149 0.399 -0.048 0.244 0.845
Age < 19 0.566 0.271 0.037 -0.548 0.530 0.302
Age 20-24 0.427 0.220 0.052 -0.008 0.307 0.980
Age 40+ 0.190 0.274 0.487 -0.175 0.245 0.474
Married or with partner 0.416 0.219 0.058 0.302 0.238 0.205
Junior 2nd Level 0.910 0.224 0.000 0.641 0.245 0.009
Senior 2nd Level 1.300 0.232 0.000 0.869 0.305 0.004
Third Level 1.547 0.254 0.000 0.509 0.368 0.167
Unemployed 6-12 months -0.220 0.177 0.215
Unemployed 2+ years -0.677 0.222 0.002
Never worked -0.268 0.208 0.198 -0.034 0.311 0.913
N of Cases 981.000 607.000
-2Log Likelihood 1133.760 627.670
Chi2 110.880 113.750
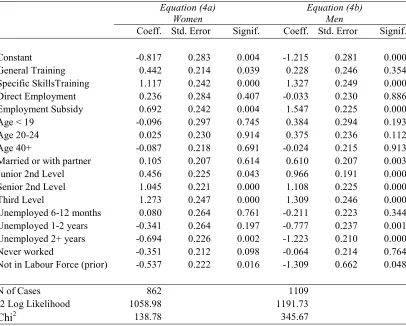
Programme Effects by Gender
Table 6
Logistic Regression of Employment Chances 2 Years Post-Programme, Separate Models by Gender
Equation (4a)
Women Equation (4b)Men
Coeff. Std. Error Signif. Coeff. Std. Error Signif.
Constant -0.817 0.283 0.004 -1.215 0.281 0.000
General Training 0.442 0.214 0.039 0.228 0.246 0.354
Specific SkillsTraining 1.117 0.242 0.000 1.327 0.249 0.000
Direct Employment 0.236 0.284 0.407 -0.033 0.230 0.886
Employment Subsidy 0.692 0.242 0.004 1.547 0.225 0.000
Age < 19 -0.096 0.297 0.745 0.384 0.294 0.193
Age 20-24 0.025 0.230 0.914 0.375 0.236 0.112
Age 40+ -0.087 0.218 0.691 -0.024 0.215 0.913
Married or with partner 0.105 0.207 0.614 0.610 0.207 0.003
Junior 2nd Level 0.456 0.225 0.043 0.966 0.191 0.000
Senior 2nd Level 1.045 0.221 0.000 1.108 0.225 0.000
Third Level 1.273 0.247 0.000 1.309 0.246 0.000
Unemployed 6-12 months 0.080 0.264 0.761 -0.211 0.223 0.344
Unemployed 1-2 years -0.341 0.264 0.197 -0.777 0.237 0.001
Unemployed 2+ years -0.694 0.226 0.002 -1.223 0.210 0.000
Never worked -0.351 0.212 0.098 -0.064 0.214 0.764
Not in Labour Force (prior) -0.537 0.222 0.016 -1.309 0.662 0.048
N of Cases 862 1109
-2 Log Likelihood 1058.98 1191.73
Chi2 138.78 345.67
Programme Effects by Age-Group
Table 9 shows separate employment equations for those aged less than 25 and those aged 25 years or over. The baseline employment probability is substantially higher for the younger age-group (.28) than the older group (.17). Considering, first, the control variables, we can see that young women have lower employment chances than young men, a gender effect that does not occur among the older age group. Among the younger age group, educational qualifications have greater positive influence on employment chances and prior unemployment duration has a greater negative influence. Marriage has a positive effect on employment chances among the older age-group, but not the younger age-group.
Table 7
Logistic Regression of Employment Chances 2 Years Post-Programme, Separate Models by Age Group
Equation (4a) Age less than25 years
Equation (4b) Age over 25 years Coeff. Std. Error Signif. Coeff. Std. Error Signif.
Constant -0.455 0.320 0.156 -1.304 0.233 0.000
General Training 0.123 0.249 0.622 0.560 0.227 0.014 Specific SkillsTraining 1.050 0.258 0.000 1.269 0.249 0.000 Direct Employment 0.110 0.386 0.777 0.125 0.202 0.538 Employment Subsidy 0.729 0.267 0.006 1.559 0.216 0.000
Female -0.335 0.156 0.031 0.074 0.187 0.692
Age < 19 -0.092 0.186 0.620
Age 40+ -0.114 0.153 0.456
Married or with partner -0.190 0.321 0.554 0.496 0.163 0.002 Junior 2nd Level 0.742 0.239 0.002 0.726 0.183 0.000 Senior 2nd Level 1.208 0.247 0.000 0.935 0.212 0.000
Third Level 1.410 0.274 0.000 1.187 0.232 0.000
Unemployed 6-12 months -0.078 0.238 0.743 0.018 0.240 0.940 Unemployed 1-2 years -0.968 0.263 0.000 -0.151 0.237 0.523 Unemployed 2+ years -1.031 0.329 0.002 -0.862 0.176 0.000 Never worked -0.134 0.167 0.422 -0.512 0.391 0.190 Not in Labour Force
(prior)
-1.230 0.552 0.026 -0.543 0.222 0.014
N of Cases 906 1055
-2 Log Likelihood 1055.24 1186.66
Chi2 153.5 243.27
4.1 Controlling for Selection Effects
Up to this the analysis the has focused on programme effects while controlling for observable differences in variables believed to independently influence employment chances, such as education and previous labour market experience, etc. A remaining problem with comparisons of the type we have conducted is that we may not have measured all of the relevant differences between the comparison and participant groups, and that such differences may be related both to the employment outcome and to the probability of participation in a programme. For example, ‘better motivated’ individuals may be more likely to participate in an active labour market programme, and such motivation may also be of help in finding a job. This gives rise to a problem of selection bias and if we do not take account of such unobserved (and frequently unobservable) differences in some way then we may overestimate the effects of participation in programmes.
Yit = ay + bt*Pit-1 + b2*Xi + uit (A)
Pit-1 = ap + b3* Zi + eit-1 (B)
Equation A is the familiar outcome equation, the logistic form of which we have
estimated in Equations (1) through (5b) above. Equation (B) represents a
participation equation, and reflects the fact that the decision to participate in a programme can be made by either a prospective participant, a programme administrator, or both.
Overcoming the problem of selection bias has generated a great deal of debate and empirical work, and a variety of statistical techniques has been developed to correct for such bias (Breen, 1996; Heckman, 1979; Heckman and Robb, 1986; Heckman and Smith, 1996; Winship and Mare, 1992). In the simple case, the most commonly used approach is to estimate both a participation equation (B), and an outcome equation (A). If an unmeasured, and therefore omitted, variable does exist which influences both participation and employment probabilities, then the residuals from the two equations, ut-1 and et, will be correlated, resulting in biased coefficients in the outcome
equations.
The Heckman correction procedure involves the introduction to the output equation of a correction term, lamda (λ), which is derived from a Probit estimation of the probability of participation.6 The standard application of the Heckman correction equation consists of (1) a Probit estimation of the selection equation, followed by (2) an OLS model of the outcome incorporating the correction term (λ), although this approach can be adjusted to fit the exigencies of particular evaluations where necessary (e.g. O’Connell and McGinnity, 1997). In the present instance, we are concerned with a binary dependent variable, employment versus non-employment, with the result that OLS estimation of the outcome equation is inappropriate, and it is necessary to estimate both participation and outcome equations as Probits.
A further complication in the present analysis derives from the fact that we are concerned with the outcomes, or net effects, of 14 different programmes, rather than, as is typical, one programme. The solution adopted here is to assume that the participation decision is a dichotomous choice between participation in any
6 Winship and Mare (1992) argue that the Heckman procedure may be sensitive to violations of its
programme versus non-participation. This assumes that potential programme participants decide whether to seek participation in an active labour market programme, but do not choose which specific programme they wish to participate in -e.g. choosing Specific Skills Training versus Community Training Workshops. This assumption appears reasonable both because of the general lack of information pertaining to the range of active labour market programmes available to potential participants, and because our models already control for a range of factors which influence eligibility for different programmes – particularly duration of previous unemployment and age.
The model to correct for selection bias thus consists of the following pair of equations:
I. A Probit estimation of the participation equation (B), where PI is a dichotomous variable, code ‘1’ if the individual participated in any of the 14 programmes, ‘0’ if the individual participated in none.
II. A Probit estimation of the outcome equation (A), where the set of 14 dichotomous variables PII, indicating participation/non-participation in each programmes, aggregates to a linear combination of PI in the participation equation above.
Table 8
Probit Models of Employment Chances 2 Years Post-Programme
Equation (6a)
Full specification Parsimonious SpecificationEquation (6b) Coeff. Std. Error Signif. Coeff. Std. Error Signif.
Constant -0.634 0.117 0.000 -0.650 0.092 0.000
Female -0.096 0.070 0.170
Age less than 20 0.076 0.122 0.534
Age 20-24 0.122 0.097 0.208
Age 40+ -0.037 0.089 0.676
Married or with partner 0.210 0.085 0.013 0.190 0.072 0.009
Junior Cert. 0.455 0.085 0.000 0.465 0.084 0.000
Leaving Cert. 0.684 0.092 0.000 0.690 0.090 0.000
Third Level 0.798 0.102 0.000 0.817 0.099 0.000
Unemployed 6-12 mths -0.024 0.100 0.814
Unemployed 1-2 years -0.317 0.105 0.003 -0.320 0.102 0.002
Unemployed 2+ years -0.576 0.087 0.000 -0.584 0.080 0.000
Never worked -0.119 0.090 0.186
Not in labour force -0.310 0.110 0.005 -0.393 0.096 0.000
Programme Effects:
General Training 0.283 0.093 0.002 0.271 0.088 0.002
Specific Training 0.774 0.100 0.000 0.788 0.099 0.000
Direct Employment 0.048 0.105 0.651 0.032 0.104 0.761
Employment Subsidy 0.741 0.097 0.000 0.735 0.096 0.000
N of cases 1971.000 1971.000
-2 Log Likelihood 2277.820 2283.180
Chi2 454.660 449.1
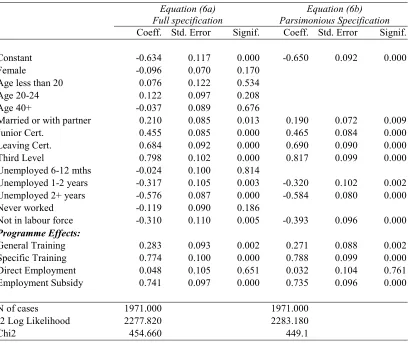
Table 8 shows two equations, Equation (6a) is the fully specified Probit model of employment chances; Equation (6b), the parsimonious model with non-significant control variables removed. Equation (6a) is a Probit version of the Logistic equation (1), reported in Table 3. We have moved to a Probit model to facilitate estimation of the Heckman correction procedure, so the scale of the coefficients change. However, the pattern and size of effects in Equation (6a) is virtually identical to that in Equation (1), with three types of programme having positive and significant effects on employment chances two years later: General Training, Specific Skills Training, and Employment Subsidies. As in Equation (1) the effects of the latter two programmes are substantially greater than that of General Training. Equation (6b) represents the parsimonious model, with non-significant control variables removed. The pattern of effects is identical to those in Equation (6a), and the size of coefficients is maintained.
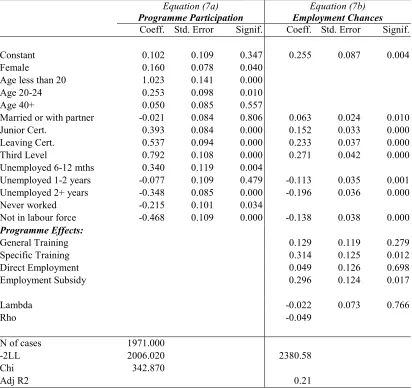
age and unemployment duration. The probability of programme participation increases with education, and those who had never worked or who were outside of the labour force immediately prior to the target period in 1994 were less likely to participate in programmes. These results are plausible and consistent with the broad thrust of what is known about participation in active labour market programmes in Ireland (see, for example, O’Connell and McGinnity, 1997). Equation (7b) is the outcome equation, directly comparable with the parsimonious Probit model of employment chances (Equation (6b). The corrected estimates confirm the positive and significant effects of the two market-oriented programmes, Specific Training and Employment Subsidies. The effect of General Training, which had a weak negative effect in the uncorrected models, was reduced to non-significance in Equation (7b).
Table 9
Probit Selection Correction Model of Employment Chances
Equation (7a)
Programme Participation Employment ChancesEquation (7b) Coeff. Std. Error Signif. Coeff. Std. Error Signif.
Constant 0.102 0.109 0.347 0.255 0.087 0.004
Female 0.160 0.078 0.040
Age less than 20 1.023 0.141 0.000
Age 20-24 0.253 0.098 0.010
Age 40+ 0.050 0.085 0.557
Married or with partner -0.021 0.084 0.806 0.063 0.024 0.010
Junior Cert. 0.393 0.084 0.000 0.152 0.033 0.000
Leaving Cert. 0.537 0.094 0.000 0.233 0.037 0.000
Third Level 0.792 0.108 0.000 0.271 0.042 0.000
Unemployed 6-12 mths 0.340 0.119 0.004
Unemployed 1-2 years -0.077 0.109 0.479 -0.113 0.035 0.001
Unemployed 2+ years -0.348 0.085 0.000 -0.196 0.036 0.000
Never worked -0.215 0.101 0.034
Not in labour force -0.468 0.109 0.000 -0.138 0.038 0.000
Programme Effects:
General Training 0.129 0.119 0.279
Specific Training 0.314 0.125 0.012
Direct Employment 0.049 0.126 0.698
Employment Subsidy 0.296 0.124 0.017
Lambda -0.022 0.073 0.766
Rho -0.049
N of cases 1971.000
-2LL 2006.020 2380.58
Chi 342.870
Adj R2 0.21
unobserved factor such as motivation is believed to positively influence both programme participation and employment outcomes, then failure to specify motivation in the outcome equation would lead to upwardly-biased estimates of the true effects of programmes, and correcting for selection bias would reduce coefficient values. This expectation is confirmed by the results of Equation (7b): converting the programme effects implied by Equation (7b) into employment probabilities reduces the net effects of programmes to about than half the estimated net employment effects of programmes reported in Table 3. Thus for example, while the unadjusted model (Equation (1)) would suggest that participation in Specific Skills Training increased employment chances by 28 percentage points, the corrected estimates suggest a net effect of only 14 percentage points – a reduction of 50% in net effectiveness.7 Some of the reduction in net effects derives from the increased employment probability of the comparison group, represented in the intercept term, suggesting, plausibly, that the apparent positive effects in the unadjusted models partly due to selection effects.
Given the statistical problems associated with the procedure for correcting for possible selection, leading to potential instability in the estimated model parameters, the resulting coefficients should be treated with some caution. The weight of the evidence does, however, suggest that the estimated net programme effects, reported for example in Table 4, overstate the true effects by a substantial margin.
5.
Estimating Wage Effects of Programmes
This section analyses wage effects of programmes two years after participants had left their programmes, or two years after the original identification of the comparison group in the case of non-participants. The FAS Follow-up Survey collected information on weekly earnings and on whether the current job was full- or part-time. Unfortunately, no information was collected on working time, with the result that it is necessary to confine the analysis to full-timers - since we have no information about hours of work, we cannot estimate hourly wages, with the result that we have no comparable basis upon which to include part-timers in the analysis. About 750 individuals were at work full-time two years post-programme, and of these, 720 answered the income question.
Table 10 shows descriptive statistics on wages of full-timers for non-participants, and by programme for the participant group. On average, participants earned about 10% more per week (about £186) then non-participants (£171). There was also some variation between programmes, from a low of £156 in the case of participants in
7 Converting the coefficient for the intercept and binary SST variables into a net change in probability
General Training to a high of about £200 among particpants in Direct Employment Schemes and Employment Subsidies.
Table 10
Mean Weekly Wages of Those at Work Full-time in 1996 by Programme
Mean Standard Deviation
Valid N
IR£ IR£
General Training 155.98 72.56 141
Specific Training 195.09 74.18 205 Community Employment 200.18 100.27 60 Employment Subsidy 198.77 111.35 150
All Participants 186.71 89.85 556
[image:25.595.117.483.393.695.2]Non-participants 170.60 80.21 165
Table 11
OLS Model of Wages Among Those At Work Full-time 2 Years Post Programme
Equation 8 Coefficient Std. Error T-value Significance
Constant 5.081 0.073 69.174 0.000
General Training 0.022 0.057 0.389 0.697
Specific Skills Training 0.140 0.053 2.660 0.008
Direct Employment 0.105 0.071 1.489 0.137
Employment Subsidy 0.044 0.054 0.807 0.420
Female -0.268 0.038 -6.979 0.000
Age < 19 -0.203 0.069 -2.948 0.003
Age 20-24 -0.072 0.054 -1.331 0.184
Age 40+ 0.044 0.057 0.779 0.436
Married or with partner 0.074 0.050 1.478 0.140
Junior Cert. 0.056 0.059 0.962 0.337
Leaving Cert. 0.150 0.060 2.511 0.012
Third Level 0.265 0.063 4.229 0.000
Unemployed 6-12 months 0.099 0.056 1.773 0.077
Unemployed 1-2 years 0.079 0.062 1.265 0.206
Unemployed 2+ years -0.092 0.057 -1.603 0.109
Never worked -0.056 0.051 -1.094 0.275
Not in Labour Force (prior) -0.308 0.072 -4.258 0.000
N of Cases 720
Adjusted R2 .19
outliers, as is conventional. The independent variables are identical those specified in the employment equations above.
The results of Equation (8) suggest that the effects of programmes on wages two years after leaving a programme are quite limited. One training programme, Specific Skills Training has a positive and significant effect, increasing wages by about 14% above the comparison group. None of the other programmes had any discernible impact of wages, compared to the non-participant, when individual characteristics and previous labour market experience are controlled for. It should, of course, be noted that this analysis of the wage effects of programmes is confined to those who were at work (full-time) in 1996.
In other respects the model is statistically well-behaved, plausible and consistent with well-established labour market patterns. Women are paid less than men, young people are paid less than older people, those with higher educational qualifications have higher earnings, and those who were unemployed for a long duration prior to programme participation earned less than those with shorter durations.
In order to test for selection bias in the estimated wage effects, a Heckman-type correction procedure, similar to that adopted for the employment outcome models, was attempted for the wage model. However, data constraints rendered the identification of a satisfactory participation model impossible, leading to highly unstable and implausible model parameters in the outcome equation, and the results are not formally reported here. However, correction for selection bias is unlikely to alter the general conclusion that programme participation has quite limited effects on the wages of those who find jobs.
5.
Conclusions
over the following two years. Econometric techniques are employed to assess the net impact of programme participation while controlling for a range of factors, such as age, gender, education and previous labour market experience, which are believed to influence labour market outcomes.
In other work (O’Connell and McGinnity, 1997) I have argued that programmes with strong linkages to the labour market are more likely to enhance the employment prospects of their participants than programmes with weaker linkages. While the empirical application of that approach was confined to young people in the earlier work, the present study allows us to test the hypothesis that the market orientation of programmes influences outcomes for the entire adult population. The strongest conclusions of the study relate to the impact of programmes on subsequent employment chances and the findings provide additional support for the superiority of market oriented programmes. The effects of the two programmes with strong linkages to the labour market – Specific Skills Training and Employment Subsidies – are consistently positive and effective. General Training has a weak positive effect among certain target groups. Community Employment, the only Direct Employment Scheme analysed in this study, has no discernible impact on subsequent employment prospects. The lack of an effect of Community Employment is of particular concern, both because of the large numbers participating in the scheme and because most participants in the scheme are severely disadvantaged in the labour market and less likely to find work without effective assistance from the State.
The study also looks at differences in programme effects across different population sub-groups. In general, the long-term unemployed benefit more than the ‘short-term’ unemployed (unemployed for less than 1 year) from programme participation. . Moreover, the size of effects was generally greater among the long- then the short-term unemployed. This finding is consistent with the general proposition that targeting the ‘hard to place’ can yield greater net effects, all other relevant factors controlled for.
The analysis shows very similar effects for men and women, although the employment effect of Employment Subsidies is greater for men, and General Training is effective only for women.
Those aged over 25 years benefit more from programme participation than younger people, although the younger group enjoy higher baseline employment chances i.e. their probability of employment if they do not participate in any programme. The analysis indicates, moreover, that the size of effects, tends to be higher in the case of the older group.
may overstate the true employment effects by a substantial margin. However, given the statistical uncertainties entailed in procedures to correct for selection effects, the precise scale of the discount must be interpreted with some caution.
These findings on the relative effectiveness of programmes must be interpreted with some caution. In particular, the finding that several programmes have no discernible impact on subsequent employment chances should not necessarily be interpreted to suggest they are of no value and should be discontinued. For many of the disadvantaged unemployed their educational qualifications or skills may be so inadequate that participation in, for example, the Community Employment programme may offer the only hope of eventual re-integration into the labour market. The findings do suggest, however, that participation in such programmes is in itself unlikely to significantly improve the job prospects of participants unless it is followed by progression to schemes which do improve employment prospects. This suggests the need for reintegration paths designed to allow the long-term unemployed and socially excluded to progress through a series of programmes tailored to their particular needs. Such reintegration paths might begin with programmes characterised by low employment effects, but if they are to be effective, must end in a training or employment programme with high net placement rates.
The analysis suggests that the effects of programme participation on the wages of those at work two years later are quite limited. The analysis is confined to weekly wages of full-time workers because of data limitations on hours worked by part-timers. It should be noted that the analysis is contingent on job acquisition, and thus compares only those who have been successful in achieving employment. Nevertheless, the findings suggest that the principal impact of effective programmes to increase the employment chances of participants, not to enhance their earnings compared to non-participants who find work.
References
ABT Associates (1993), Longitudinal Study of Training Impacts for the Job Entry and Job Development Programs. Canada: Human Resources Development.
Bassi, L. (1984), ‘Estimating the Effect of Training Programs with Non-random Selection’,
Review of Economics and Statistics, 66, pp. 36-43.
Björklund, A. (1993), ‘The Swedish Experience’, pp. 243-264 in Jensen, K. and Madsen, P.K. (eds.), Measuring Labour Market Measures, Copenhagen: Ministry of Labour. Breen, R. (1996), Regression Models: Censored, Sample-Selected, or Truncated Data,
London:Sage.
Breen, R. (1991), Education, Employment and Training in the Youth Labour Market, ESRI General Research Series No. 152, Dublin: ESRI.
Breen, R. and Halpin, B. (1989), Subsidising Jobs: An Evaluation of the Employment Incentive Scheme, ESRI General Research Series No. 144, Dublin: ESRI.
Calmfors. L. (1994), ‘Active Labour Market Policy and Unemployment - A Framework for the Analysis of Crucial Design Features’, OECD Economic Studies 22, pp. 7-47. Paris: OECD.
Dolton, P., Makepiece, G. and Treble, J. (1994), ‘The Youth Training Scheme and the School-to-Work Transition’, Oxford Economic Papers, Vol. 46, pp. 629-657.
Fay, R. (1996), Enhancing the Effectiveness of Active Labour Market Policies: Evidence from Programme Evaluations in OECD Countries, Paris: OECD.
Friedlander, D., Greenberg, D., and Robins, P, 1997, Evaluating Government Training Programmes for the Economically Disadvantaged.” Journal oif Economic Literature,
Vol. XXXV, Pp. 1809-1855.
Haveman, R. and Hollister, R. (1991), ‘Direct Job Creation: Economic Evaluation and Lessons for the U.S.A. and Western Europe’, pp. 5-100 in Björklund, A., Haveman, R., Hollister, R., and Holmlund, B. (eds.), Labour Market Policy and Unemployment Insurance, Oxford: Clarendon Press.
Heckman, J. and Robb, R. (1986), ‘Alternative Identifying Assumptions in Econometric Models of Selection Bias’, Advances in Econometrics, Vol. 5. pp. 243-287.
Heckman, J. and Smith, J. (1996), ‘Experimental and Nonexperimental Evaluation’, pp. 37-88 in Schmid, G., O’Reilly, J. and Schömann, K. (eds.), International Handbook of Labour Market Policy Evaluation, Cheltenham, UK: Edward Elgar.
LaLonde, R., 1995, “The Promise of Public Sector-Sponsored Training Programmes.”
Journal of Economic Perspectives, Vol. 9, No. 2, Pp. 149-168.
Main, B. and Shelley, M. (1990), ‘The Effectiveness of the Youth Training Scheme as a Manpower Policy’, Economica, Vol. 57, pp. 495-514.
OECD (1996), Employment Outlook, July, Paris: OECD.
OECD (1994), The OECD Jobs Study: Part II: The Adjustment Potential of the Labour Market, Paris: OECD
OECD (1993), ‘Active Labour Market Policies: Assessing Macroeconomic and Microeconomic Effects’, Employment Outlook, July, Paris: OECD.
OECD (1991), Evaluating Labour Market and Social Programmes: The State of a Complex Art, Paris: OECD.
O’Connell, P.J., 1999, “Sick Man or Tigress: The Labour Market in the Republic of Ireland.” in R. Breen, A. Heath and C. Whelan (eds.) Ireland, North and South. Oxford: The British Academy and Oxford University Press.
O’Connell, P.J. and McGinnity, F. (1997a) Working Schemes? Active Labour Market Policy in Ireland. Aldershot: Ashgate
O’Connell, P.J., and McGinnity, F. (1997b), “What Works, Who Works? The Employment and Earnings Effects of Active Labour Market Programmes among Young People in Ireland.” Work Employment and Society, Vol. 11, No. 4.
O’Connell, P.J., and McGinnity, F. (forthcoming,1999), “Active Labour Market Policies, Market Orientation, and Gender”, in P. O’Connell and K. Schömann (eds.), Training Transitions: Training Investments as a Means of Durable Social Integration. London:Edward Elgar
Payne, J., Lissenburgh, S., White, M. and Payne, C. (1996), Employment Training and Employment Action: An Evaluation by the Matched Comparison Method, Department for Education and Employment Research Series No. 74, Sheffield: Department for Education and Employment.
Raaum, O., Torp, H. and Goldstein, H. (1995), Employment Effects of Labour Market
Training in Norway, Memorandum No. 8, Oslo: Department of Economics,
University of Oslo.
Watson, D. (1996) ‘1996 Follow-Up of Participants in FAS Courses or Schemes: Technical Notes and Tabular Analysis of Data.’ Report to FAS. Dublin: ESRI.