ESRI working papers represent un-refereed work-in-progress by researchers who are solely responsible for the content and any views expressed therein. Any comments on these papers will be welcome and should be sent to
the author(s) by email. Papers may be downloaded for personal use only.
The Impact of Free GP Care on the Utilisation of GP Services in
Ireland: An Evaluation of Different Approaches
Paul K Gorecki
1Abstract: The successful implementation of free GP care for all private patients in Ireland requires an estimate of the likely change in the number of GP visits occasioned by this policy so as: (i) to set the capitation fee; and (ii) to ensure adequate supply of GPs is in place. The paper examines two methodologies to derive such estimates: retrospective patient self-reporting or recall (e.g. Growing Up in Ireland, The Irish Longitudinal Study on Ageing); and, GP practice records. Estimates based on six GP practices by Behan (2013, 2014) substantial overestimate of the likely impact of free GP care. McGovern’s (2015) more recent estimates for the HSE, based on patient recall, used in forecasting future demand for GPs to 2025 also appear to be biased upward. The underlying studies, assumptions and papers are not, however, cited. This should be corrected. A proper debate and discussion can then take place concerning the optimal phasing in of free GP care.
Corresponding Author: [email protected]
1. Research Affiliate, ESRI & Adjunct Lecturer, Department of Economics, Trinity College Dublin. Keyword(s): GP visits; Medical Card, GP Visit Card; Free GP Care; under 6s.
JEL Codes: H51; I12; I18.
Acknowledgements: Richard Layte and Anne Nolan provided GUI and TIDA data, made available their unpublished research and answered numerous queries. Together with Tim Callan, Kevin Denny and attendees at the Health Economics Association of Ireland meeting on 1 February 2016, they also provided helpful advice, comments and suggestions. The HSE kindly provided information on GP and patient enrollment in the GP Visit Card scheme. This paper draws on and builds on earlier work for the HSE including an affidavit prepared for the HSE in a 2015 High Court case, Yvonne Williams vs. Health Service Executive. The usual disclaimer applies.
Working Paper No. 534
1 | P a g e
INTRODUCTION
The Government has indicated its intention to provide, on a phased basis, free GP care for all, irrespective of income.1 The first group eligible for free GP care, from 1 July 2015, are those aged under
6 years of age, the second, from 5 August 2015, those over 70 years of age, and the third, from 2016, those between 6 and 11 years of age.2 In 2016 General Election, while the Labour Party (2016, p. 66)
promised to roll out free GP care for all by 2021, other political parties envisage a more gradual extension of free GP care.3 It was the latter approach that was incorporated into the subsequent
Programme for Partnership Government: “[E]xtending in phases, and subject to negotiation with GPs, we are committed to the introduction of free GP care to under 18s” (Government of Ireland, 2016, p. 55).
Prior to the gradual introduction of free GP care starting in July 2015, eligibility for free GP care was restricted to those qualifying for a means tested Medical Card or a GP Visit Card.4 In May 2015, 41.0 per
cent of the population were in receipt of free means tested GP care.5
Private patients (i.e., those without a means tested Medical or GP Visit Card) were charged, based on data for 2010-2015, an estimated €50 per GP visit, although there appears to be some variation.6,7 The
1 Initially free GP care was to be extended to those on the long term illness scheme (Government of Ireland, 2012, p. 25) or with a prescribed long term illness (Government of Ireland, 2013, p. 28). However, this approach to phasing in free GP care for all was changed to the current approach of rolling out free GP care by age, starting with the under 6s (Government of Ireland, 2014a, p. 36), followed by over 70s (Government of Ireland, 2015, p. 16). The change in approach was “because of legislative difficulties” (Nolan et al, 2014a, p. 15).
2 Department of Health (2015a) and HSE (2015c, p. 6, 51, 54). Free GP care for those 6 to 11 is subject to negotiation between the Department of Health/HSE and the Irish Medical Organisation (IMO), a GP representative body.
3 Fianna Fail (2016, p. 58) state that they will undertake a review of the impact of the extension of free GP care to the under 6s and “[N]egotiate a new GP contract following which we will then bring forward plans for the expansion of GP care.” Fine Gael (2016, p. 58) undertake to provide free GP care for all those under 18 years of age by 2019, subject to negotiation with GPs. Sinn Fein (2016, p. 44) intend to “[B]egin move to fully free healthcare” by providing “free GP care at a rate of almost a quarter of a million people each year,” starting with those on lower incomes (ibid, p. 12).
4 The GP Visit Card, introduced in November 2005, entitles the holder to free GP visits, while the Medical Card, introduced in 1972, entitles the holder to a greater range of health benefits (e.g. free prescriptions subject to a small co-payment charge up a maximum per month). Further details may be found of the Health Service Executive website (ww.hse.ie).
5 HSE (2015a, p. 8), for the number of persons on a Medical Card (1,733,639) or a GP Visit Card (167,087) in May 2015; CSO (2015b) for the population for the year ending in May 2015 (4,635,400).
6 The NCA (2010, pp. 9–12) conducted a survey in March 2010 of the cost of a routine GP consultation/examination and found that this was €51 per visit. Doctors' fees, as measured by the CSO, remained essentially unchanged between March 2010 and May 2015. (Between March 2010 and December 2011, Doctors’ fees declined by 0.6 per cent with 2006=100 (CSO, 2011b, Table 6, p. 8); between December 2011 and May 2015, Doctors’ fees increased by 0.4 per cent with December 2011=100 (CSO, 2015a, Table 9)). Although the average GP visit was €51, the NCA found considerable variance around this figure, from €35 to €70. This is consistent with an earlier survey conducted by the Competition Authority (2010, p. 10) for October 2008 which reported a range of €45–60. See also Brick et al (2010, Vol. II, p. 486).
2 | P a g e
abolition of this fee for private patients under 11 or over 70 is thus likely to lead to an increase in demand for GP services.
Accurate estimation of the increase has important implications for: the setting of capitation fees by the State, which are likely to reflect anticipated demand for GP services by former private patients under 11 or over 70 in receipt of free GP care;8 and the quality of GP care, which is liable to be inversely related to
the ratio of demand to available resources. In other words, the greater the increase in demand for GP services due to the provision of free GP care, other things equal, the lower the capacity to deliver the same level of care.9
Two main issues are examined in this paper. First, a comparison of alternative methodologies for estimating GP visit rates and their determinants for public and private patients in the absence of national registration and associated administrative data. Second, to examine the increase in demand for GP services as a result of the extension of free GP care. Particular regard is paid to: (i) Behan et al (2013, 2014), which has gained widespread attention and currency; McGovern’s (2015) forecasting of demand for GPs to 2025, based in part in the likely impact of free GP care for all; and, a series of papers by authors at the Economic and Social Research Institute (ESRI) and University College Dublin (UCD).
Section II describes the different methodologies and data sources: three national representative patient retrospective self-reporting surveys and six GP practice administrative records. Section III presents GP visit rates by various public and private patient categories across the different data sources. Section IV considers the determinants of variations on the demand for GP visits by public and private patient categories drawing on patient retrospective self-reporting surveys. Finally, Section V considers the impact of providing free GP care, using as its starting point the estimates of Behan et al (2013, 2014) and subsequently McGovern (2105).
II RETROSPECTIVE PATIENT SELF-REPORTING SURVEYS & SIX GP PRACTICE ADMINISTRATIVE RECORDS
2.1 Introduction
Two different methodologies have been employed in Ireland to measure GP visits:
• Retrospective self-reporting of GP visits by patients has been employed in three large-scale recent surveys in Ireland.10,11 Two of these national surveys are concerned with particular age
8 For a discussion of capitation fees see Brick et al (2010, Vol. 1, pp. 184-190). Under the General Medical Scheme or GMS, of which the Medical Card is part, approximately 50 per cent of a GPs remuneration is from capitation payments, the rest is from out-of-hours service, allowances, and other fees.
9 The Irish College of General Practitioners (ICGP, 2015, p. 1), which is the body responsible for education, training and standard in general practice, stated in response to the publication of the GP contract for the provision of free GP care for the under 6s, that “general practitioners are stretched to capacity at present and any increase [in demand], however small, will have an impact on access to general practitioners for everyone.”
3 | P a g e
groups: Growing up in Ireland (GUI), infants and younger persons; and, The Irish Longitudinal Study on Ageing (TILDA), those aged 50 years and older. The third national survey, the Central Statistics Office’s (CSO) Quarterly National Household Survey (QNHS), covers a much wider age group – those over 15 years of age, although it only reports GP visit rates for those 18 years of age and over.12,13 In each case the recording of GP visits is part of a wider data collection
exercise that enables insights to be obtained into the determinants of GP visits and the impact of free GP care. GUI is particularly relevant to the under 6s; TILDA to the over 70s.
• The administrative records of six GP practice in two papers by Behan et al (2013, 2014).
The methodology of each source is described, including the definition of a GP visit, with a comparison between the two methodologies completing the discussion.
2.2 Growing Up In Ireland (GUI)
Growing Up in Ireland,
… is a national study of children. It is the most significant of its kind ever to take place in this country and will help us to improve our understanding of all aspects of children and their development.
The study is following the development of two groups of children first visited in 2007/2008. The first wave of the project collected data on 11,000 children aged nine months and their parents (the Infant Cohort) and 8,500 children aged nine years (the Child Cohort), their parents, teachers and carers. We have carried out three rounds of research with the Infant Cohort (at 9 months, 3 years and 5 years) and two rounds of research with the Child Cohort (at 9 years and 13 years).
11 The Irish Health Survey (IHS), a new household survey covering 5,000 persons over 16 years of age, was conducted by the CSO between October 2014 and December 2015. The IHS contains a question on when the respondent last visited a GP and how many times did the respondent consult a GP in the last four weeks. The IHS is part of a wider European Health Interview Survey. For details see http://www.cso.ie/en/surveysandmethodology/health/irishhealthsurveyihs/. Accessed 26 April 2016.
12 There have been a number of special modules of the QNHS addressing the issue of GP visits. The paper draws on the most recent special module in Quarter 3, 2010, ‘Health Status and Health Service Utilisation.’ The earlier special module related to 2001 and recorded only whether or not the person surveyed had visited a GP in the previous two weeks. For details see Nolan and Nolan (2007, p.36, 59-60).
4 | P a g e
The main aim of the study is to paint a full picture of children in Ireland and how they are developing in the current social, economic and cultural environment. This information will be used to assist in policy formation and in the provision of services which will ensure all children will have the best possible start in life.14
GUI fieldwork is part of the Irish National Statistical System and is covered by the Statistics Act (1993). It is undertaken by the ESRI and Trinity College Dublin (TCD). The oversight governance involves international and national experts, the Central Statistics Office and senior representatives of the relevant government departments (Children and Youth Affairs, Social Protection and Education).15
The question that GUI asks the primary caregiver in the Infant Cohort at three years of age in order to ascertain the number of GP visits was:
C8. In the past 12 months, how many times have you seen or talked on the telephone
with any of the following about <child’s> physical or emotional health? [INT: IF NONE
THEN ENTER 0 – DO NOT LEAVE BLANK]
a) A general practitioner (GP)... ____ N b) A paediatrician / consultant / hospital doctor... ______ N c) A public health nurse... ______ N d) A practice nurse (i.e. a nurse in a GP’s surgery/clinic). ______ N e) A psychiatrist/psychologist ... ______ N f) Accident and Emergency ... ______ N g) A social worker ... ______ N 16
where INT refers to interviewer. The same question was asked for the Infant Cohort at nine months, except the retrospective period was since the baby was born, which would have been about nine months, rather than twelve months. A GP visit is defined as either physical meeting with the GP or contact via the phone about the child’s physical or mental health. Since the place of the physical meeting is not specified it could be either in the infant’s residence or in the GP’s surgery.
In the presentation of results attention is focused on the Infant Cohort at nine months, three and five years. The Infant Cohort at aged nine months was surveyed between September 2008 and April 2009; at three years between December 2010 and June 2011; and, at five years between March and August 2013. At nine months there were 11,100 cases; at three years; slightly below 10,000 cases; and, at five years 8,700 cases. The Infant Cohort at nine months was adjusted so that it was representative of the population, while the Infant Cohort at three years was “based on the combination of the … [Infant
14http://www.growingup.ie/index.php?id=9. Accessed 26 April 2016.
15 The panel of 45 experts is drawn from academic and research institutions in Ireland, Britain and Sweden. See http://www.growingup.ie/index.php?id=10. Accessed 26 April 2016.
5 | P a g e
Cohort at nine months] and the adjustments to account for socially determined inter-wave [i.e. between the Infant Cohort at nine months and three years] attrition and migration outside the country.”17
2.3 The Irish Longitudinal Study on Ageing (TILDA)
The Irish Longitudinal Study on Ageing or TILDA is funded by the Department of Health, The Atlantic Philanthropies and Irish Life. It is
… a large-scale, nationally representative, longitudinal study on ageing in Ireland, the overarching aim of which is to make Ireland the best place in the world to grow old.
TILDA collects information on all aspects of health, economic and social circumstances from people aged 50 and over in a series of data collection waves once every two years. TILDA is unique amongst longitudinal studies in the breadth of physical, mental health and cognitive measures collected. This data, together with the extensive social and economic data, makes TILDA one of the most comprehensive research studies of its kind both in Europe and internationally.18
TILDA’s sample size was 8,504 respondents, of whom 8,173 were over 50 years of age. There have been two waves of the survey, which involves administering questionnaires and conducting health assessments: October 2009-February 2011; and April 2012-January 2013.19 The third wave commenced
in 2014, while wave 4 is due to take place in 2016. Longitudinal studies on ageing are also being conducted in, Australia, Brazil, Canada, China, England, India, Japan, Korea, Mexico and the US.20
The question that TILDA (2010, p. 86) asks to ascertain the frequency with which the patient visits the GP is:
HU005: In the last 12 months, about how often did you visit your GP?
IWER: IF RESPONDENT HAS NOT VISITED GP IN THE LAST 12 MONTHS CODE 0
where IWER refers to the interviewer. A GP visit is defined as a visit by the patient to the GP’s surgery. This question involves a somewhat narrower definition than that used in GUI, which includes telephone conversations and visits by the GP to the patient’s home. Like GUI the self-reported retrospective reporting period is a year.
17 Williams et al (2013, p. 21).
18http://tilda.tcd.ie/. Accessed 26 April 2016. 19 Hudson and Nolan (2015, p. 28).
6 | P a g e
In the presentation of results attention is focused on the first wave of TILDA, given the similarity of the results across the first waves.21 The weighted frequencies are presented.22 When cell size is less than 30
observations the results are not presented.
2.4 The Quarterly National Household Survey (QNHS)
The Quarterly National Household Survey (QNHS) is,
… is a large-scale, nationwide survey of households in Ireland. It is designed to produce quarterly labour force estimates that include the official measure of employment and unemployment in the state (ILO basis). The survey began in September 1997, replacing the annual April Labour Force Survey (LFS). The QNHS also conducts special modules on different social topics each quarter.
A fieldforce comprising 10 field co-ordinators and 100 field interviewers interview 26,000 households each quarter. Information is collected on laptop computers using computer-assisted personal interview (CAPI) software. The survey meets the requirements of Council Regulation (EC) No. 577/98 … adopted in March 1998, which requires the introduction of quarterly labour force surveys in EU member states.23
One of the special modules was in Quarter 3, 2010, ‘Health Status and Health Service Utilisation.’24
The question that CSO asked to ascertain the frequency with which the patient visits the GP is:25
“During the past 12 months, how many times have you consulted with a GP (General Practitioner)?
Note: Consultation with a GP should be on a respondent’s own behalf only, and may take place in GP surgery, at patient’s home or by telephone (in cases where the phone call leads to the decision to attend the actual GP surgery, then only one visit should be counted). Respondent should count all consultations even if they are repeat visits for the same condition. One exclusion exists whereby phone calls for test results should not be counted as a consultation.”
21 See Nolan et al (2014b). This is not to deny that changes have taken place, but rather the variables of interest for the purposes of this paper have not undergone dramatic changes.
22 The weights are discussed in Dooley (2014, pp. 193-194).
23http://www.cso.ie/en/qnhs/abouttheqnhs/whatistheqnhs/. Accessed 26 April 2016. 24 CSO (2011a).
7 | P a g e
As with GUI and TILDA the retrospective self-reporting is for a period of 12 months, with QNHS appearing to have the same definition of a GP visit as GUI and a somewhat wider definition than that implied in TILDA. The terminology is different from that in the GUI and TILDA surveys. Instead of GP visit it is a consultation, but defined in a manner consistent with GUI in that includes consultations with the GP in the patients home and telephone contact. Households participate in the QNHS for five consecutive quarters before being replaced, so that so that every quarter 80 per cent of the sample overlaps with the previous QHNS survey and 20 per cent are new.26 The QNHS reports GP visit rates for
those 18 years of age and over.
2.5 Six GP Practice Administrative Records
The use of administrative GP records to measure the frequency of patient GP visits (or consultations) has not been used extensively in Ireland apart from in two papers by Behan et al (2013, 2014), based on administrative data from six GP practices. The study population is 27,080, of whom 20,706 were aged 18 years or older and 1,931 children were aged less than six years. The sample used was comparable of the national population in terms of age and Medical Card status.27 The GP practices vary in size from 2.25 to
4 GPs, with 0.5 to 4 nurses and 1.25 to 4.5 administrators. Data concerning GP consultations are extracted from the administrative records of the GP practices, although in the case of out of hours consultations and telephone conversations, only one practice maintained records; in the analysis these were extrapolated to the other five practices.
Behan et al (2013, p. 297) set out their definition of GP consultation as follows:
We adopted the same definition of consultation as that used by the ‘QRESEARCH’ audit of clinical consultations in the UK and the CSO QNHS, i.e. ‘direct contact between a clinician and patient either in the surgery, in the patients’ house or on the telephone’. Telephone contacts involving discussion of results, request for notes or a prescription were not considered as consultations. Clinic contacts at all six participating practices registered for inclusion as a consultation when a patient appointment coincided with a consultation note in the same patient’s record on the same day. Estimates of out of hours contacts and telephone consultations were based on records maintained at one practice and this figure was extrapolated to all six practices.
The definition of a GP consultation is, as the authors’ note, the same as that used in the QNHS. It is also the same as that used by GUI for a GP visit and somewhat broader than that used in TILDA (which does not explicitly include telephone and home visit GP/patient interactions). Again GP consultations are measured over 12 months (23 October 2012 to 22 October 2013, for those over 18 years of age; and, 1 January 2013 to 31 December 2013 for those under 6 years of age).
26 CSO (2015c, p. 8).
8 | P a g e
2.6 A Comparison of Two Methodologies
2.6.1 Introduction
There are a number of criteria that can be used to compare the three retrospective self-reporting surveys with the six GP practice records as the basis for deriving GP visit rates. In some instances, such as the definition of a GP visit, there is little difference across the four data sources, while in other instances there are important differences. We concentrate on the latter.
2.6.2 Sample Selection and Size
GUI, TILDA and QNHS all have carefully designed and methodologically valid sample selection procedures, reviewed by international experts and, in the case of the QNHS, to the standards set by Eurostat. In contrast, the administrative records of six GP practices were not validated or reviewed independently by third parties. In some instances (i.e., telephone/domiciliary consultations) information was derived from just one of the six GP practices. The six GP practices were non-randomly selected and represent a small proportion of all GP practices – six out of 2,093 or less than half a percentage point.28
2.6.3 Faulty Memory?
Retrospective self-reporting surveys such as GUI, QHNS and TILDA require the respondent to be able to accurately recall the frequency with which they visited or consulted a GP over a defined period of time. In the analysis reported in this paper a year has been used. However, shorter periods have been used by the QNHS (two weeks in 2001)29 and currently by the Irish Health Survey and Healthy Ireland (four
weeks).30
Not surprisingly there has been some questioning as to the reliability of estimates of GP visit rates based on patient recall. Memories can be faulty and imperfect. Recall may result in backward (“respondents may recall an event but report that it happened earlier than it actually did”) and forward (“report that it happened more recently”) telescoping.31 Bias may be related to factors such as age, education and so
on.
Ideally to resolve the issue of whether or not retrospective self-reporting or the use of administrative records yields similar answers requires a study that uses both methodologies on the same population. In other words, a random sample of the population is selected and asked about the frequency of GP visits over the past year using one of the GUI, TILDA or QNHS questions set out above. The researcher would then use the records of GP practices or insurance providers in the catchment areas in which the patients are located, checking, of course, the accuracy and reliability of these administrative records. The results of the two approaches would then be compared to determine the bias, if any, of retrospective self-reported GP visit rates.
28 The number of GP practices is based on HSE, personnel communication, 19 March 2014. 29 See footnote 12 for details.
9 | P a g e
There have been a small number of studies, mostly US, which have undertaken such an exercise. In relying on these studies for guidance with respect to any possible bias in GUI, TILDA and QNHS attention needs to be paid to: the data collection methodology (e.g. face to face interview, self completed questionnaire); the definition of a GP (or physician) visit; the recall period; the reliability of the administrative data source; and the sample selection procedure. However, not all of the published studies provide such information.
Cleary and Jette (1984) compared administrative physician records with self-reported physician visiting for a population of 1,026 persons over the age of 18 from an area of approximately 1,300 square miles in a mid west region of the US. The recall period was a year. Face to face interviews were used to gather data. Cleary and Jette (1984, pp. 801-802) concluded that:
Contrary to many other studies, the average error in the self-report of physician utilization behavior in this adult population was very small. The average difference between reported and actual physician utilization was only 0.05 visits. This small magnitude of error is even more surprising since the recall period was the entire previous year. This suggests that it is possible to generate accurate aggregate, self-report utilization data provided certain precautions are taken. Interviewers must make every effort to reduce error by using detailed probes and providing memory aids.
However, Cleary and Jette (1984, p. 799) report that persons with a high number of physician visits, having a number of chronic conditions and/or being older tend to underreport usage as compared with administrative records.
Roberts et al (1996) compared ambulatory physician visits using an extensive self completed questionnaire with community medical records for 500 men aged 40 to 79 that participated in the Olmsted County Study of Urinary Symptoms and Health Status among Men in Minnesota. The recall periods were two weeks and a year. Roberts et al (1996, pp. 991-92) concluded that:
This study shows that self-reported health care utilization was most accurate and reliable for … ambulatory physician visits in the 2 weeks preceding the study, but less accurate and reliable for ambulatory physician visits over a 1-year duration. The difference between self-reported and medical record number of visits increased with increased utilization, with a bias towards underreporting of ambulatory physician visits as the number of visits increased.
The average difference between self-reported and community records for a one year recall period was -0.9 visits (ibid, p. 991). The definition of a physician visit appears to be wider than that used in GUI, TILDA, QNHS and the six GP practices, since it appears to include “emergency room visits” (ibid, p. 993). The authors speculate that a possible reason for the underreporting of physician visits by patients is that they did not consider these as physician visits.
10 | P a g e
(either heart disease, lung disease, arthritis or stroke), were 40 years of age or older, and had volunteered to take a 7-week chronic disease self-management course” (ibid, p. 137). The recall period was six months, not a year. Patients self-reported 4.27 physician visits, while computerized records from the patients’ Northern Californian Health Maintenance Organization recorded 5.32 visits per patient, a difference of 1.06 visits (ibid, Table 2, p. 139). Underreporting increased with the number of physician visits. The authors comment that although “there is a tendency toward underreporting of physician visits, that tendency does not appear to vary by baseline demographics, health status or exposure to questionnaires” (ibid, p. 140).
Ritter et al (2001, p. 141) appear to use a much wider definition of a physician than that used in GUI, TILDA, QNHS or the six GP practices: “internist, general practitioner, family doctor, cardiologist, pulmonologist, neurologist, surgeon, rheumatologist, allergist, ophtamologist, urologist, gynecologist, dermatologist, etc; other then psychiatrist.” The authors also selected the largest discrepancies in the number of physician visits as between self-reported and computerized records for closer examination. In “over half of the cases we found that the self-report was more accurate than the computerized utilization record, while the other cases remained ambiguous. One patient who reported having no physician visits was listed in the computerized utilization record as having had 19. It was found that she had weekly allergy shots, which were administered by a nurse practitioner but were coded as MD visits in the computerized utilization record” (ibid, p.140).
Dalzeil et al (2015) compare patient self-reported patient for doctor visits over two week, three month and 12 month periods with routine Australian Medicare administrative data. The sample size was over 5,000 patients enrolled in a large Australian study who were pseudo-randomised by the authors “according to day of birth to report visits to a doctor within 2 week, 3 month and 12 month periods. When comparing patient recall to Medicare data accuracy was greatest for 12 month recall (47.8% correlation), compared to 3 month (37.2% correlation) and 2 week (24.5% correlation).”32
Hippisley-Cox & Vinogradova (2009) compare self-reported GP visits based on face to face interviews conducted between April 2004 and March 2005 as part of the General Household Survey (GHS) covering Great Britain, with the GP consultation rate based on the records of 496 GP practices covering 4.3 million registered patients 2008/9 in England (ibid, p. 4). Hence unlike the other studies cited above a common set of individuals was not used for the self-reporting and administrative GP visit rates.
Hippisley-Cox & Vinogradova (2009) compare age-sex specific GP visits from these two sources for six age groups. In contrast to the studies cited above the authors’ find that typically self-reported GP visit rates exceed those from the GP practice records (ibid, Figure 7, p. 20). Furthermore, also in contrast to some of the studies cited above, Hippisley-Cox & Vinogradova (2009, Figure 7, p. 20) find that for those aged 15 and over, the difference between self-reported GP visit rates and those based on GP practice records narrows with age so that for those 75 and over there is little difference, particularly for females. Hippisley-Cox & Vinogradova (2009) only report their findings without commenting as to the reasons for the difference.
11 | P a g e
It should be noted that while both the GHS and the GP practice data refer to a year, in the case of the GHS annual GP consultation rates are approximated based on respondent recall over a two week period i.e. total GP visits for a particular group for a two week recall period were multiplied by 26 and divided by the number of persons in the group to obtain the annual GP visit rate. This is not the same as asking patients to recall GP visits over the previous 12 months, given the findings above concerning possible differences in the accuracy of recall of GP visits and the length of the recall period.
The evidence suggests that self-reported GP visits tend to underreport actual GP visit rates derived from administrative data. There are certain sub populations where the bias might be particularly pronounced such as patients that visit the GP with a high frequency. However, only one study undertook any analysis of those instances where large differences in GP visit rates occurred as between the two approaches. It concluded that self-reported GP visit rates were more reliable in those cases.
There are, however, a number of reasons to argue that the respondents to GUI, QNHS and TILDA are less subject to these recall problems. First, all three surveys, like Cleary & Jette (1984), are conducted on a face to face basis as compared to a telephone or postal survey. This should provide ample opportunity not only for clarification of any questions but also facilitate and encourage the respondent to access any documents that might provide the relevant information. Furthermore, like Cleary & Jette (1984), GUI, TILDA and QNHS the sample was selected on a random basis. Cleary & Jette (1984) also report, on average, quite a low level of underreporting by self-reported GP visits.
Second, participants in GUI and TILDA are involved in the survey on an ongoing basis and hence likely to become familiar with the survey and the issues raised, although this applies much less, if at all, to QNHS where the health model is only included every few years.
Third, in the case of GUI and TILDA there is ongoing contact between participants and the survey, strengthening bonds between GUI/TILDA and participants who, as a result, are more likely to take the exercise seriously, thus noting down some information might be expected to be collected by GUI/TILDA.33
2.6.4 Which Source?
Administrative records and retrospective patient self-reporting are two methods of estimating the number GP visits for patients. In terms of the methodology, sample selection and size the retrospective patient self-reporting of QNHS, GUI and TILDA is to be preferred to the small non-random sample of six GP practices used to extract administrative records by Behan et al (2013, 2014). On the other hand, the records of six GP practice do not suffer from patient recall issues relating to retrospective self-reporting surveys, although they are not, as far as we are aware, audited. Nevertheless, for reasons set out above, we would expect that this tendency is unlikely to be large with respect to QHNS, GUI and TILDA.
12 | P a g e
III QUANTIFYING GP VISITS
3.1 Introduction
The purpose of this section is to quantify the frequency of GP visits by different categories of GP cover using the four sources set out in the previous section. Given the focus of the paper a distinction is made between public and private patients. The former can be divided into those with a Medical Card or a GP Visit Card,34 the latter into those enrolled private health insurance (PHI), with and without GP cover, and
those with No Cover. It is also possible that patients may have both public and private cover. However, the various data sources rarely present GP visit rates for the full range of public and private patient categories by GP cover. In several instances categories are combined to capture the most significant public or private GP cover set of patients.
3.2 GUI: Infant Cohort at Nine Months, Three and Five Years
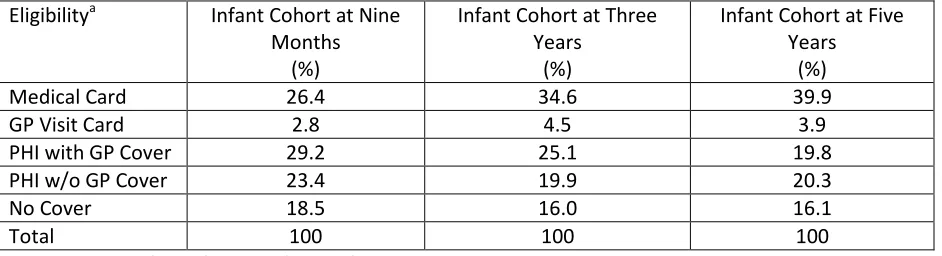
[image:13.612.73.544.444.572.2]The eligibility of patients for coverage of GP fees may be broken down into five mutually exclusive eligibility categories using GUI: Medical Card holders; GP Visit Card holders; PHI with GP cover; PHI w/o GP cover; and No Cover (i.e. those w/o either a Medical/GP Visit Card or PHI). Medical/GP Visit Card includes those with and w/o PHI; in contrast, the two PHI categories include persons with only PHI cover and neither a Medical or GP Visit Card. In the Infant Cohort at nine months 3.6 per cent of GUI patients had a Medical/GP Visit Card and PHI; at three years, 5.4 per cent; at five years 5.7 per cent. Public patients are Medical/GP Visit Card holders, private patients are the other three categories.
Table 1
Eligibility for GP Care, Public & Private Cover, Infant Cohort at Nine Months & Three Years, 2008/9, 2010/11 & 2013, Ireland
Eligibilitya Infant Cohort at Nine
Months (%)
Infant Cohort at Three Years
(%)
Infant Cohort at Five Years
(%)
Medical Card 26.4 34.6 39.9
GP Visit Card 2.8 4.5 3.9
PHI with GP Cover 29.2 25.1 19.8
PHI w/o GP Cover 23.4 19.9 20.3
No Cover 18.5 16.0 16.1
Total 100 100 100
a. See text for definition of these five mutually exclusive eligibility categories. Source: GUI
13 | P a g e
The largest category of GP cover is PHI (with or w/o GP cover), followed by Medical Card holders and No Cover (Table 1).35 These three groups accounted for 97.2 per cent of the Infant Cohort at nine months,
95.5 per cent at three years and 96.1 per cent at five years. If the PHI group is broken down into those with and w/o GP cover, then the number of those with GP cover was larger than those w/o such cover by between 5 to 6 percentage points at nine months and three years, but by five years the difference had narrowed to less than a percentage point. Perhaps, not surprisingly, given that GUI surveyed the Infant Cohort at nine months in 2008/2009, just as the financial crisis was unfolding, and the Infant Cohort at three years in 2010/2011 and five years in 2013, the importance of Medical (and GP Visit) Card holders has increased (29.2 per cent to 43.8 per cent) while PHI has declined from 52.6 per cent to 40.1 per cent.
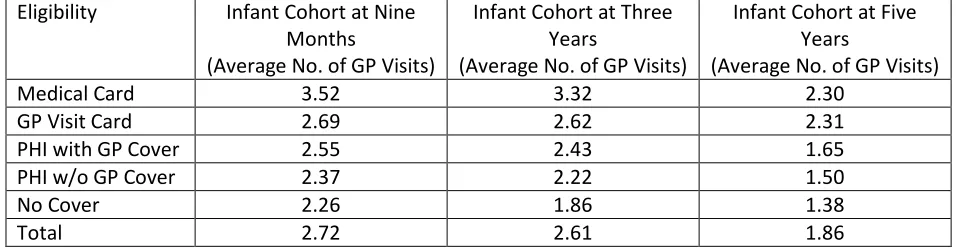
[image:14.612.69.549.464.588.2]The number of GP visits, as presented in Table 2, varies inversely with whether or not the GP visit is paid for in whole by the State (Medical/GP Visit Card) or in part by a third party (PHI with GP cover) or by the patient in full (PHI w/o GP Cover or No Cover). Those on a Medical Card, for example, in the Infant Cohort at aged nine months visit the GP, on average, 3.52 times, at three years 3.32 times, at five years 2.30 times; in contrast, the corresponding GP visiting rates for those with No Cover was 2.26, 1.86, and 1.38, respectively. Hence the upper bound estimate of the increase in GP visits associated with free GP care for private patients, based on Table 2, for the Infant Cohort at nine months would be 56 per cent based on a Medical Card/No Cover comparison and 19 per cent based on a GP Visit Card/No Cover comparison; for the Infant Cohort at three (five) years the corresponding percentages are 78 (67) per cent and 41 (67) per cent, respectively. However, for those moving from PHI to a Medical or GP Visit card the increase is somewhat less.
Table 2
GP Visits, Public & Private Cover, Infant Cohort at Nine Months & Three Years, 2008/09, 2010/11, and 2013 Ireland
Eligibility Infant Cohort at Nine
Months
(Average No. of GP Visits)
Infant Cohort at Three Years
(Average No. of GP Visits)
Infant Cohort at Five Years
(Average No. of GP Visits)
Medical Card 3.52 3.32 2.30
GP Visit Card 2.69 2.62 2.31
PHI with GP Cover 2.55 2.43 1.65
PHI w/o GP Cover 2.37 2.22 1.50
No Cover 2.26 1.86 1.38
Total 2.72 2.61 1.86
Notes: The recall period for the number of GP visits for the Infant Cohort at nine months was nine months; at three and five years, 12 months. See text for definition of the five mutually exclusive eligibility categories.
Source: GUI
Although the emphasis in this paper is on the Infant Cohort, Williams et al (2009, Figure 5.2, p. 67) reports GP visits for the Child Cohort at nine years, based on a sample of 8,500 children surveyed
14 | P a g e
between Sept. 2007 and June 2008. Williams et al (2009) report that the GP visits rate for nine year olds with a Medical Card was 1.5 (1.4 for boys, 1.5 for girls), a GP Visit Card, 1.1 (1.0, 1.1) and neither 0.8 (0.7, 0.8).
3.3 TILDA: Fifty Years of Age and Older
The eligibility of patients fifty years of age over for coverage of GP fees can be broken down into four mutually exclusive eligibility categories using TILDA; Medical/GP Visit Card w/o PHI;36 Medical/GP Visit
Card w PHI;37 PHI only;38 and No Cover (i.e. those w/o either a Medical/GP Visit Card and PHI). Public
patients are Medical/GP Visit Card holders w and w/o PHI, private patients are PHI and No Cover. This definition of public/private patient is consistent with the approach adopted above with respect to GUI.
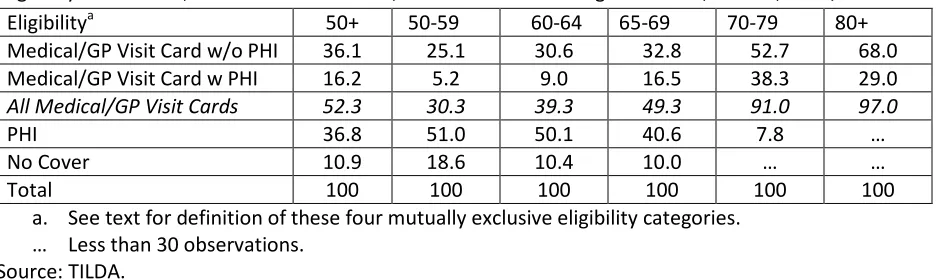
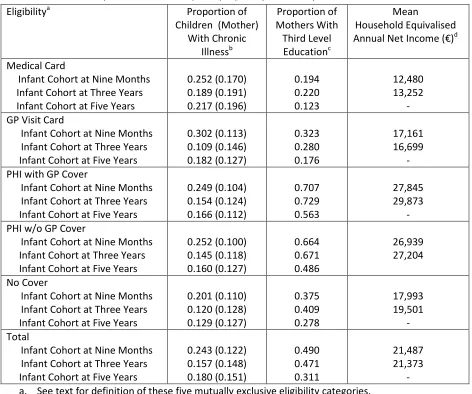
[image:15.612.74.546.394.534.2]The two important GP cover categories in the TILDA over 50 population were PHI and Medical/GP Visit Card w/o PHI each of which accounted for 36-37 per cent, while Medical/GP Visit Card w/o PHI added another 16.2 per cent, with only 10.9 per cent with No Cover. However, there was substantial variation in the importance of these different categories by age (Table 3). For the population over 70 years of age virtually all had a Medical/GP Visit Card, not surprising since the Medical Card was not means tested for those over 70 between 2001 and 2008, but was from January 2009. However, the income thresholds are much higher for those over 70 compared to younger age groups.39
Table 3
Eligibility for GP Care, Public & Private Cover, Persons 50 Years of Age and Over, Ireland, 2009/2011a
Eligibilitya 50+ 50-59 60-64 65-69 70-79 80+
Medical/GP Visit Card w/o PHI 36.1 25.1 30.6 32.8 52.7 68.0
Medical/GP Visit Card w PHI 16.2 5.2 9.0 16.5 38.3 29.0
All Medical/GP Visit Cards 52.3 30.3 39.3 49.3 91.0 97.0
PHI 36.8 51.0 50.1 40.6 7.8 …
No Cover 10.9 18.6 10.4 10.0 … …
Total 100 100 100 100 100 100
a. See text for definition of these four mutually exclusive eligibility categories. … Less than 30 observations.
Source: TILDA.
The results from the first wave of TILDA found that the average number of GP visits for those over 50 years of age is higher for those with a Medical/GP Visit Card (w or w/o PHI) as compared to those with
36 GP Visit Card holders are not distinguished from Medical Card holders in view of the small number of persons on a GP Visit Cards. Even the combined group of Medical/GP Visit Card holders results in cell sizes for certain age groups that are too small to report (e.g. see Table 4).
37 Sometimes referred to as Dual Cover. It is possible to break down this category separately into Medical Card and GP Visit Card holders but this would require further detailed coding of the PHI information recorded in TILDA. 38 It is possible to break down the PHI category into those with and w/o GP cover, but this would require an examination of individual patient PHI policies, the resources for which are not readily available.
15 | P a g e
[image:16.612.73.538.194.379.2]No Cover – 5.6 per year as compared to 2.3 per year (Table 4). The frequency of GP visits increases with age, from 3.4 per year for those 50-59, rising to 6.0 per year for those over 80. In terms of the detail it appears that the those persons on PHI became reclassified as Medical/GP Visit Card w PHI when they became 70 and this might explain the decline/stabilization in the number of GP visits for the latter category.
Table 4
GP Visits, Public & Private GP Cover, Persons 50 Years of Age and Over, Ireland, 2009/2011a
Average Number of GP Visits Per Year
Eligibilitya 50+ 50-59 60-64 65-69 70-79 80+
Medical/GP Visit Card w/o PHI 5.8 5.7 5.2 6.2 5.6 6.5
Medical/GP Visit Card w PHI 5.1 6.2 6.5 4.5 4.6 5.1
All Medical/GP Visit Cards 5.6 5.8 5.5 5.6 5.2 6.1
PHI 2.6 2.4 2.5 3.2 3.6 …
No Cover 2.3 2.2 2.3 3.3 … …
Total 4.1 3.4 3.6 4.4 5.0 6.0
a. See text for definition of these four mutually exclusive eligibility categories. All Medical/GP Visit Cards is a weighted average of Medical/GP Visit Card w and w/o PHI, where the weights were the shares in Table 3.
… Less than 30 observations. Source: TILDA.
3.4 QNHS: Eighteen Years of Age and Over
The eligibility of patients 18 years and over for GP care is broken down into a four categories in the QHNS: Medical/GP Visit Card w and w/o PHI; PHI w and w/o a Medical/GP Visit Card; PHI only (i.e. without a Medical/GP Visit Card); and No Cover (i.e. neither Medical/GP Visit Card nor PHI).40 There is an
overlap between the first two categories: persons with a Medical/GP Visit Card and PHI. However, only 6 per cent of patients have both a Medical/GP Visit Card and PHI. Nevertheless, there is some variation by age: between 2 and 5 per cent for age groups between 18 and 64, but with a pronounced increase for older persons, peaking at 33 per cent for those over 70.41 Public patients are Medical/GP Visit Card,
private patients PHI only and No Cover (which sums to a 100 in Table 5). This public/private split is consistent with the corresponding GUI and TILDA definitions.
40 For details see CSO (2011a, p. 24). For the purposes of one table only the importance of those with a Medical/GP Visit Card only (i.e. excluding those with a Medical/GP Visit Card and PHI) is presented (ibid, Table 1, p. 10).
16 | P a g e
Table 5
GP Visits & Health Indicators, Public & Private GP Cover, Persons 18 Years of Age and Over, Ireland, Q3 2010a
Eligibilitya Distribution
of Patients (%)
Average Annual Number of GP
Consultations
Perception of Own Health: % Very Goodb
One or More In-patient Hospital
Admissionc (%)
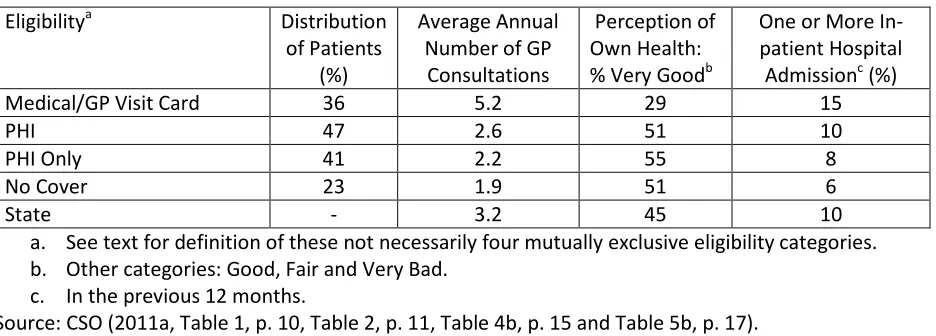
Medical/GP Visit Card 36 5.2 29 15
PHI 47 2.6 51 10
PHI Only 41 2.2 55 8
No Cover 23 1.9 51 6
State - 3.2 45 10
a. See text for definition of these not necessarily four mutually exclusive eligibility categories. b. Other categories: Good, Fair and Very Bad.
c. In the previous 12 months.
Source: CSO (2011a, Table 1, p. 10, Table 2, p. 11, Table 4b, p. 15 and Table 5b, p. 17).
The most important category of GP cover in 2010 was, a set out in Table 5, PHI (47 per cent) followed by Medical/GP Visit Card (36 per cent) and No Cover (23 per cent). The QHNS contains comparable percentages for 2001 and 2007. This shows that the importance of PHI and Medical/GP Visit Card have remained roughly constant (48 per cent and 28 per cent, respectively in 2001), while the No Cover has declined somewhat from 26 per cent in 2001.42 Nevertheless there has been a small decline in PHI
between 2007 and 2010 – 49 to 47 per cent – perhaps reflecting the impact of the financial crisis.
The annual number of GP consultations is, as anticipated and shown in Table 5, highest for those with a Medical/GP Visit Card (5.2 per annum) and lowest for those with No Cover (1.9 per annum). The corresponding consultation rates for PHI and PHI Only are somewhat above No Cover – 2.6 and 2.2, respectively, but well below Medical/GP Visit Card. If those on No Cover or either of the PHI categories were to replicate the consultation rates of those on Medical/GP Visit Card if they were given a GP Visit Card, then consultation rates for these groups would more than double. However, this is very much an upper limit in view of the greater likely demand for GP consultation amongst those with a Medical/GP Visit Card.
3.5 Six GP Practice Records: All Age Groups
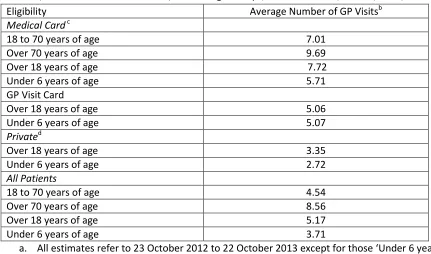
The eligibility of patients for GP cover is broken down by Behan et al (2103, 2014), based on six GP practice administrative records, into three mutually exclusive categories: Medical Card holders irrespective of whether or not they had PHI; GP Visit Card holders, irrespective of whether or not they had PHI; and Private, those without a Medical Card or a GP Visit Card. Private includes what would be referred to as PHI Only and No Cover in the QNHS categorization. Public patients are Medical/GP Visit Card holders. This public/private split is consistent with the corresponding GUI, TILDA and QNHS definitions.
17 | P a g e
Table 6
GP Visits, Public and Private GP Cover, Various Age Groups, Six GP Practices, Ireland, 2012/13a
Eligibility Average Number of GP Visitsb
Medical Card c
18 to 70 years of age 7.01
Over 70 years of age 9.69
Over 18 years of age 7.72
Under 6 years of age 5.71
GP Visit Card
Over 18 years of age 5.06
Under 6 years of age 5.07
Privated
Over 18 years of age 3.35
Under 6 years of age 2.72
All Patients
18 to 70 years of age 4.54
Over 70 years of age 8.56
Over 18 years of age 5.17
Under 6 years of age 3.71
a. All estimates refer to 23 October 2012 to 22 October 2013 except for those ‘Under 6 years of age’ where the period is 1 January 2013 to 31 December 2013.
b. GP visits are defined as per the text and include telephone and out-of-hours consultations c. Patients on a discretionary Medical Card visited with a frequency of 8.11.
d. Private is non-Medical Card/GP Visit Card holders. Source: Behan et al. (2013, Table 2, p. 298; 2014, pp. 121-122).
Behan et al (2013, Table 1) find across the six GP practices that 42 per cent of patients over 18 in 2012/13 were classified as GMS (i.e. in receipt of a Medical or GP Visit Card) with the remaining 58 per cent classified as private patients. For 2010 the QNHS the corresponding percentages were that 36 and 64 per cent. The difference could be explained by the financial crisis leading to a greater proportion of the population becoming eligible for Medical/GP Visit Cards.
Behan et al (2013) present findings for those 18 years of age and over, while Behan et al (2014) for those aged less than 6 years of age (Table 6). In both instances those with a Medical/GP Visit Card recorded more GP visits than private patients. For example, those persons over 18 on a Medical Card have, on average, 7.72 GP consultations per year, whereas those over 18 who do not have a Medical Card experience on average 3.35 GP consultations per year. The corresponding GP visiting rates for those under 6 was 5.71 and 2.72.
18 | P a g e
age experience 8.56 GP consultations per year. The consultations by age are consistent with the results reported above for TILDA (Table 4) and detailed age breakdown for QNHS for persons over 18.43
3.6 Similarities and Differences
3.6.1 Introduction
There are certain common findings concerning GP visits across the retrospective self-reporting by patients (Sections 3.2 to 3.4) and the six GP practice administrative records (Section 3.5). The discussion here concentrates on comparisons using the Medical Card (sometimes combined with a GP Visit Card) across the various sources since it was not always possible to get a separate breakdown for the GP Visit Card and even if it were possible the cell sizes might have been too small too report.
The common findings include that GP visits increase with age and that GP visits are higher for Medical Card holders as compared to those without a Medical Card, both overall and controlling for age. GP visits by Medical/GP Visit Card holders routinely exceed those of patients w/o such cards. For the population over 18 a Medical/GP Visit Card holder visits the GP 5.2 times per year compared to 2.6 for those on PHI and 1.9 for those with No Cover. This is consistent with findings for younger (GUI) and older (TILDA) persons. In other words, public patients visit the GP with greater frequency than private patients.
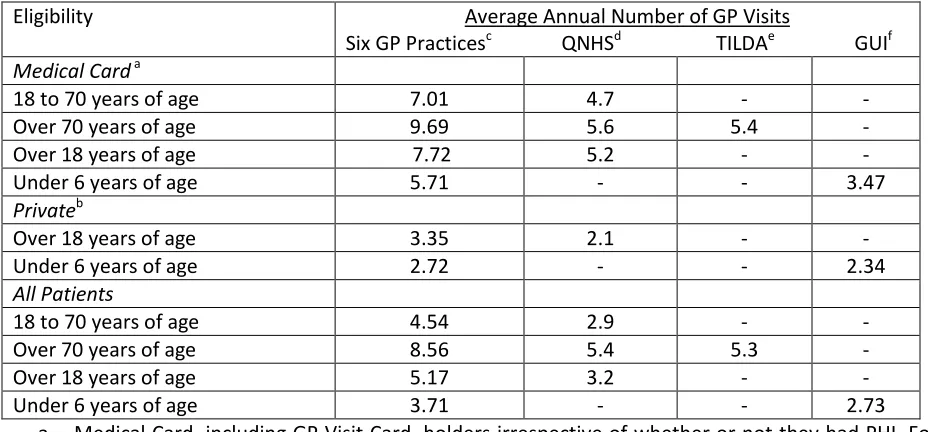
Furthermore, the relative magnitude of these differences is similar in those instances where direct comparisons can be made (Table 7). The ratio of GP visits for those 18 to 70 with a Medical Card to all those 18 to 70 is 1.5 for Behan et al (‘Six GP Practices’ in Table 7) and 1.6 for QNHS; for patients with a Medical Card over 18 to all patients over 18, the corresponding ratios are 1.5 and 1.6, respectively. Equally the ratio of GP visits for those over 18 with a Medical Card to private patients over 18 was 2.3 for Behan et al and 2.5 for QNHS. The ratio of GP visits for those over 70 with a Medical Card to all those over 70 are 1.1, 1.0 and 1.0 for Behan et al, QNHS and TILDA, respectively. Finally, the ratio of GP visits for those under 6 with a Medical Card to all those under 6 is 1.5 and 1.3 for Behan et al and GUI, respectively.
Notwithstanding these important common findings the two approaches to measuring GP visits differ in at least one important respect: the absolute magnitude of the number of GP consultations. In general the number of GP visits is higher for Behan et al as compared to the retrospective self-reporting by patients in QNHS, TILDA and GUI. The ratio of GP visits from Behan et al to the retrospective self-reporting sources, for comparable groups, varies between 1.5 and 1.7 for QNHS, 1.6 to 1.8 for TILDA and 1.2 to 1.7 for GUI (Table 7). In other words, for comparable groups, the administrative approach to measuring GP visits results more visits being recorded per annum, with an average of 1.6 across the twelve instances where comparisons can be made in Table 7.
This naturally raises the issue of why such differences might exist in measuring GP visits as between retrospective self-reporting and GP practice records. This is important because given that the impact of
19 | P a g e
[image:20.612.71.535.143.359.2]providing free GP care might be expected to be different depending on the source used. A number of points can be made to resolve this issue.
Table 7
GP Visits, Public and Private GP Cover, Various Age Groups & Sources, Ireland, 2008-2013
Eligibility Average Annual Number of GP Visits
Six GP Practicesc QNHSd TILDAe GUIf
Medical Card a
18 to 70 years of age 7.01 4.7 - -
Over 70 years of age 9.69 5.6 5.4 -
Over 18 years of age 7.72 5.2 - -
Under 6 years of age 5.71 - - 3.47
Privateb
Over 18 years of age 3.35 2.1 - -
Under 6 years of age 2.72 - - 2.34
All Patients
18 to 70 years of age 4.54 2.9 - -
Over 70 years of age 8.56 5.4 5.3 -
Over 18 years of age 5.17 3.2 - -
Under 6 years of age 3.71 - - 2.73
a. Medical Card, including GP Visit Card, holders irrespective of whether or not they had PHI. For ‘Six GP Practices’ and GUI Medical Card does not include GP Visit Card. If Medical Card is re-estimated to include GP Visit Card holders then instead of 3.47 the visiting rate is 3.71.
b. Private is non-Medical Card/GP Visit Card holders.
c. These data are taken from Table 10 above. The data refer to 2012-2013.
d. QNHS are based on CSO (2011a, Table 1.3, p. 4, Table 4b, p. 15) and Behan et al (2013, Table 2, p. 298). QNHS refers to 2010.
e. Tables 3 and 4 were used to estimate the weighted mean of GP visits for Medical/GP Visit Card holders (i.e. Medical/GP Visit Card w and w/o PHI) for 70-79 and 80 plus. The weights to estimate average GP visits for those over 70 were obtained from the underlying TILDA data. TILDA refers to 2009-2011.
f. GUI refers to the mean values of the Infant Cohort surveyed in 2008/09 (9 months), 2010/11 (three years), and 2013 (five years). For 9 months GP visits are expressed an annual equivalent (i.e. multiplied by 1.33). Private defined as PHI with GP cover; PHI w/o GP cover; and, No Cover, with the weights used derived from Table 1 above. The weighted average of GP visit rates for the Infant Cohort at 9 months, 3 years and 5 years used 0.3468, 0.3422 and 0.3110, respectively, from the 2011 Census.
Source: Behan et al. (2013, Table 2, p. 298; 2014, pp. 121-22); CSO (2011a, Table 1.3, Table 4b; 2012, Table 2, pp. 36-37); Tables 1 to 4 above.
3.6.2 Definition of GP Visit
20 | P a g e
the definitions of a GP visit or consultation. However, there may be a difference in the interpretation/application of the definition. When patients visit a GP surgery they may not always see the GP but instead another health professional such as a nurse. If these visits are counted as a GP visit by Behan et al but not by patients when participating in GUI, TILDA and QNHS than this difference may account, in part, for the higher incidence of GP visits by Behan et al. In other words, Behan et al record visits to a GP surgery whereas GUI, TILDA and QNHS record a visit to the GP.
There is some evidence, albeit somewhat tangential, to support this view. Behan et al (2013, Table 2) present the GP visit rate not only for the six GP practices, but also based on a large number GP practices in England (Hippisley-Cox & Vinogradova, 2009). The latter source is credited with a GP visit rate of 5.5 for all patients, compared to 5.17 from Behan et al (2013). However, the 5.5 GP visit rate refers to visits to all clinicians, not just GPs i.e. GPs, nurses and other clinicians. When the latter two categories are excluded, the GP visit rate based on Hippisley-Cox & Vinogradova (2009, p. 17) is 3.4, quite similar to the QNHS estimate in Table 7 of 3.3.44
3.6.3 Missing Visits
A Medical (and GP Visit) Card patient is likely to remain with the same GP since the patient is registered with a particular GP who receives a capitation payment for that patient from the State. In contrast, a private patient under a fee for service regime may visit different GPs in the course of a year.45
Retrospective self-reporting of the number of GP visits by GUI, TILDA and QNHS will not be affected by this distinction, because the patient is asked how many GP visits, irrespective of the location and identity of the GP or the GP practice. Hence, for private patients, other things being equal, GP visits will be higher (not lower) for retrospective self-reporting surveys than for administrative records of GP practices.
3.6.4 Counting Private Patients
The six GP practices record the number of visits per patient over a year. However, if a private patient does not visit then the GP practice has no way of knowing the reason for that – relocation, death, switching to another GP in the same area or in good health thus not requiring the GP’s services. If a correction is not made for private patients that do not visit the GP, administrative GP records will overestimate GP visiting rates for private patients.
Behan et al (2013, p. 298) are aware of this problem and using the following approach to correct for unrecorded private patients:
We estimated the number of ‘private’ patients in each practice from the number of unique private patient attendances during the 12 month study period and dividing by
44 It appears that there are differences in the population covered. Behan et al (2013, Table 2) and QHNS refer to all persons 18 and over, Hippisley-Cox & Vinogradova (2009) to all persons. However, these differences are unlikely to invalidate the point made in the text.
21 | P a g e
0.7 (derived from 2010 CSO NQHS data which estimated that 70% of non-GMS patients attended their GP in the previous 12 months).
Across the six GP practices use by Behan et al (2013), the average number of GP consultations for those private patients over 18 that visited these practices in 2012-2013 was 4.8.46,47 However, the corrected
rate, taking into account the fact that some private patients would not have visited the GP practice in the year in question was the 3.35 presented in Behan et al (2013, Table 2) and reproduced in Tables 6 and 7 of this paper.48
Administrative GP practice records, for comparable groups, report, on average 60 per cent more GP visits than retrospective self-reporting by patients (Table 7). This suggests that the 0.7 proportion used by Behan et al (2013) is likely, other things being equal, to be a substantial underestimate of the proportion of private patients that visited one of the six GP practices, had Behan et al (2013) been able to use administrative GP practice records to generate this proportion.49 If 0.7 were to be increased by
between 60 per cent then it suggests, given that the proportion is bounded by 1, that all private patients visited the six GP practices. In other words, the average number of GP visits using Behan et al (2013) for private patients over 18 in 2012-13 should be closer to 4.8 than 3.35.50
3.6.5 Conclusion
Three explanations for differences in GP visit rates as between retrospective self-reporting by patients and administrative records of six GP practices. The interpretation of the definition of a GP visit provides an explanation for why the GP visit rates derived from administrative records of six GP practices may be greater than those derived from retrospective self-reporting by patients. The next two explanations provide reasons for differences in GP visits by private patients as between the two data sources for measuring GP visit rates: ‘Missing Visits’ suggests that GP visits based on retrospective self-reporting by patients should be greater than those derived from the administrative records of six GP practices, while
46 Behan et al (2013, Table 2) estimate the average number of GP visits per private patient over 18 as 3.35. Given an 0.70 correction factor implies that the average number of GP visits for those private patient that visited one of the six GP practices was 4.8. (3.35=TPv/(PPvx(1/0.70))= TPv/(PPvx1.43). If both sides of the equation are multiplied by 1.43 this reduces to 4.8= TPv/PPvx, where PPv is the total number of GP consultations across the six GP practices in 2012/13 by private patients over 18 and PPv is the total number of private patients over 18 that consulted with the six GP practices in 2012/13.
47 Arguably when GP visit rates are presented by age group age specific correction factors should be used given the variance across age groups of the proportion of those that visit a GP at least once in a year. For example, for those in the age group 18-24, 60 per cent visit the GP at least once a year, while for those aged over 70 the proportion rises to 91 per cent (CSO, 2011a, Table 1.3, p. 4). For further discussion see Annex 1.
48 3.35=4.8/1.43
49 This would have been the case if all private patients were required to register with a GP.
22 | P a g e
‘Counting Private Patients’ suggests the reverse. However, the only explanation for which there is any evidence is ‘Counting Private Patients.’ In sum, it is not at all clear why administrative records of six GP practices results in higher GP visit rates than retrospective self-reporting by patients.
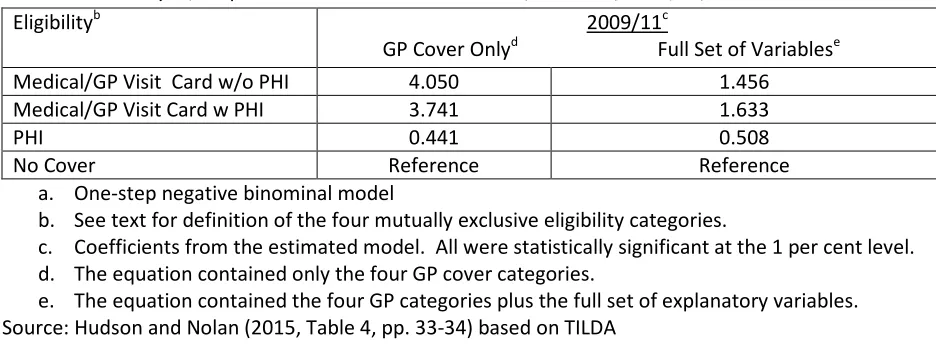
IV EXPLAINING PUBLIC/PRIVATE PATIENT DIFFERENCES IN GP VISIT RATES
4.1 Introduction
The burden of Section III is that public patients visit the GP with greater frequency than private patients, irrespective of the data source used. The issue thus arises as to what will happen to GP visit rates of private patients as they receive free GP care and thus become public patients.
An upper bound of the demand by private patients for GPs services under free GP care is to assume – as have Behan et al (2013, 2014), LHM Casey McGrath (2015) and the National Association of General Practitioners (NAGP)51 - that former private patients eligible for free GP care visit GPs with the same
frequency as means tested Medical/GP Visit Card patients of the same age and gender. The upper bound estimate is making the implicit assumption that the demand for GP visits for means tested Medical/GP Visit Card and private patients is the same, but for the fact that private patients pay for their GP visits. This, in turn, implies that Medical/GP Visit Card and private patients, of the same age and gender, share the same characteristics.
A lower bound of the demand by private patients for GP services under free GP care is to assume that such patients do not change the frequency with which they visit the GP when they become eligible for free GP care.52 The lower bound estimate is making the implicit assumption that the demand for GP
services by private patients is not constrained by the price of a GP visit and hence making free GP care will have little impact on GP visiting rates. This may reflect a sufficiently high income or that the patient has PHI with GP cover. However, for patients just above the Medical/GP Visit Card income thresholds, who are much less likely to be covered by PHI, the possession of a Medical/GP Visit Card is more likely to lead to an increase in demand for GP visits.53
There are several different approaches to categorizing the factors likely to account for the demand for GP visits. We use the threefold classification of Nolan and Nolan (2007), since it is particularly suited to the assessing the impact of providing free GP care for former private patients. First, is patient ‘need’ for GP visits as “proxied by their age, gender and health status” (ibid, p. 35). The latter may be either
51 The NAGP, a GP representative body, argued in an unsuccessful 2015 High Court action against the HSE concerning the introduction of the under 6 GP contract, that patients under 6 not in receipt of a Medical/GP Visit Card would assume the same visiting rates as those with such Card. Based on Williams (2015, para. 46). The NAGP commissioned LHM Casey McGrath (2015), which adopts a similar approach to Behan et al (2013, 2014) to estimating the impact of extending free GP care to all, irrespective of income.
52 Recall private patients are above the income threshold for the means tested Medical/GP Visit Card and hence the €50 per GP visit is less likely to be a barrier to accessing GP services. Furthermore the private patient may have PHI, which may partly mitigate the cost of a GP visit.
23 | P a g e
assessed or measured by the severity of a chronic illness or whether or not the patient suffers from psychological stress. Need is in some sense on an objective measure of demand independent of income.
Second, are socio-economic determinants some of which are patient (e.g. the highest level of educational attainment, employment status, marital status, social class) while others are household (e.g. household location, household size). Third, are the financial incentives that face both the GP (e.g. whether or not the GP is reimbursed by a fee for service or capitation payment) and the patient (e.g. whether or not GP care is provided free, the patient has PHI, patient income).
It should be noted that these three sets of factors are unlikely to be independent, but correlated. For example, a patient with a low income might also tend to be unemployed and in poor health and therefore more likely to visit a GP than a patient with high income who is more likely to be employed and in good health. In order to disentangle the importance of the various factors that are likely to influence the demand for GP visits multivariate analysis is required. It is only when all the factors determining the number of GP visits are taken into account that the influence a patient moving from being a private to a public patient can be evaluated.
In order to investigate the influence of these factors we first consider patient characteristics by GP cover category before turning to multivariate analysis to estimate the impact of free GP care. Such analysis can only be conducted using GUI, TILDA and QNHS. Behan et al (2013, 2014) do not present patient characteristics by GP cover, apart from age, and do not report any multivariate analysis. In large part this is because GP administrative records do not contain extensive data on, for example, patient income and education, and, in part, because although GP administrative records no doubt contain various aspects of health status, it might require considerable resources to code such information, which may not always be stored in a comparable and consistent way across the six GP practices.
4.2 Patient Characteristics by GP Cover
4.2.1 GUI: Infant Cohort at Nine Months, Three and Five Years
24 | P a g e
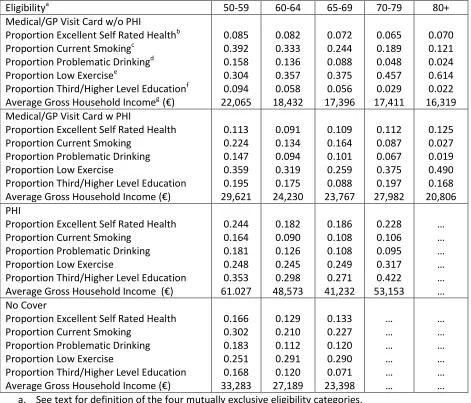
Table 8
Health Status,
Educational Attainment, & Household Income, Public & Private GP Cover, InfantCohort at Nine Months, Three & Five Years, 2008/09, 2010/11 & 2013, Ireland
Eligibilitya Proportion of
Children (Mother) With Chronic Illnessb Proportion of Mothers With Third Level Educationc Mean Household Equivalised Annual Net Income (€)d
Medical Card
Infant Cohort at Nine Months Infant Cohort at Three Years Infant Cohort at Five Years
0.252 (0.170) 0.189 (0.191) 0.217 (0.196) 0.194 0.220 0.123 12,480 13,252 - GP Visit Card
Infant Cohort at Nine Months Infant Cohort at Three Years Infant Cohort at Five Years
0.302 (0.113) 0.109 (0.146) 0.182 (0.127) 0.323 0.280 0.176 17,161 16,699 - PHI with GP Cover
Infant Cohort at Nine Months Infant Cohort at Three Years Infant Cohort at Five Years
0.249 (0.104) 0.154 (0.124) 0.166 (0.112) 0.707 0.729 0.563 27,845 29,873 - PHI w/o GP Cover
Infant Cohort at Nine Months Infant Cohort at Three Years Infant Cohort at Five Years
0.252 (0.100) 0.145 (0.118) 0.160 (0.127) 0.664 0.671 0.486 26,939 27,204 No Cover
Infant Cohort at Nine Months Infant Cohort at Three Years Infant Cohort at Five Years
0.201 (0.110) 0.120 (0.128) 0.129 (0.127) 0.375 0.409 0.278 17,993 19,501 - Total
Infant Cohort at Nine Months Infant Cohort at Three Years Infant Cohort at Five Years
0.243 (0.122) 0.157 (0.148) 0.180 (0.151) 0.490 0.471 0.311 21,487 21,373 - a. See text for definition of these five mutually exclusive eligibility categories.
b. Children (and mothers) were classified as to whether or not they had a chronic physical or mental illness.
c. Third level is defined as non-degree education, degree education and postgraduate education. Non-third level education is defined as no/primary education, lower secondary education and upper secondary education.
d. Net income refers to income after deductions for tax and pay-related social insurance (PRSI). The equivalence scale used assigns a value of 1 for the first adult, 0.66 to all others aged over 14 years and over, and 0.33 to all the children 13 years and younger.
Source: GUI