ESRI working papers represent un-refereed work-in-progress by researchers who are solely responsible for the content and any views expressed therein. Any comments on these papers will be welcome and should be sent to the author(s) by email. Papers may be downloaded for personal use only.
Who pays for renewables? Increasing renewable subsidisation
due to increased datacentre demand in Ireland
Muireann Á. Lynch
a,band Mel T. Devine*
a,bAbstract: Demand from datacentres makes up a rapidly growing portion of electricity demand in Ireland. Increased demand in turn gives rise to increased renewable generation, mandated by government targets, and a corresponding increase in subsidisation levels. The current method of apportioning renewable subsidy costs may lead to consumers other than datacentres bearing this excess cost of subsidisation. This letter calculates the expected impact on these consumers.
*Corresponding Author: [email protected]
Keywords: Capacity markets; Reliability; Mixed complementarity problem; Stochastic modelling JEL Codes: Q4, D43, D47, L13, C61
Acknowledgements: Lynch and Devine are funded by the Energy Policy Research Centre (EPRC). We are grateful to Seán Lyons and Valentin Bertsch for helpful comments and suggestions. All omissions and errors are our own.
a The Economic and Social Research Institute, Dublin b Department of Economics, Trinity College, Dublin
Working Paper No. 566
June 2017
Subsequently published in "Who pays for renewables?
Increasing renewable subsidisation due to increased
ARTICLE TEMPLATE
Who pays for renewables? Increasing renewable subsidisation due to increased datacentre demand in Ireland
M. ´A. Lyncha,b and Mel T. Devinea,b
aEconomic and Social Research Institute, Dublin, Ireland; bDepartment of Economics,
Trinity College, The University of Dublin, Ireland
ARTICLE HISTORY
Compiled June 7, 2017
ABSTRACT
Demand from datacentres makes up a rapidly growing portion of electricity demand in Ireland. Increased demand in turn gives rise to increased renewable generation, mandated by government targets, and a corresponding increase in subsidisation levels. The current method of apportioning renewable subsidy costs may lead to consumers other than datacentres bearing this excess cost of subsidisation. This letter calculates the expected impact on these consumers.
KEYWORDS
Renewables; electricity; subsidy; datacentres;
1. Introduction
In response to European targets requiring 20% of total energy demand to be met by renewable energy (European Commission 2009), Ireland has set a target for 40% of electricity demand to be met by renewable generation, primarily wind energy (DCENR 2009). In order to incentivise the deployment of sufficient renewable electricity gener-ation capacity to meet this target, renewable generators are compensated by means of a renewable energy feed-in tariff. In Ireland, when the market price drops below the tariff, the generator receives the tariff for each unit of electricity generated, while when the market prices rises above the tariff, the generator receives the market price. The design of the feed-in tariff in Ireland can thus be considered a floor price. The revenues necessary to fund this subsidy mechanism are levied on consumers through a Public Service Obligation levy. The proportion of the levy paid by small commercial con-sumers, residential consumers and medium and large profile consumers is determined by their contribution to peak demand (Statutory Instrument 217 2002).
There has been a significant increase in the number of datacentres located in Ireland in recent years, with a corresponding increase in electricity demand. The total elec-tricity demand from these datacentres is set to rise further still (EirGrid 2017). Given that the target for renewable electricity is set as a proportion of the total electricity demand, this increase in electricity demand from datacentres necessitates higher abso-lute levels of renewable generation in order to meet the targets, with a corresponding rise in renewable subsidisation. However, the method of apportioning the cost of this
subsidisation across consumer categories (residential, small commercial and medium and large profile) means consumers that did not give rise to the increase in renewable subsidisation must nevertheless bear the cost of same. This could give rise to equity concerns and potentially feed public opposition to renewable energy projects and/or new datacentres.
This letter quantifies the total expected increased subsidy cost arising from the in-creased demand from datacentres. The inin-creased cost is calculated twice, assuming in the first instance that the extra renewable generation is met by onshore wind gen-eration, and in the second instance that it is met by photovoltaic solar generation. We apportion this expected cost increase across the different consumer categories ac-cording to the current method of PSO cost allocation. On the basis of our results we propose that an alternative method for distributing the cost of subsidisation be explored, which would see the cost incurred by datacentres being borne by consumers in that sector only.
2. Calculation of impact of datacentres
The present value of the PSO cost over the lifetime of the renewable capacity invest-ment is calculated in the same manner as in Devine, Farrell, and Lee (2017). The cost is calculated for three different levels of renewable capacity, corresponding to three dif-ferent levels of demand, which are largely driven by the rollout of datacentres. These different levels of datacentre connection are estimated by the Transmission System Operator of Ireland, EirGrid (EirGrid 2017).
We assume new renewable generation capacity arising from the increased demand from datacentres is met either by new onshore wind or by photovoltaic solar generation. The majority of renewable generation in Ireland at present is met by onshore wind (EirGrid 2017). There is also growing interest in solar generation; the Government’s Energy White Paper states that “The deployment of solar in Ireland has the potential to increase energy security, contribute to our renewable energy targets, and support economic growth and jobs” (DCENR 2015) and there are discussions around a subsidy for solar generation. For this reason we consider the effect of meeting the new renewable generation required with either wind or solar. We assume the onshore wind required to meet the underlying renewable target in the low demand scenario, which corresponds to a low connection rate of datacentres, is 3942MW (calculated from EirGrid (2017)). This level of onshore wind generation is assumed to exist also in the median and high demand scenarios. We calculated the cost of the extra renewable generation required under median and high demand scenarios twice. In the ‘wind’ scenario we assume the extra renewable generation is met by extra onshore wind generation and in the ‘solar’ scenario we assume the extra renewable generation is met by photovoltaic solar generation. The extra renewable capacity required under the median and high demand scenarios is calculated using a capacity factor of 31% for onshore wind, as per EirGrid (2017), and 9% for solar (Ryan et al. 2016). The demand and renewable generation capacities required (on top of the 3942MW of onshore wind in the low demand scenario) are given in table 1. Note that these figures apply to the Republic of Ireland only rather than the whole all-island market of Ireland.
The total expected cost of subsidising the different levels of renewable capacity over twenty years is calculated using, for the most part, the same cost and technical assumptions as Devine, Farrell, and Lee (2017). In addition, the feed-in tariff for wind is set ate72/MWh, as this was the level of the tariff in 2017. At present solar generation
Low demand Median demand High demand
Demand (TWh) 30 31.2 32.6
Wind scenario (MW) - 157.7 341.7
[image:4.595.124.475.89.164.2]Solar scenario (MW) - 543.2 1176.9
Table 1. Demand (TWh) and renewable generation capacities (MW) scenarios
does not have a feed-in tariff, so we used the figure ofe130/MWh from Ryan et al. (2016).
The total expected cost under each scenario is shown in table 2.
PSO costs Low demand Median demand High demand
Wind scenario 3092 3708 4352
Solar scenario 3092 3171 3307
Table 2. Total subsidy cost for each of renewable installation scenario (Me)
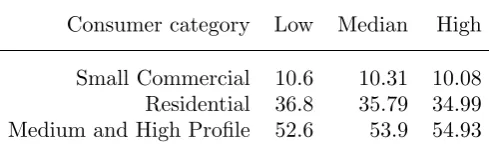
As expected, the higher renewable generation targets give rise to higher costs with the solar scenario giving rise to higher costs again. Table 3 shows the contribution to peak demand by each consumer category in 2016, according to CER (2016). We calculate the new contribution from each under the median and high demand scenarios, taking the new demand from datacentres into account, and assuming there is no change in demand from other consumers.
Consumer category Low Median High
Small Commercial 10.6 10.31 10.08 Residential 36.8 35.79 34.99 Medium and High Profile 52.6 53.9 54.93
Table 3. Share of peak demand made up by each consumer category under each demand scenario (%)
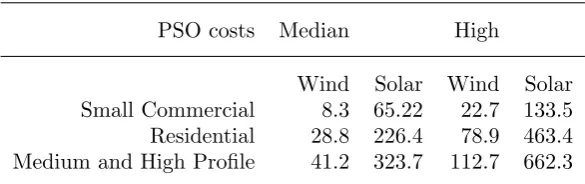
Taking these shares, the proportion of the subsidy cost in table 2 can be divided between the various consumer categories. In particular, the extra subsidy cost at-tributable to the demand from datacentres, under the median and high demand sce-narios, is decomposed between the three consumer categories in table 4.
[image:4.595.175.420.447.522.2]PSO costs Median High
[image:5.595.151.444.84.176.2]Wind Solar Wind Solar Small Commercial 8.3 65.22 22.7 133.5 Residential 28.8 226.4 78.9 463.4 Medium and High Profile 41.2 323.7 112.7 662.3
Table 4. Portion of extra costs borne by each consumer group (reference scenario: low demand wind scenario) (Me)
all over the EMEA area and yet Irish consumers would bear the cost of the associated renewables.
This change in PSO cost burden has its roots in the PSO mechanism design. Ap-portioning the cost on the basis of peak demand places a greater share of the burden on consumers with a more variable demand pattern. As industrial loads in general, and datacentres in particular, have relatively fixed demand profiles, they consequently bear only a portion of the subsidisation cost for which their demand is responsible. In 2016, the majority of the gross PSO cost was attributable to renewable and peat subsidisation (67.9% and 28.2% respectively (CER 2016)). Peat stations are run at maximum output regardless of the market demand and so the first order effect of changes in demand on peat station subsidisation is zero1. As the required quantity of renewables is determined on the basis of total demand rather than total capacity, there may be an argument for apportioning PSO cost according to the contribution of each sector to average rather than peak demand. This would mean each sector would be responsible for the proportion of PSO costs that arose due to their contribution to market demand.
3. Conclusion
This letter calculated the increased renewable subsidy costs that increased loads from datacentres may impose on consumers in Ireland. The extra cost arises from EU man-dated government targets for renewable generation, which are calculated as a portion of total demand. Assuming the current method of apportioning PSO costs is applied as these new loads come on stream, residential and small commercial consumers will face increased PSO payments. The level of these costs increases considerably if the extra renewable requirement is met with solar generation.
Datacentre owners may prove unwilling to inflict higher costs on consumers, through PSO payments or otherwise. Therefore datacentre owners and/or energy regulators may wish to explore an alternative method of calculating and apportioning PSO costs to new loads of this type. The findings of this letter suggest that such an approach is prudent and may inform discussions on an alternative mechanism.
1The level of subsidisation required is determined by the peat stations’ profitability, which in turn is a function
of electricity prices. Given that electricity prices are a function of demand, one could argue that higher demand leads to higher prices and lower subsidisation costs. The modelling of these effects is beyond the scope of this letter.
Acknowledgements
Lynch and Devine acknowledge funding from the Energy Policy Research Centre. The usual disclaimer applies.
References
CER. 2016. “PUBLIC SERVICE OBLIGATION LEVY 2016/17.” Available on-line: http://www.cer.ie/docs/001074/CER16252%20PSO%20Levy%202016-17%20-%20Revised%20Decision%20Paper.pdf.
DCENR. 2009. “National renewable energy action plan Ireland.” Available online:
http://www.dccae.gov.ie/documents/The%20National%20Renewable%20Energy%20Action%20Plan%20(PDF).pdf. DCENR. 2015. “Irelands Transition to a Low Carbon Energy Future 2015-2030.”
Available online: http://www.dccae.gov.ie/documents/Energy%20White%20Paper%20-%20Dec%202015.pdf.
Devine, Mel T, Niall Farrell, and William T Lee. 2017. “Optimising feed-in tariff design through efficient risk allocation.”Sustainable Energy, Grids and Networks 9: 59–74.
EirGrid. 2017. “All-Island Generation Capacity Statement 2017-2026.” .
European Commission. 2009. “DIRECTIVE 2009/28/EC OF THE EUROPEAN PAR-LIAMENT AND OF THE COUNCIL of 23 April 2009 on the promotion of the use of energy from renewable sources and amending and subsequently re-pealing Directives 2001/77/EC and 2003/30/EC.” Available online: http://eur-lex.europa.eu/LexUriServ/LexUriServ.do?uri=OJ:L:2009:140:0016:0062:EN:PDF.
Ryan, Lisa, Joseph Dillon, Sarah La Monaca, Julie Byrne, and Mark O’Malley. 2016. “Assessing the system and investor value of utility-scale solar PV.”Renewable and Sustainable Energy Reviews 64: 506–517.
For earlier Working Papers see http://www.esri.ie
Year
Number
2017
565
564
563
562
561
560
559
558
557
556
555
Title/Author(s)
ESRI Authors
and
Affiliates
Italicised
Can tenants afford to care? Investigating the willingness-to-pay for improved energy efficiency of rental tenants and returns to investment for landlords
Matthew Collins and John Curtis
Female participation increases and gender segregation Claire Keane, Helen Russell and Emer Smyth
Pike (Esox lucius) stock management in designated brown trout (Salmo trutta) fisheries: Anglers’ preferences
John Curtis
Financial incentives for residential energy efficiency investments in Ireland: Should the status quo be maintained?
Matthew Collins, Seraphim Dempsey and John Curtis
Does a satisfied student make a satisfied worker? Adele Whelan and Seamus McGuinness
The changing relationship between affordability and house prices: a cross-country examination
Kieran McQuinn
The role of community compensation mechanisms in reducing resistance to energy infrastructure development
Marie Hylandand Valentin Bertsch
Identification of the information gap in residential energy efficiency: How information asymmetry can be mitigated to induce energy efficiency renovations Matthew Collins and John Curtis
Investment in knowledge-based capital and its contribution to productivity growth: a review of international and Irish evidence
Iulia Siedschlag, Martina Lawless and Mattia Di Ubaldo
The impact of investment in knowledge-based capital on productivity: firm-level evidence from Ireland
Iulia Siedschlag and Mattia Di Ubaldo
Making centralised data work for community development: an exploration of area-based training programmes in a unified framework