The performance of heifers reared in a suckling system
Judith Vertooren
November 2005 – June 2006
Biological Farming Systems Group
Marijkeweg 22 - 6709 PG Wageningen - The Netherlands
The performance of heifers reared in a suckling system
Name student: Judith Vertooren
Registration number: 830606-885-030
Credits: 39
Code number/ BFS - 80439
name course: Thesis Biological Farming Systems
Period: November 2005 – June 2006
Supervisor(s): Egbert Lantinga – Biological Farming Systems Group, WageningenUR Jan-Paul Wagenaar – Louis Bolk Institute, Driebergen
Abstract
In this study the effects on the performance of heifers reared in a suckling system (suckled heifers) compared to heifers reared in a bucket system (bucket heifers) were investigated. Heifers are young dairy cows that started first lactation. Focus was on the following parameters: age and live weight at first calving, milk production, and mastitis incidence. Also, attention was given to Paratuberculosis since suckling systems might increase the risks on its occurrence.
The hypothesis was that suckled heifers reach a higher live weight, at a comparable age, compared to bucket heifers. Usually, farmers use live weight as an indicator to inseminate or introduce the calf to the bull. Hence, suckled heifers compared to bucket heifers can become pregnant at a younger age. Age at first calving could thus be reduced for suckled heifers. Alternatively, suckled heifers have a higher live weight at first calving. This generally increases first lactation milk yield.
Another hypothesis was that suckled heifers, compared to bucket heifers, would perform better in terms of mastitis incidence. The reason behind this is that suckling calves receive important antibodies for their immune system by the uptake of colostrum and milk. Moreover, suckling calves are more exposed to the farm specific pathogens, which might build up resistance.
Suckled heifers and bucket heifers from two organic farms (Farm 1 and Farm 2) were compared. Data from 72 heifers that were born in 2001, 2002 and 2003 was used. The 72 heifers were divided into 7 groups: 2 suckled and 1 bucket group on Farm 1, and 2 suckled and 2 bucket groups on Farm 2. All heifers entered first lactation.
Main results were as follows:
§ In contrast with the expectations, no difference in live weight between the suckled and bucket group was found on Farm 1. However, live weight data appeared to be affected by the breeding management. On this farm, artificial insemination was used in the bucket group and the farmer’s own bull in the suckled groups. Artificial insemination was carried out with a 100% Montbéliarde cow, while the farmer’s own bull was a crossbred of Montbéliarde with a high percentage of Groninger Blaarkop. Montbéliarde cows have a higher adult live weight than Groninger Blaarkop cows. Artificial insemination with genetically identical bulls was applied to all heifers on Farm 2. The suckled heifers reached a significantly higher live weight, at a comparable age, compared to bucket heifers.
§ All suckled heifers on Farm 1 had a lower age at first calving compared to the bucket reared heifers. On Farm 2, only suckled heifers that were born in 2003 had a lower age at first calving compared to heifers reared in bucket system.
On Farm 2, no significant difference in milk production between suckled and bucket heifers was found.
§ On Farm 1, heifers reared in a suckling system, were born in a different year than those reared in a bucket system. Therefore, mastitis data from suckled and bucket groups were not fully comparable. Average SCC (Somatic Cell Count) of the herd varied a lot between different years. On farm 2, no significant difference in mastitis incidence between suckled and bucket heifers was found;
§ Inherent to a suckling system is that calves are drinking part of the saleable milk. A lower age at first calving due to suckling reduces rearing costs. The loss of saleable milk by suckling was totally repaid by a shorter rearing period on Farm 1 and almost completely on Farm 2.
§ It was found that the Parawijzer was not useful to prevent Paratuberculosis on farms were suckling systems are used, because a number of measures is not applicable on farms using suckling systems.
Preface
Through the room of my living room I have a view over the fields of the neighbouring dairy farmer. Last autumn late in the evening there was a calf walking with it’s mother in the pasture, while the rest of the dairy cows already went inside. After phoning the farmer that his cow stayed behind, he answered that calf and cow had to stay outside, because he was trying out to keep them together. This spring I have already seen a few calves with their mother in the herd. My neighbour is experimenting to use a suckling system. Which is really improving my view!
My thesis was carried out at the Louis Bolk Institute, situated in Driebergen, within the project “Kalf bij Koe”. The Louis Bolk Institute is an anthroposophical research institute for organic agriculture, nutrition and health care. Research projects are often carried out in a participatory way, with for example farmers.
I would like to thank my supervisors Jan-Paul Wagenaar from the Louis Bolk Institute and Egbert Lantinga from Wageningen University for their support during my thesis. As well, I would like to thank Jos Langhout for helping me with analyzing the data and all other help. Thanks, to Evert Jan Bakker who helped me with the statistical analysis. And finally, I would like to tank the farmers to provide me the information I needed and to tell me about their experiences with suckling systems.
Judith Vertooren, June 2006
Table of contents
ABSTRACT... 3
PREFACE... 5
TABLE OF CONTENTS... 6
1. INTRODUCTION ... 8
1.1 PROBLEM ANALYSIS... 8
1.2 LITERATURE REVIEW... 8
1.2.1 Suckling as calf rearing method ... 8
1.2.2 Age, live weight at first calving and suckling... 10
1.2.3 Milk production and suckling... 11
1.2.4 Mastitis and suckling... 13
1.2.5 Paratuberculosis and suckling ... 16
1.2.6 Strong and weak points of suckling systems... 17
1.3 RESEARCH GOAL AND BACKGROUND... 18
1.4 RESEARCH QUESTIONS... 18
1.5 HYPOTHESIZES... 19
2. MATERIAL AND METHODS ... 20
2.1 DATA SOURCES... 20
2.2 DESCRIPTION OF THE GROUPS... 21
2.3 FARM DESCRIPTION AND MANAGEMENT... 22
2.3.1 Farm characteristics ... 22
2.3.2 Rearing method ... 23
2.3.3 Suckling of own calf ... 24
2.3.4 Feeding... 25
2.4 DATA ANALYSIS... 26
2.4.1 Age at first calving and live weight ... 26
2.4.2 Milk production... 26
2.4.3 Mastitis ... 27
2.4.4 Paratuberculosis ... 28
2.5 STATISTICAL ANALYSIS... 28
3. RESULTS... 29
3.1 AGE AT FIRST CALVING AND LIVE WEIGHT... 29
3.2 MILK PRODUCTION... 32
3.3 MASTITIS... 34
3.3.1 Mastitis and suckling... 34
3.3.2 Mastitis in relation to milk production ... 36
3.4 MASTITIS STATUS ON BOTH FARMS... 38
3.4.1 Mastitis status... 38
3.4.2 Mean SCC before and during the use of a suckling system ... 39
3.6 COSTS OF THE SUCKLING SYSTEM... 42
3.7 THE VIEW OF THE FARMERS... 44
4.1 AGE AND LIVE WEIGHT AT FIRST CALVING... 45
4.2 MILK PRODUCTION... 46
4.3 MASTITIS... 47
4.4 PARATUBERCULOSIS... 47
4.5 DISEASE TRANSMISSION... 48
4.6 COSTS OF THE SUCKLING SYSTEM... 48
4.7 COMPARABILITY OF THE DATA... 49
5. CONCLUSIONS AND RECOMMENDATIONS ... 50
5.1 CONCLUSIONS... 50
5.2 RECOMMENDATIONS... 52
6. REFERENCES ... 53
ANNEX 1: TREE DIAGRAM ... 56
ANNEX 2: LIVE WEIGHT AT 1 YEAR OF AGE ACCORDING A DIFFERENT METHOD... 56
ANNEX 2: LIVE WEIGHT AT 1 YEAR OF AGE ACCORDING A DIFFERENT METHOD... 57
ANNEX 3: GROSS ANALYSIS AGE AT FIRST CALVING AND LIVE WEIGHT... 58
ANNEX 4: GROSS ANALYSIS MILK PRODUCTION ... 60
ANNEX 5: TEST DAY MODEL ... 61
ANNEX 6: GROSS ANALYSIS MASTITIS INCIDENCE ... 63
1. Introduction
1.1 Problem analysis
The project Kalf bij koe (Calf with cow) started as an initiative of the Louis Bolk Institute (LBI) and some Dutch organic dairy farmers. Both parties felt the need for a change in the conventional calf rearing method, in which calves shortly after birth are separated from their mother. Two dairy farmers introduced a suckling system, in which calves suckled their mother. On both farms data had been collected from suckling and bucket fed calves. Earlier research within the project Calf with cow showed that farmers and experts had high expectations about the long term effects of suckling systems.
Therefore, in this study the effects on the performance of heifers reared in a suckling system compared to heifers reared in a bucket system were investigated. Data from heifers born in 2001, 2002 and 2003 was used. During this study all heifers entered first lactation.
However, data collection had not stopped after 2003. The research will be continued as part of the so called QLIF-project (Quality Low Input Food), funded by the European Union. The QLIF-project aims to improve quality, ensure safety and reduce cost along the organic and "low input" food supply chains. In 2004 on three farms a new start was made to collect data of suckling and bucket fed calves. This study had to develop a method to evaluate data from calves in the QLIF-project.
The study was a continuation of earlier research by Jos Langhout, who investigated the effects of suckling systems in dairy production, Rita van Leeuwen, who studied the growth and development of calves in suckling systems, Gerdien Rouw, who studied the effects of suckling on the somatic cell count of suckling cows and Jasper Herbrink, who collected information about suckled and bucket fed calves in a database.
1.2 Literature review
1.2.1 Suckling as calf rearing method
Suckling systems
In modern dairy farming bucket feeding is the most common used method of calf rearing. Calves are fed with fresh, waste or artificial milk from an open or teat bucket. Reasons why calves are removed from their mother is to control the milk consumption, leaving more saleable milk for the farmer, and concern for disease transmission (Paratuberculosis). With a bucket feeding system there is minimal contact between cow and calf, and it leaves no room for maternal behavior. A more natural calf rearing system is the use of a suckling method, in which mother and calf can show their natural behavior (Krohn, 2001) .
There are different suckling methods, in which calves suckle their mother or a nurse cow until they are weaned. The following suckling methods can be distinguished:
§ Single suckling with additional milking. After the colostrum period the calf is introduced with its mother in the dairy herd. The milk consumption is ad libitum, the cow is milked twice a day mechanically.
§ Multiple suckling without additional milking. The calf is placed by a nurse cow with 2-4 other calves. The nurse cow is housed separate from the dairy herd. The milk consumption of the nursed calves is restricted by the number of calves under each nurse cow. The nurse cow is not milked mechanically (Langhout and Wagenaar, 2004).
Combinations of single and multiple suckling are used as well. Calves are weaned after approximately three months, because the organic standards describes a period of 3 months to provide the calf milk. In conventional systems calves are often weaned at about 7-8 weeks of age.
The highest costs of the suckling system is the milk consumption by the calves. In single suckling systems milk consumption of calves is up to 10kg milk per day per calf in the first 14 days and up to 15kg in the period thereafter. In multiple suckling the consumption varies between 5 to 10kg per day (Langhout, 2003). The costs of a suckling system on a farm with 70 cows and an annual replacement percentage of 25%, milk consumption adds up to 8 to 12.5 thousand kg of milk annually. This is the same as the lactation production of 1.5 to 2 cows (Langhout and Wagenaar, 2004). In conventional calf rearing systems, when artificial milk is used, calves are fed with 1.5 to 2.5liter of artificial milk. For cow milk 4liter a day is advised (Anonymous, 1997).
Suckling and the health of the calf
A suckling period after calving gives the calf a good chance of obtaining colostrum by suckling. Sufficient colostrum uptake is usually decreasing the mortality rate of calves (Krohn, 2001). Moreover, suckling calves are exposed to the farm specific pathogens. Both, colostrum and milk contains important antibodies for the immune system of the calf (Ryle and Orskov, 1990).
Moreover, suckling improves the welfare of the calves. When using a suckling system milk is provided at an optimal temperature to the calf and with minimum changes of contamination. Many experiments show that mortality rate in suckling calves is low. In the experiment of Fulkerson et al. (1978) none of the 30 calves died. Preston (1973) did trials involving many thousand of calves which received milk and supplementary feed. The mortality of single suckled calves was 5.2%, the mortality of bucket fed calves was 12.3%. Also, intestinal parasites were more common in bucket fed calves. Presumably, non-fatal as well as fatal infections also develop less frequently in suckled calves (Ryle and Orskov, 1990).
Langhout (2003) observed that calves had a higher daily weight gain than bucket fed calves. This confirms the results of other researchers (Everitt and Phillips, 1971; Bar-Peled et al., 1997; Mejia et al., 1998).
Behavior
Suckling systems are more beneficial to the welfare of calves than artificial rearing systems. The calf will be nursed by its mother, suckle milk, learn to eat roughage, have social contact with other calves and have space enough to play and exercise (Krohn, 2001).
An example of behavior problems in conventional systems is cross-suckling. When a calf gets his milk offered in a bucket or teat-bucket, this will not always satisfy the calf’s motivation to suckle. An unfilled suckling need can lead to cross-suckling where calves suck the ears, tail and navel of other calves (Krohn, 2001). However, also in suckling systems some problems may arise. At an age of about three months the calves are weaned, mother and calf will be separated. Weaning at three months of age is much earlier than under natural conditions (8-12 months). After separation both cow and calf will vocalize a lot for some days. In contrast, separation after a short term suckling period does not appear to be traumatic for calf or cow (Krohn, 2001).
Calves not used for replacement
About 25% of the calves stay on the farm to replace the herd. All other calves (also from organic farms) are sold to the conventional beef producing industry. With this present system the production chain is not closed, organic produced calves and calves that suckled their mother end up in the conventional sector. In this way the calves do not get the value they deserve. Moreover, this system is not transparent which brings confusion to the consumers. To tackle this problem two research farms (Praktijkcentrum Aver Heino and Biologisch
Proefbedrijf Droevendaal) carry out the project Stierkalf waardig. This project seeks for an
animal friendly solution
to rear organic calves. In a research recently carried out by Bech Sàbat (2005) at the Droevendaal farm, artificial calf rearing systems were compared with suckling systems. It was concluded that suckling can be a good and cheaper option to rear these organic calves.
Beside this project, also farmers themselves are introducing initiatives for problems that arise in rearing calves. To compensate for the increased costs with the use of a suckling system, one of the farmers in this study started Adopteer een kalf (Adopt a calf). Consumers have the possibility to adopt a calf and visit it two times a year during open days. At this moment there are even waiting lists to adopt a calf.
1.2.2 Age, live weight at first calving and suckling
Weight gain
Effects of suckling on age and live weight at first calving
In an experiment conducted by Bar-Peled et al. (1997) it was shown that increased growth due to suckling could lead to a higher milk production during first lactation, compared to bucket feeding. Calving age was significant earlier for heifers that had been allowed to suckle, because calves earlier reach an acceptable live weight at which the farmers decide to inseminate the calf.
The study of Van Leeuwen (2004) showed that suckled calves reached a higher live weight at an age of one year, compared to bucket fed calves. This indicated that suckling may lead to a lower age and/or a higher live weight at first calving. This might result in a reduction of rearing costs, due to a shorter rearing time and higher milk production during first lactation. A lower age at first calving can decrease replacement costs of the herd. On the other hand durability and a higher live production can also decrease replacement costs.
It is most optimal to wean Holstein Frisian calves after they reached a live weight of 80kg. Time of first heat of calves lays between 10 and 13 months. They can be inseminated from an age of 15 months (CR-Delta, NRS, 2005). It is recommended by the NRS to inseminate after the calf reaches a live weight of at least 375kg. A lower live weight can have negative effects on future milk production (CR-Delta, NRS, 2005). From an economic point of view an age at first calving of 24 months with a bodyweight of 575kg is recommended (Scheppingen, et al., 1999). The mean Dutch heifer is calving at an age of 26 months (Elbertsen, 2004). But the average age at calving of heifers at organic farms is higher than on conventional farms.
A lot of studies on the effect of live weight and age at first calving have been conducted. Essentially all studies demonstrate that live weight at calving, and not age, has a significant effect on first lactation milk yield. The live weight of a cow is influenced by its age, genotype and the environmental conditions under which its raised. Environmental conditions which are conductive to large size also contribute to high levels of production (Clark and Touchberry, 1962). According to, Fisher et al. (1983), also heritability has a significant influence on calving weight and on milk yield as well.
1.2.3 Milk production and suckling
Effect on the suckle cow
Several studies show that suckling can increase milk production of the suckled cow (Peel et al 1979; Thomas et al. 1981; Meija et al.,1998; Bar-Peled et al., 1995). Milk production is believed to be enhanced due to teat stimulation performed by the calf (Bar-Peled et al., 1995) and the increased degree of udder emptying when the calf suckles the residual milk after milking (Sandoval-Castro et al., 2000). An empty udder has a stimulating effect on the alveoli to excrete milk. Increased milk yield can also be related to an improved udder health when cows are suckled (Meija et al.,1998).
In some trials in which suckling enhanced milk production, other effects on the cows were observed as well:
§ suckling may prolong lactation; In several investigations, milk production by cows suckled for up to 12 weeks continued to exceed that of control animals for some time, even after weaning (Kaiser, 1975; Fulkerson et al. 1978; Peel et al. 1979), although some results do not confirm this (Thomas et al. 1981);
§ Suckling may prolong anoestrus. In a 8 weeks suckling experiment, in which cows suckled twice daily, the interval of post-partum anoestrus increased by about 6 days for each additional week of suckling. It is desirable that cows exhibit a first oestrus within 38 days of calving. Although the mean post-partum anoestrus interval of the cows in this experiment was approximately 66 days. A prolonged post-partum anoestrus interval is likely to result in an extended calving interval (Thomas et al, 1981). The two farmers in this study did not experienced any problems with extended calving-to-calving intervals until now. Probably, this has to do with the use of nurse cows. Calves suckle their own mother for a short period. Margerison et al. (2002) found that less impact on the cows’ reproductive occurs if the calves have access to all the cows for suckling than if each cow only suckles her own calf;
Milk fat percentage and milk protein percentage of saleable milk are not influenced by suckling (Thomas et al, 1981; Fulkerson et al., 1978; Peel et al., 1979). But in case of restricted suckling, when calves are allowed to suckle after milking, the residual milk that is suckled by the calf is higher in fat and protein contents (Mai Van Sanh, et al., 1997).
Literature is not clear about the effect of suckling on live weight change of the suckled cow. Thomas, et al (1981) and Fulkerson et al. (1978) found that suckling does not affect live weight change in Frisian cows. However, according to, Margerison et al. (2002) cows that suckled a calf lost more weight and body condition than cows whose calves were artificial reared.
Effect on future milk production of the calf
Beside the effect of suckling on the milk production of the suckle cow, suckling can have an impact on the calf’s future milk producing capacity. Heifers that had been allowed to suckle have a tendency for a greater milk production than calves fed artificial milk (Bar-Peled et al., 1997). This has to do with a positive correlation between live weight at calving and milk production during first lactation. A higher live weight at calving can increase the first lactation milk yield. A rough indication is every kg extra live weight is providing 10kg extra milk yield during first lactation (Elbertsen, 2004).
Lactation curves
A normal lactation curve starts high shortly after calving, is then increasing to a peak production followed by a slowly decrease to the end of the lactation. In Figure 2, the average lactation curve for organic farms from the project Bioveem and the average lactation curve for conventional farms from the project Koeien & Kansen is shown. Bioveem is a Dutch project between 17 organic dairy farmers and several institutes. Koeien & Kansen is a Dutch project of 17 conventional dairy farmers and several institutes. In both projects the farms are monitored for several years.
[image:13.596.71.370.255.440.2]The peak production of cows at organic farms is reached after 5 to 6 weeks and is around a level of 29kg milk. This peak production is about 6kg (or 20%) lower than for cows at conventional farms. At the end of the lactation the average production of organic cows is 15kg, which does not differ much from conventional farms (Smolders, 2006).
Figure 2 Standard lactation curve for cows at organic farms (average from the project Bioveem) and cows at conventional farms (average from the project Koeien & Kansen)
(source: Smolders, 2006)
There are many factors which are influencing the lactation curve of a cow. According to, NRS (2005) (i) older cows are producing more milk in the first part of the lactation compared to heifers, (ii) multi parous cows often have a higher milk production than heifers, (iiii) calving season is affecting milk production by seasonal effects (mainly through nutrition and climate). In general, cows that calf in October have a higher milk production than cows calving in April. Cows calving in autumn generally have a lower peak production, but the production stays longer on a higher level when fresh pasture becomes available in spring (NRS, 2005).
1.2.4 Mastitis and suckling
Mastitis
Mastitis pathogens can be categorized into environmental and contagious pathogens. Environmental pathogens are present in the environment (manure, bedding and soil). Contagious pathogens can infect other cows during the milking process.
SCCs (somatic cell counts) for individual cows above 250,000 cells per ml are seen as critical (Smolders and Baars, 2004). For heifers SCC is generally lower than for multi parous cows. Therefore, SCCs for heifers without mastitis is lower than 200,000 cells per ml (Smolders and Baars, 2004).
[image:14.596.75.385.290.477.2]A normal SCC curve starts off high shortly after calving, decreases in the first 50-60 days to the lowest level and increases slowly from then on towards the end of the lactation (De Haas, 2003). The slowly increase in SCC is caused by a diluting effect when milk yield is high (NRS, 2005). A normal curve is given in Figure 3.
Figure 3 Standard SCC curve for both heifers and multi parous cows (De Haas, 2003)
Tank milk SCC gives an overview on the total udder health on the farm. SCCs for tank milk have to be below 400,000 cells per ml. Above this level farmers are discounted in the price they receive for the milk.
The average tank milk SCC on organic farms is higher than on conventional farms. In a study by Nauta et al. (2005), the consequences of converting to organic dairy farming for SCC were investigated. The results showed a significant effect of conversion on SCC. Surprisingly, SCC did not stabilize after some years but increased even 6 years after conversion. According to, Nauta (2000) organic farmers don’t see this increased SCC as a problem. It is a logical consequence of the organic system in which the immune system becomes more active and average age of the cows is higher.
The use of antibiotics to treat mastitis and to dry off cows is only limited allowed in organic farming and not allowed in biodynamic farming (Van de Mortel, 2004). Mastitis can be treated with the use of homeopathic or phytotherapeutic preparations.
Effects of suckling on mastitis
SCC (/1000
cells/
ml)
Days in milk
— = multiparous
1.2.5 Paratuberculosis and suckling
Paratuberculosis
Paratuberculosis or Johne's disease is a chronic disease that causes considerable production losses in adult cattle. The disease is caused by Mycobacterium Paratuberculosis. This bacterium causes an inflamed intestinal tract that results in severe weight loss and diarrhoea (Rice, 1990). New infections usually occur when young calves are exposed to a contaminated environment and ingest the organism by licking or sucking the mother cows’ udder or vulval area (Rice, 1990). Also other ruminants on the same farm may have the disease. Paratuberculosis occurs in goats and occasionally in sheep. The disease can even be spread by feed (silage) and surface water (GD, 2006). Although, infection starts in early life and new infections are unlikely after six months of age, clinical signs of Paratuberculosis rarely appear until cattle is 2 years old. The peak incidence occurs at 4 to 7 years, but some cases are found in cattle as old as 15 years (Weaver, 2005). Paratuberculosis has considerable economic consequences. Losses are mainly due to decreased milk
production and increased cow replacement costs. Calculations done in 2000 showed that economic losses in the Netherlands caused by Paratuberculosis were € 20 million per year (GD, 2006).
Human can suffer from a disease, called Crohn, that is causing a chronic inflammation of the intestine as well. Possibly, Crohn’s disease in human and Paratuberculosis in animals is caused by the same organism. There is still no evidence if there is a relation between the two diseases (Anonymous, 2006).
Suckling and Paratuberculosis
Suckling as rearing system for dairy calves has many positive aspects. However, suckling systems can be in conflict with measures to secure food quality and disease transmission. One of the threats for a more widely acceptance of the suckling system is Paratuberculosis.
To prevent this disease the GD (Gezondheidsdienst voor dieren/Animal health service for animals) developed a Parawijzer. This Parawijzer contains several measures that are focussing on preventing the distribution of the bacteria. The most important measures are:
§ calves will be separated from their mother immediately after birth; § after the colostrum period, calves should only be fed with artificial milk; § slurry from older cows should not be spread on pastures grazed by young stock; § young cattle should not graze land used by cows within the previous 18 months.
It is clear that most of these measures are conflicting with the use of suckling systems. Part of
the Parawijzer is a checklist with questions. Every question connected to a score. Therefore,
it is expected that farms using suckling systems will have a low score when filling in this checklist. The same problem is true for organic farmers. Organic farms are more susceptible for introducing the disease, because this is inherent to the farm management in organic farming; calves are often fed with cow milk and young stock of three months and older stay outside in the pasture (Brouwer et al., 2004).
1.2.6 Strong and weak points of suckling systems
To conclude the literature review, an overview of the strong points of suckling systems is given:
§ Improved welfare and naturalness; welfare of the cows is increased by suckling, because it leaves room for maternal behaviour. Suckling systems are beneficial to the welfare of the calves, calves will be nursed by their mother, suckle milk, learn to eat roughage at a younger age, have social contact to other calves and have space enough to exercise and play (Krohn, 2001); § Improved health of the calves; calves have a good colostrum and milk intake. Milk contains
antibodies that are present in the local environment and which are important for the immune system of the calf (Ryle and Orskov, 1990). The milk will be provided to the calves at an optimal temperature and with minimum changes on contamination;
§ A low calf mortality (Ryle and Orskov, 1990);
§ Increased milk production of suckler cows (Peel et al 1979; Thomas et al. 1981; Meija et al.,1998; Bar-Peled et al., 1995);
§ Improved udder health. There is a lower mastitis incidence in suckler cows (Mejia et al., 1998); § Calves allowed to suckle have a higher daily weight gain (Langhout, 2003). At an age of one
year, suckled animals are heavier than bucket-fed calves. This indicates that suckling may lead to a lower age and/or live weight at calving. This might result in a reduction of rearing costs and higher milk production (van Leeuwen, 2004);
§ Less labour and an increased working pleasure (Langhout, 2003);
§ Keeping calf and cow together has a positive image for the consumer (Langhout 2003); § Increased naturalness (Langhout 2003).
The suckling system has the following weak points:
§ The guidelines which are used by the GD to prevent Paratuberculosis are not in line with the use of suckling systems (Brouwer et al., 2004);
§ The farmer has less control on the uptake of colostrum;
1.3 Research goal and background
Research goal:
To investigate the effects on the performance of heifers reared in a suckling system compared to heifers reared in a bucket system.
Research goal background:
Focus was on the parameters: age and live weight at first calving, milk production and mastitis incidence. Besides, Paratuberculosis was getting attention in this study, because the use of suckling systems might increase the risks on occurrence of the disease.
1.4 Research questions
General research question:
What are the effects on performance of heifers reared in a suckling system compared to heifers reared in a bucket system?
The research question was analyzed by making a tree diagram (Annex 1). Under mentioned are the sub-questions that were extracted from the tree diagram:
1) How do heifers reared in a suckling system perform in terms of milk production, age at first calving, live weight at first calving and mastitis incidence compared to heifers reared in a bucket system?
a) Can age at first calving be reduced for heifers reared in a suckling system?
b) Do heifers reared in a suckling system reach a higher live weight at first calving, when calving at a comparable age, compared to heifers reared in a bucket system?
c) Is a higher live weight at first calving resulting in a higher milk production during first lactation?
d) Does the shape of the lactation curve of heifers reared in a suckling system show any remarkable aspects compared to heifers reared in a bucket system?
e) Is mastitis (a SCC above the critical norm) seen less frequently in heifers reared in a bucket system compared to heifers reared in a bucket system?
f) Does the SCC patterns differ for heifers reared in a suckling system compared to heifers reared in a bucket system?
2) What is the current status of mastitis on both farms?
1.5 Hypothesizes
§ Heifers reared in a suckling system will reach a higher live weight, at a comparable age, than those reared in a bucket system.
§ Usually farmers use live weight as an indicator to inseminate or introduce the calf to the bull. This means heifers reared in a suckling system can be inseminated or introduced to the bull at a younger age compared to heifers reared in a bucket system. Therefore, age at first calving can be lower for heifers reared in a suckling system. Alternatively, heifers reared in a suckling system will have a higher live weight at first calving, than those reared in a bucket system. A higher live weight at first calving can results in a higher first lactation milk yield.
§ Heifers reared in a suckling system will perform better in terms of mastitis incidence compared to heifers reared in a bucket system.
2. Material and methods
2.1 Data sources
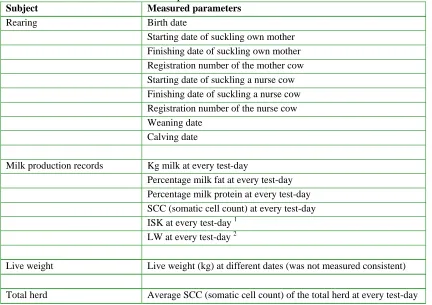
[image:20.596.65.497.261.566.2]On two farms, Farm 1 (farm Vrolijk) and Farm 2 (farm Langhout), data have been collected during the period 1-1-2002 until 31-12-2005 and stored in Microsoft Office Access 2003. The database consisted of information on the used rearing system, calving dates, milk production and live weights. Table 1 gives an overview of the measured parameters. Not all parameters were measured consistent. The database with the original data is available at the Louis Bolk Institute.
Table 1 Overview of the measured parameters
Subject Measured parameters
Rearing Birth date
Starting date of suckling own mother Finishing date of suckling own mother Registration number of the mother cow Starting date of suckling a nurse cow Finishing date of suckling a nurse cow Registration number of the nurse cow Weaning date
Calving date
Milk production records Kg milk at every test-day
Percentage milk fat at every test-day Percentage milk protein at every test-day SCC (somatic cell count) at every test-day ISK at every test-day 1
LW at every test-day 2
Live weight Live weight (kg) at different dates (was not measured consistent)
Total herd Average SCC (somatic cell count) of the total herd at every test-day
1.ISK (Individuele Standaard Koeproducties/Individual Standard Productions per cow). The ISK value is a parameter which is calculated every test-day for cows between 5 and 305-days in lactation. It is a standard for the mean daily kg of produced milk for a cow with an age of 69-92 months, that calved in February/March and is in day 50 of the lactation (NRS, 2005).
2.2 Description of the groups
This research evaluated data, from heifers reared in a suckling system and heifers reared in a bucket system, of two organic farms. In total data of 133 suckling and bucket fed calves had been collected.
Only data of female calves, that stayed on the farm and already entered first lactation, was used. Therefore, data of 72 heifers were analyzed. The 72 heifers were divided into 7 groups (Table 2). A code was given to every group; suck2002 -1 means suckling heifers born in 2002 on Farm 1, buck2002 –1 means bucket heifers born in 2001 on Farm 1, suck2002 –2 means suckling heifers born in 2002 on Farm 2, etc.
Table 2 Number of female calves of which data were collected and had already entered first lactation
Farm 1 Farm 2
Group Number of calves: Group Number of calves:
Suck 2002 -1 13 1 Suck 2002 -2 7 4
Suck 2003 -1 6 2 Suck 2003 -2 6 5
Buck 2001 -1 14 3 Buck 2001 -2 16 6
Buck 2002 -2 10 7
1. From total 14 suckling calves 1 was sold
2. From total 12 suckling calves, 1 was sold, 1 died, 2 were male, from 2 milk data were not available yet. 3. From total 14 bucket fed calves, none was missing
4. From total 13 suckling calves, 3 died, 1 was sold because of udder problems, one was sold halfway the lactation, and from 1 milk data were not available yet
5. From total 39 suckling calves, 1 died, 16 were male, 7 were sold, from 9 milk data were not available yet 6. From total 18 bucket fed calves, 1 was sold, from 1milk data were not available yet
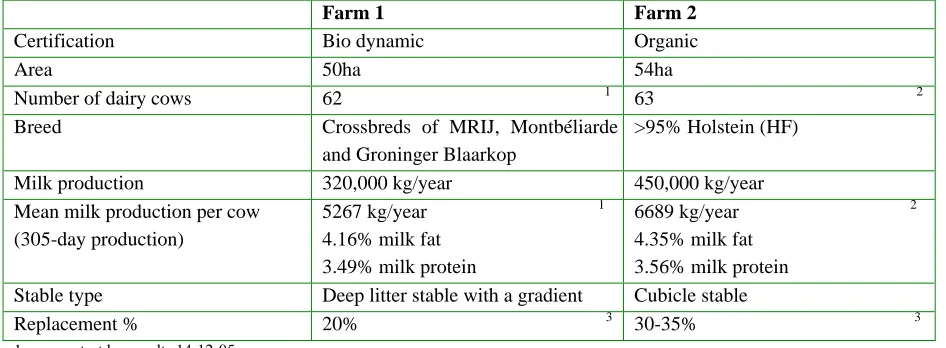
2.3 Farm description and management
2.3.1 Farm characteristics
Farm 1 was a biodynamic farm, and Farm 2 was certified organic. The total farm area and number of dairy cows on both farms were more or less similar (Table 3). Both farms differed a lot in used breed, total milk production and farm management. Farm 1 used crossbreds of MRIJ with Montbéliarde and an increasing number of Groninger Blaarkop. On this farm cows were not dehorned. When crossing with a Montbéliarde bull, the horns of the cows became sharper. When using a Groninger Blaarkop bull the herd was getting more oval shaped horns, which was preferred by the farmer. Most cows on Farm 2 were of the Holstein Frisian breed. This breed produces more milk than the double purpose breeds on Farm 1. Therefore, total milk production on Farm 2 was higher compared to total milk production on Farm 2. On Farm 1, the farmer’s own bull was used in heifers reared in a suckling system and artificial insemination in heifers reared in a bucket system. The farmer’s own bull was a crossbred with mainly Groninger Blaarkop. The bull used for artificial insemination was a 100% Montbéliarde bull. This bull was genetically superior compared to the farmer’s own bull. Farm 2 used artificial insemination with genetically identical bulls. A bull was present on the farm, but was not used for heifers included in this study.
Both farms also differed al lot in stable type. Cows on Farm 1 were housed in a deep litter stable with a gradient. The farmer developed this stable type himself. On Farm 2 a cubicle stable was used.
[image:22.596.64.537.438.612.2]Farm 1 had a lower replacement percentage compared to Farm 2. On average, cows on Farm 1 became older than cows on Farm 2. Hence, less replacement calves were needed on Farm 1.
Table 3 Farm characteristics
Farm 1 Farm 2
Certification Bio dynamic Organic
Area 50ha 54ha
Number of dairy cows 62 1 63 2
Breed Crossbreds of MRIJ, Montbéliarde
and Groninger Blaarkop
>95% Holstein (HF)
Milk production 320,000 kg/year 450,000 kg/year
Mean milk production per cow (305-day production)
5267 kg/year 1 4.16% milk fat
3.49% milk protein
6689 kg/year 2 4.35% milk fat
3.56% milk protein Stable type Deep litter stable with a gradient Cubicle stable
Replacement % 20% 3 30-35% 3
1. source: testday results 14-12-05 2. source: testday results 10-12-05
2.3.2 Rearing method
Both farms developed their own suckling system, adapted to their farm management. As a result, the suckling system was developing over time. The used systems are explained below.
Farm 1
Only replacement calves (which were born in summer) were reared in a suckling system. The calves stayed outside with their mother, until it became autumn and stable period was starting (after approximately 2 months). The calves had an ad libitum milk uptake when suckling their mother. The mother cow was not milked. When stable period was starting, 1 to 3 calves were placed with a nurse cow (depending on the milk production of the cow) for the duration of approximately 1 month. The nurse cow and calves were housed separately from the herd. The nurse cow was not milked.
Male calves and female calves that did not stay on the farm were bucket fed and housed in single pens.
Farm 2
All calves were reared in a suckling system. Calves that were born in 2002 suckled their mother for a period of approximately two months. A few days after birth the mother cow and calf were introduced into the herd. The calves had free access to suckle their mother ad libitum. The mother cow was mechanically milked. After the two months period, 1 to 3 calves were placed together with a nurse cow, for the duration of approximately 1 week. Several nurse cows and calves were placed together in a pen, separated from the herd. Placing a calf with a nurse cow was limiting the milk uptake per calf and the weaning went more gradually. The nurse cows were not milked.
The periods that calves suckled their mother or a nurse cow differed between the groups. Calves in group suck2002 -2 suckled a nurse cow for a significant shorter period compared to the other suckling calves. Not all calves were weaned after exactly 3 months (90 days). On Farm 1, no significant difference in age at weaning was found. Weaning age of the different groups on Farm 2 differed significantly (Table 4).
Table 4 Rearing methods of the 7 groups
Farm 1 Farm 2
Treatment Suck2002-1 Suck2003-1 Buck2001-1 Suck2002-2 Suck2003-2 Buck2001-2 Buck2002-2 Mean S.E.M. Mean S.E.M. Mean S.E.M. Mean S.E.M. Mean S.E.M. Mean S.E.M. Mean S.E.M.
N 13 6 14 7 6 16 10
Suckling mother (days)
56a 6.3 50 a 4.4 n.d. n.d. 63 a 2.8 55 a 2.2 n.d. n.d. n.d. n.d.
Suckling nurse cow (days)
33 a 8.1 43 a 4.6 n.d. n.d. 6b 1.9 38 a 4.0 n.d. n.d. n.d. n.d.
Age at weaning (days)
88 a 3.9 93 a 2.6 92 a 0.2 69b 3.4 93 a 6.6 90 1 n.d. 117c 4.3
a,b
Within a row, means without a common superscript differ (P<0.05). S.E.M.: Standard Error Mean
n..d..: not determined
1. Age at weaning of group Buck 2001 -2 was not measured. An assumption was made.
2.3.3 Suckling of own calf
2.3.4 Feeding
Farm 1
Suckling and bucket fed calves did not receive concentrates until weaning. Until 3 months of age calves were fed with ad libitum grass-clover silage. Or, during summer when the herd went outside during day and night, ad libitum grass. After weaning, calves were housed in straw pens separately from the herd. They received 1 kg concentrates per calf and ad libitum grass-clover silage until 12 months of age. After 12 months calves only received ad libitum grass-clover silage.
In summer, milking cows stayed in the pastures (mixture of grass/clover) during day and night. In winter, milking cows were fed ad libitum grass-clover silage of a good quality. During summer and winter, additional concentrates were fed in the milking parlour (roughly 2kg pelleted grass and 2kg flaked wheat per cow/day). During autumn, some additional whole plant silage was fed (summer barley from own farmland). This was fed to prevent urea levels in milk and blood becoming to high when cows were fed on late summer grass, which is rich in protein.
Farm 2
Suckling and bucket fed calves did not receive concentrates until weaning. Until 3 months of age calves were fed with ad libitum grass-clover silage. Or, during summer when the herd went outside during day and night, ad libitum grass. From 3-5 months of age calves received about 1kg of additional concentrates. From 5-12 months only ad libitum grass-clover silage was fed.
2.4 Data analysis
Both farms differed a lot in used breed, total milk production and farm management. Therefore, comparisons were made within farms. Results of both farms were presented in separate tables.
The heifers in the different groups differed in year of birth, periods of suckling and breeding management. For that reason, data was analyzed and presented per group.
2.4.1 Age at first calving and live weight
Age at first calving was calculated as the difference between the calving date and the calf’s birth date. Live weight of heifers reared in a suckling system was compared to heifers reared in a bucket system. Live weight at first calving was not available in this study. As alternative, an overview of the weight development of the calves was given.
At time of weighing, cows were often not of exactly the same age. For that reason, measured live weights were adjusted to 6 age classes:
§ Birth (0 days) § 2 months (60 days) § 4 months (120 days) § 6 months (180 days) § 1 year (365 days) § 2 years (730 days)
The measured live weights were added to a class and corrected for the right age. For example; a cow with a live weight of 70kg measured at 58 days of age, was adjusted to class “60 days”. The measured live weight at 58 days of age was corrected to an age of 60 days, by adding the missing kilograms gained in the two days (the growth per day in the former class). These corrections were carried out in Microsoft Office Access 2003.
2.4.2 Milk production
Total milk productions of heifers reared in a suckling system were compared to those reared in a bucket system. Only first lactation records were used. In this study, a lot of heifers did not finished their first lactation yet. Hence, total milk productions were not available for all heifers. Therefore, an estimated 305-day milk production was used (305-day productions). After 180 days in milk, the estimated 305-day production has a reliability of 90% (NRS, 2005). In the comparison of total 305-day productions, all heifers with a lactation length >180 days, were taken into account.
Milk productions were standardized to 4% milk fat and 3.3% milk protein, by using the formula:
FPCM (Fat and Protein Corrected Milk) = (0.337 + 0.116 x % milk fat + 0.06 x % milk protein) x
Some heifers on Farm 2 sucked their own calf during first lactation. For these heifers milk data did not represent the actual produced amount of milk. The calf had drunk part of the milk in the beginning of the lactation. The missing production was added to the total amount of milk produced by the heifer. According to, Langhout (2003) a calf will consume 10kg a day in the first 15 days, and in the period thereafter 15kg a day (in case of suckling own mother). An estimate of the amount of milk which was consumed by the calves was made as follows:
§ Male calves or female calves not used for replacement: 15 days x 10kg/day = 150kg (male calves were leaving the farm after 15 days);
§ Female calves born in 2004: 15 days x 10kg/day + 45 days x 15kg/day = 825kg (suckled the mother cow 2 months);
§ Female calves born in 2005: 15 days x 10kg/day + 15 days x 15kg/day = 375kg (suckled the mother cow 1 month).
The NRS is using different parameters to assess milk productions. Beside total milk production, comparisons were made for LW (Lactatiewaarde / Lactation value) and ISK (Individuele Standaard Koeproducties / Individual Standard Productions per cow). These parameters were explained in section 2.1.
2.4.3 Mastitis
The mastitis incidence in heifers reared in a suckling system was compared to that of heifers reared in a bucket system. Number of heifers with a critical SCC within every group was counted. A SCC above 200,000 cells/ml was seen as critical. According to, De Haas (2003) SCC is often high shortly after calving and decreases in the first 50-60 days to the lowest level. Therefore, when counting number of heifers with a critical SCC, only increased SCCs after 50 days in milk were counted.
Also, another method to compare mastitis incidence in suckled and bucket reared heifers was used. Somatic Cell Scores (SCS) of heifers reared in a bucket system were compared to heifers reared in a bucket system. SCSs are log transformed SCCs (Somatic Cell Counts). Log transforming was used because SCC data were abnormally distributed by extreme SCC values that were reached after an infection (up to 2,000,000 cells/ml). De equation of de Haas (2003) was used:
SCS = log2 (SCC/100,000) +3
In Table 5 is shown how SCC values and SCS values are related to each other.
Table 5 Log transformed values for different SCC data
SCC (x 1,000 cells/ml) 25 50 100 200 400 800 1600
SCS 1.0 2.0 3.0 4.0 5.0 6.0 7.0
(source: Rouw, 2004)
The current status of mastitis on both farms was investigated by using the Gezondheidswijzer
“Mastitis”. This is a protocol, developed by the GD (Gezondheidsdienst voor dieren/Animal
health service for animals), to prevent mastitis at farm level.
Graphs were made of the mastitis situation on both farms during several years. Average SCCs of the total herd were used. Tank SCCs were not used, because farmers can influence these results. When tank SCC is close to the 400,000 cells per ml, the farmer can decide to keep the milk of high cell count cows out of the tank.
2.4.4 Paratuberculosis
The farm risks for Paratuberculosis were investigated by using the Parawijzer. This is a protocol developed by the GD to prevent Paratuberculosis in the Netherlands.
2.5 Statistical analysis
3.
Results
3.1 Age at first calving and live weight
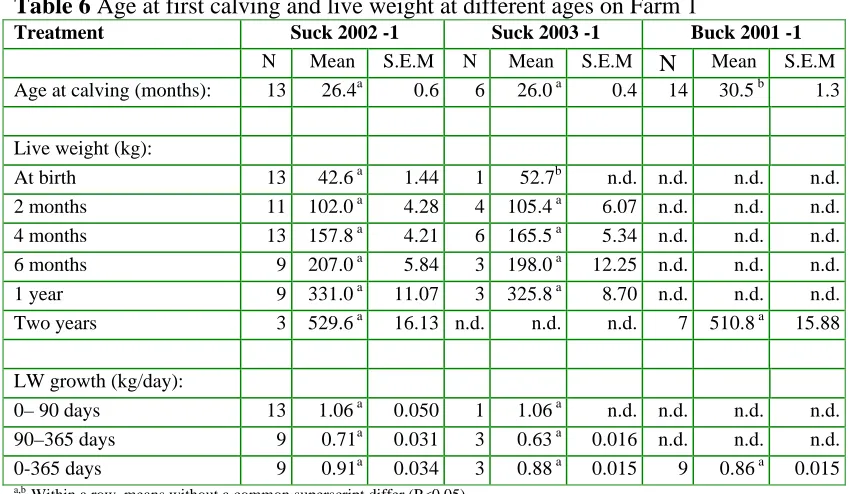
Farm 1
Age at first calving of heifers reared in a suckling system was significant lower compared to heifers reared in a bucket system (Table 6). This result was not unexpected. In the study of Van Leeuwen (2004), it was already found that suckling calves had a higher growth-rate and maintained a higher live weight than bucket fed calves. Therefore, farmer 1 decided to introduce the suckling calves to the bull earlier, than those that were bucket fed.
Growth between heifers reared in a suckling system compared to heifers reared in a bucket system did not differ. No significant difference was found in live weight at two years of age between heifers reared in a suckling system and heifers reared in a bucket system. However, Van Leeuwen (2004) had found a significant difference in live weight between heifers of group suck2002 -1 and buck2001 -1 at an age of 1 year. Thus, calculations were done again according the method of van Leeuwen (2004). Again, it was found that group suck2002 -1 reached a significant higher live weight at one year of age, compared to group buck2001 -1 (Annex 2).
[image:29.596.64.496.402.649.2]No significant differences was found in age at first calving between heifers reared in a suckling system born in 2002 and heifers reared in a bucket system born in 2003. As well, no significant difference was found in growth between this two groups.
Table 6 Age at first calving and live weight at different ages on Farm 1
Treatment Suck 2002 -1 Suck 2003 -1 Buck 2001 -1
N Mean S.E.M N Mean S.E.M N Mean S.E.M Age at calving (months): 13 26.4a 0.6 6 26.0 a 0.4 14 30.5 b 1.3
Live weight (kg):
At birth 13 42.6 a 1.44 1 52.7b n.d. n.d. n.d. n.d. 2 months 11 102.0 a 4.28 4 105.4 a 6.07 n.d. n.d. n.d. 4 months 13 157.8 a 4.21 6 165.5 a 5.34 n.d. n.d. n.d. 6 months 9 207.0 a 5.84 3 198.0 a 12.25 n.d. n.d. n.d. 1 year 9 331.0 a 11.07 3 325.8 a 8.70 n.d. n.d. n.d. Two years 3 529.6 a 16.13 n.d. n.d. n.d. 7 510.8 a 15.88
LW growth (kg/day):
0– 90 days 13 1.06 a 0.050 1 1.06 a n.d. n.d. n.d. n.d. 90–365 days 9 0.71a 0.031 3 0.63 a 0.016 n.d. n.d. n.d. 0-365 days 9 0.91a 0.034 3 0.88 a 0.015 9 0.86 a 0.015
a,b
Within a row, means without a common superscript differ (P<0.05). S.E.M.: Standard Error Mean
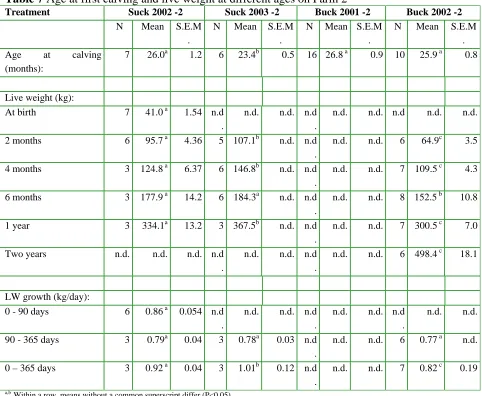
Farm 2
Age at first calving of heifers reared in a suckling system and heifers reared in a bucket system, born in the same year (suck2002 -2 and buck2002 -2), did not differ significantly (Table 7). Heifers reared in a suckling system and born in 2003, had a significant lower age at first calving than heifers reared in a suckling system and born in 2002 (P = 0.039).
Heifers reared in a suckling system had a higher growth than bucket reared heifers. Heifers of group suck2002 2 reached a significantly higher live weight than heifers of group buck2002
-2 at -2,4,6 months and 1 year of age. Growth from 0-365 days of group suck2002 -2 was
significant higher than growth of group buck2002 –2 (P= 0.014).
[image:30.596.66.548.275.671.2]Heifers of group suck2003 –2 had a higher live weight at an age of 2, 4 months and 1 year, than heifers of group suck2002 -2). Growth from 0-365 days of group suck2003 –2 was higher than growth of group suck2002 –2 (P= 0.052, nearly significant).
Table 7 Age at first calving and live weight at different ages on Farm 2
Treatment Suck 2002 -2 Suck 2003 -2 Buck 2001 -2 Buck 2002 -2
N Mean S.E.M .
N Mean S.E.M .
N Mean S.E.M .
N Mean S.E.M . Age at calving
(months):
7 26.0a 1.2 6 23.4b 0.5 16 26.8 a 0.9 10 25.9 a 0.8
Live weight (kg):
At birth 7 41.0 a 1.54 n.d .
n.d. n.d. n.d .
n.d. n.d. n.d n.d. n.d.
2 months 6 95.7 a 4.36 5 107.1b n.d. n.d .
n.d. n.d. 6 64.9c 3.5
4 months 3 124.8 a 6.37 6 146.8b n.d. n.d .
n.d. n.d. 7 109.5 c 4.3
6 months 3 177.9 a 14.2 6 184.3a n.d. n.d .
n.d. n.d. 8 152.5 b 10.8
1 year 3 334.1a 13.2 3 367.5b n.d. n.d .
n.d. n.d. 7 300.5 c 7.0
Two years n.d. n.d. n.d. n.d .
n.d. n.d. n.d .
n.d. n.d. 6 498.4 c 18.1
LW growth (kg/day):
0 - 90 days 6 0.86 a 0.054 n.d .
n.d. n.d. n.d .
n.d. n.d. n.d .
n.d. n.d.
90 - 365 days 3 0.79a 0.04 3 0.78a 0.03 n.d .
n.d. n.d. 6 0.77 a n.d.
0 – 365 days 3 0.92 a 0.04 3 1.01b 0.12 n.d .
n.d. n.d. 7 0.82 c 0.19
a,b
Within a row, means without a common superscript differ (P<0.05). S.E.M.: Standard Error Mean
n.d.: not determined, because not enough data were available
Gross analysis
age at first calving of the suckled groups was significant lower compared to the bucket groups. No difference was found in growth. Age at calving on Farm 2 was significant lower for the suckled groups compared to the bucket groups. Growth was significant higher for the bucket groups.
Impression of growth
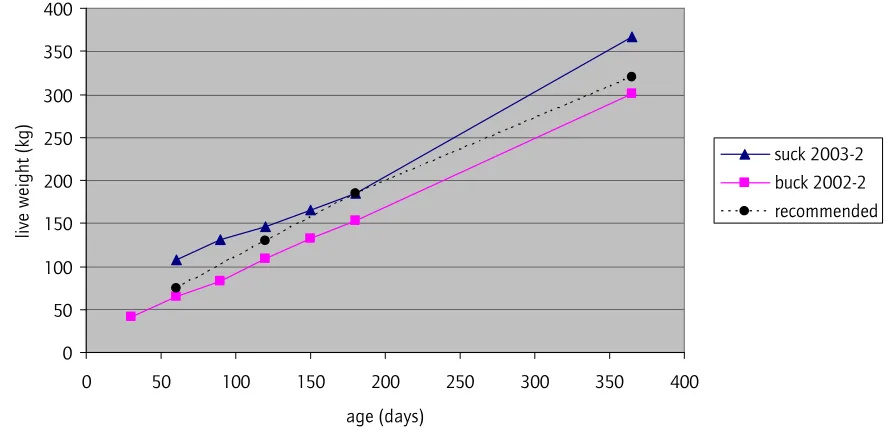
All heifers, reared in a suckling system, had a higher growth compared to heifers reared in a bucket system. The fastest and slowest growing group were both found on Farm 2. Heifers in group suck2003 -2 had the highest average growth of all groups included in this study (Figure 8). Their growth was even higher than recommended. Particularly, live weight at 1 year of age was much higher than recommended. Heifers within group buck2002 -2 had the slowest average growth of all groups. Their growth was lower than recommended
0 50 100 150 200 250 300 350 400
0 50 100 150 200 250 300 350 400 age (days)
live weight (kg)
[image:31.596.77.521.357.574.2]suck 2003-2 buck 2002-2 recommended
3.2 Milk production
Farm 1
An overview of the milk production records is given (Table 8). To obtain a reliable 305-day milk prediction, only heifers with a lactation length of at least 180 days, were taken into account. None of the heifers in group suck2003 -1 fulfilled this requirement.
[image:32.596.64.526.265.414.2]The suckled group (suck2002 -1) and bucket group (buck2001 -1) were not fully comparable, because heifers in both groups were born in different years. Although, it was found that total milk production of heifers in the suckled group was significant lower compared to the heifers in the bucket group (P =0.0035). As well, milk fat (P =0.0125), milk protein (P =0.0005) and LW (P =0.013) were significant lower for heifers in the bucket group.
Table 8 Overview of milk production records on Farm 1
Treatment Suck 2002 -1 Buck 2001 -1
Mean S.E.M. Mean S.E.M.
N 1 12 14 Total milk production, 305-day (kg)
2
4,669a 190.2 5,368b 149.2
Milk fat, 305-day (kg) 190a 7.6 211b 5.2
Milk protein, 305-day (kg) 154a 5.4 184b 5.6
DIM (days in milk) 308a 17.2 314a 19.8
LW 102a 3.4 112b 2.9
Age at calving (months) 25.8a 0.3 30.5b 1.3
a,b Within a row, means without a common superscript differ (P<0.05).
S.E.M.: Standard Error Mean
Farm 2
On farm 2, no significant differences were found within milk production, milk fat, milk protein, LW or ISK of heifers reared in the suckled groups and heifers reared the bucket groups (Table 9). DIM (days in milk) of both groups was not comparable, because not all heifers had finished their lactation yet.
Table 9 Overview of milk production records on Farm 2
Treatment Suck 2002 -2 Suck 2003 -2 Buck 2001 -2 Buck 2002 -2 Mean S.E.M. Mean S.E.M. Mean S.E.M. Mean S.E.M. N 1 6 4 16 10
Total milk production, 305-day (kg)2 6,296a 273.7 5,546a 551.5 6,246a 302.1 6,088a 331.3 Milk fat, 305-day (kg) 252a 12.3 218a 25.0 256a 13.1 231a 18.5 Milk protein, 305-day (kg) 207a 10.0 176a 19.5 208a 9.6 186a 11.2 DIM (days in milk) 343a 30.0 212b 7.8 368c 19.3 401ac 33.3
LW 105a 5.0 99a 9.7 103a 4.15 94a 6.4
ISK 33.9a 1.3 31.0 a 2.7 33.7 a 1.6 31.1a 2.4
Age at calving (months) 25.3 a 1.1 23.0 b 0.5 26.8 a 0.9 25.9 a 0.8
a,b Within a row, means without a common superscript differ (P<0.05).
S.E.M.: Standard Error Mean
1. Only heifers with a lactation length > 180 days were taken into account 2. Milk production based on FPCM
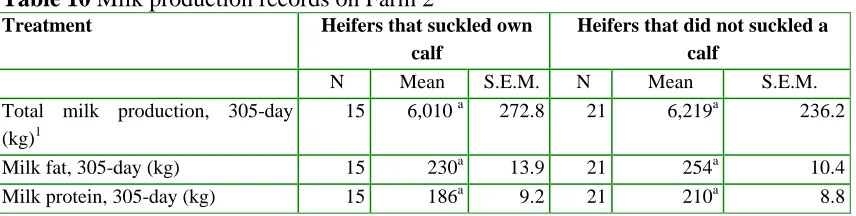
Suckling of own calf
[image:33.596.70.498.473.581.2]The milk production of heifers on Farm 2, that were reared in a suckling system and suckled their own calf, was compared to heifers on Farm 2, that were reared in a suckling system and did not suckled a calf (Table 10). No significant differences were found in milk production, kg milk fat or kg milk protein.
Table 10 Milk production records on Farm 2
Treatment Heifers that suckled own
calf
Heifers that did not suckled a calf
N Mean S.E.M. N Mean S.E.M.
Total milk production, 305-day (kg)1
15 6,010 a 272.8 21 6,219a 236.2
Milk fat, 305-day (kg) 15 230a 13.9 21 254a 10.4
Milk protein, 305-day (kg) 15 186a 9.2 21 210a 8.8
Only heifers with a lactation length > 180 days were taken into account
a,b Within a row, means without a common superscript differ (P<0.05).
S.E.M.: Standard Error Mean 1. Milk production based on FPCM
Gross analysis
The results of the 4 different groups did not give a quick impression about the performance of heifers reared in a suckling system compared to heifers reared in a bucket system. Therefore, a gross analysis was given in Annex 4. Both suckled groups were compared to both bucket groups. On Farm 1 bucket groups had a higher milk production compared to suckled groups. No significant differences in milk production records were found on Farm 2.
Predicted 305-day milk productions that were expected on genetically information of the heifers, were compared to actual produced 305-day productions (Annex 5). Remarkable, heifers that suckled their own calf did not have a lower 305-day milk production than expected.
3.3 Mastitis
3.3.1 Mastitis and suckling
Farm 1
[image:34.596.67.330.300.402.2] [image:34.596.68.380.499.557.2]A high percentage of heifers in group suck2002 –1 had an increased SCC during first lactation (Table 11). From the total number of times the critical norm was exceeded it can be seen how many times high SCCs were returning after recovery. High SCCs were often returning in group suck-2002 –1.
Table 11 Percentage high SCC cows and total number of times the critical norm (>200.000 cells/ml) was exceeded on Farm 1
N % high SCC cows
Total number of times critical
norm was exceeded
Suck 2002 -1 13 69% 15
Suck 2003 -1 6 0% 0
Buck 2001 -1 14 29% 5
SCSs of heifers in the suckled group (suck 2002 -1) and the bucket group (buck 2001-1) were not fully comparable, because heifers in both groups were born in different years. Although, a higher SCS was found for heifers in the suckled group (P = 0.026); (Table 12). A SCS above 4.0 was seen as critical (comparable with a SCC of 200,000 cells/ml). The mastitis situation of heifers in the suckled group was critical during first lactation.
Table 12 Mean SCS on Farm 1
Treatment Suck 2002 -1 Buck 2001 -1
N Mean S.E.M. N Mean S.E.M.
Mean SCS 11 4.3a 0.3 14 3.2b 0.3
Only heifers that finished their first lactation were included. There were no heifers with finished lactations in group suck 2003 -1
a,b Within a row, means without a common superscript differ (P<0.05).
Farm 2
It was remarkable that none of the heifers in group suck2002 -2 had an increased SCC, compared to 50% in group buck2002 -2; (Table 13). High SCCs in group buck2002 –2 were often returning after recovery. One heifer in this group exceeded the critical norm 4 times during first lactation.
Table 13 Percentage high SCC cows and total number of times the critical norm (>200.000 cells/ml) was exceeded on Farm 2
N % high SCC cows
Total number of times critical
norm was exceeded
Suck 2002 -2 7 0% 0
Suck 2003 -2 6 17% 2
Buck 2001 -2 16 31% 8
Buck 2002 -2 10 50% 12
[image:35.596.65.475.382.440.2]No significant difference in SCS was found between heifers reared in a suckling system and heifers reared in a bucket system (table 14). The suckled and both bucket groups had an average SCS below the critical norm (<4.0).
Table 14 Mean SCS on Farm 2
Treatment Suck 2002 -2 Buck 2001 -2 Buck 2002 -2
N Mean S.E.M. N Mean S.E.M. N Mean S.E.M. Mean SCS 5 3.0a 0.2 16 2.9a 0.2 10 3.4a 0.4
Only heifers that finished their first lactation were included. There were no heifers with finished lactations in group suck 2003-2
a,b Within a row, means without a common superscript differ (P<0.05).
S.E.M.: Standard Error Mean
Gross analysis
A gross analysis was given in Annex 6. When suckled groups were compared to bucket groups, no significant differences in SCS were found.
Suckling of own calf
[image:35.596.68.431.619.687.2]The SCS value of heifers on Farm 2, that were reared in a suckling system and suckled their own calf, was compared to heifers that were reared in a suckling system and did not suckled a calf (table 15). No effect of suckling on the mastitis incidence was found.
Table 15 Mean SCS on farm 2 Treatment Heifers that suckled own
calf
Heifers that did not suckled a calf
N Mean S.E.M. N Mean S.E.M.
Mean SCS 15 3.2a 0.3 21 2.8a 0.2
Only heifers that finished their first lactation were included. There were no heifers with finished lactations in group suck 2003 -1
a,b Within a row, means without a common superscript differ (P<0.05).
0 5 10 15 20 25 30 35
0-50 51-100 101-150 151-200 201-250 251-305 stage in lactation (days)
kg milk 0 200 400 600 800 1000
SCC (x1,000 cells/ml)
FPCM (KG) SCC
3.3.2 Mastitis in relation to milk production
SCC and lactation curves are given for every group, except for group suck 2003 -1. Curves from heifers in this group are not given, because only 1-3 test days were available yet. Curves were compared to a standard SCC pattern and lactation curve. A standard lactation curve is shown in Figure 2 (section 1.2.3) and a normal SCC pattern can be seen in Figure 3 (section 1.2.4).
Farm 1
Although, it looks like the SCC of heifers reared in a suckling system, group (suck2002 -1), was increasing towards the end of the lactation (Figure 9a), this increase was caused by one heifer (6716) with a SCC of 2,908,000 cells per ml at the end of its lactation. SCC in the bucket group (buck2001 -1) was slowly increasing towards the end of the lactation. The average of the group stayed under 200,000 cells/ml.
In both groups, suck2002 -1 and buck2001 -1 the lactation curve was, comparable with the standard curve, decreasing towards the end of the lactation. However, the figures give the impression that a peak production was missing. Milk production of the bucket group (buck2001 -1) started at a higher production level than the suckled group (suck2002 -1).
a. Suck2002 -1 b. Buck2001 -1
Figure 9 Lactation and SCC curves for groups on Farm 1 0 5 10 15 20 25 30 35
0-50 51-100 101-150 151-200 201-250 251-305 stage in lactation (days)
kg milk 0 200 400 600 800 1000
SCC (x1,000 cells/ml)
0 5 10 15 20 25 30 35
0-50 51-100 101-150 151-200 201-250 251-305
stage in lactation (days)
kg milk 0 200 400 600 800 1000
SCC (x1,000 cells/ml)
FPCM (KG) SCC
Farm 2
SCC of group buck 2002 -2 appeared to be high in the beginning of the lactation (Figure 10d), but this was caused by two heifers with extreme SCCs (4,310,000 and 1,853,0000 cells/ml). If these heifers were left out, the curve did not show any increase.
Milk production of group suck2002 -2 started on a higher level compared to other groups on Farm 2 (Figure 10a). A peak production was missing in the lactation curve of group suck2003
-2 (Figure 10b). Milk production of group buck2001 -2 stayed on a high level during the
lactation. This was caused by a second peak production after approximately 210-250 days in lactation (Figure 10c). The lactation curve of group buck2002 -2 was giving the impression that milk production started at a low level compared to other groups (Figure 10d).
a. Suck2002 -2 b. Suck2003 -2
[image:37.596.49.570.260.616.2]
c. Buck2001 -2 d. Buck2002 -2
Figure 10 Lactation and SCC curves for groups on Farm 2
0 5 10 15 20 25 30 35
0-50 51-100 101-150 151-200 201-250 251-305
stage in lactation (days)
kg milk 0 200 400 600 800 1000
SCC (x1,000 cells/ml)
FPCM (KG) SCC 0 5 10 15 20 25 30 35
0-50 51-100 101-150 151-200 stage in lactation (days)
kg milk 0 200 400 600 800 1000
SCC (x1,000 cells/ml)
FPCM (KG) SCC 0 5 10 15 20 25 30 35
0-50 51-100 101-150 151-200 201-250 251-305
stage in lactation (days)
kg milk 0 200 400 600 800 1000
SCC (x1,000 cells/ml)
3.4 Mastitis status on both farms
3.4.1 Mastitis status
[image:38.596.72.529.236.317.2]On both farms, average SCC of the herd was high during last year (Table 16). Both farms exceeded the limit of 400,000 cells per ml a few times during 2005. Also, on both farms, percentage of high cell count cows was high compared to the norm of 15% (Van de Mortel, 2004). The average percentage of high cell count cows after calving in the Netherlands is 23% (Poelarends and Smolders, 2004). Hence, percentage of high cell count cows after calving was high on both farms.
Table 16 Overview of the mastitis situation on both farms in 2005 (MPR-results 14-12-05) Farm 1 Farm 2 Average SCC of the herd in 2005 (x 1,000 cells per ml) 344 307
% of high cell count cows (=250,000 cells/ml) 37% 24%
% new high cell count cows (=250,000 cells/ml) 12% 9%
% high cell count cows after calving (=250,000 cells/ml) 35% 45%
3.4.2 Mean SCC before and during the use of a suckling system
On both farms, there was a lot of variation in average SCC of the herd during and between years (Figure 11). From January 2003 until December 2005 average SCC of the herd varied from 139 - 714 x 1,000 cells per ml on Farm 1, and from 142 - 769 x 1,000 cells per ml on Farm 2.
Suckling did not have a positive effect on the average SCC of the future dairy herd. Both farms introduced the suckling system in 2002. On both farms, the first heifers reared in a suckling system started lactating in October 2004. Average SCC of the herd was, on both farms, not improved after suckled heifers started their first lactation.
0,0 100,0 200,0 300,0 400,0 500,0 600,0 700,0 800,0 900,0
jan-03mrt-03mei-03 jul-03sep-03nov-03jan-04mrt-04mei-04 jul-04sep-04nov-04jan-05mrt-05mei-05 jul-05sep-05nov-05
date
Mean SCC (x1,000 cells/ml)
Farm 1 Farm 2