V
The impact of root traits, nutrient uptake,
age of accession, growth period and
resistance to fungal disease for cereal
production with limited nutrient supply
and pesticide use
Anne-Kristin Løes1, Ellen Mosleth Færgestad2, Tara S. Gahoonia3, Hugh Riley4and Mauritz Åssveen5 1Norwegian Centre for Ecological Agriculture (NORSØK), N-6630 Tingvoll.
2Norwegian Food Research Institute, Box 5028, N-1432 Ås.
3The Royal Veterinary and Agricultural University, Department of Agricultural Sciences, Plant Nutrition and Soil Fertility Laboratory, Thorvaldsensvej 40, DK-1871 Frederiksberg.
4Norwegian Crop Research Institute, N-2350 Nes på Hedmark. 5Norwegian Crop Research Institute, N-2849 Kapp.
Manuscript submitted to Crop Science
a
b
c
f
g
h
Legend to pictures, opposite page
a Field experiment with 20 accessions of spring wheat and barley released 1900-2000, grown with limited supply of nutrients and use of pesticides, 10 August 2001. b Above ground dry matter was recorded at 2 weeks interval during the growing season,
the first time 18 days after germination, 18 June 2001.
c One replicate of the barley accessions NK94682 (to the left) and Dønnes (to the right) on 10 August. NK94682 (not released) produced the highest, and Dønnes (old land race)
the lowest recorded grain yields by limited nutrient supply, 4.8 and 3.0 t ha-1, respectively. d One replicate of the spring wheat accessions Brakar (to the left, released 1995)
and Diamant (to the right, released 1928) demonstrating the reduction in straw length achieved by breeding. Both accessions produced the lowest grain yields among the 9 wheat accessions tested, approx. 2.8 t ha-1.
e Scald infected most barley accessions; the susceptibility to scald varied considerably. h Mildew infected most wheat accesssions; the susceptibility to mildew varied considerably.
g Before the field experiment with limited nutrient supply, 52 accessions were grown in field with optimal nutrient supply and in circulating low-P nutrient solution. From records of root traits in nutrient solution,
20 accessions were selected for the field experiment with limited nutrient supply. This picture shows the trays with nutrient solution.
f To ensure even light conditions, paper walls were put around the trays .
Picture a taken by Martha Ebbesvik, b-h by Anne-Kristin Løes.
ABBREVIATIONS USED IN THE PAPER:
Above ground dry matter = ADM
Dry matter = DM
Harvest index, grain proportion of total above ground yield = HI
Root length relative to the total plant DM, m g–1plant DM = L*
Root hair length = RHL
INTRODUCTION
Genetic gain in grain yields
During the last century, breeding of new cereal cultivars has been performed in parallel to a pro-nounced intensification of agriculture. It is diffi-cult to separate the improvement in grain yield caused by breeding from those caused by increa-sed nutrient supply and improved plant protecti-on, soil cultivatiprotecti-on, planting and harvesting tech-niques, but in general a significant genetic gain has been reported (Feil, 1992). The estimated genetic gain in spring wheat yields of Nordic culti-vars (Denmark, Sweden, Finland and Norway) was 18.5 kg ha-1y-1in the period 1901-1993
(Ortiz et al., 1998). For 2-row barley, it was 13 kg ha-1y-1(period 1942-1988), and for 6-row, 22 kg
(period 1930-1991; Ortiz et al., 2002). A recent Austrian study reported even higher yield increa-se, 60 kg ha-1y-1in barley, especially during the
period 1950-1960 and onwards (Grausgruber et al., 2002). High increase in cereal yields due to recent breeding, 96 kg ha-1y-1, was also found by
Foulkes et al. (1998) for winter wheat in Great Britain (period 1969-1988). Much of the yield increase in small grains has been obtained by an increased HI, whereas the total biomass producti-on has not increased (Feil, 1992; Ortiz et al., 1998). However, in a recent study, the biomass had increased whereas the HI was not changed in barley genotypes from Argentina released 1944-1998 (Abeledo et al., 2003). This reflects that genetic gains in grain yields may have various physiological explanations.
Nutrient efficiency and genetic variability
The term nutrient efficiency is often used to descri-be the ability of plants to achieve a satisfactory growth and development with restricted availability of one or more nutrients. With limited nutrient supply, a nutrient efficient cereal genotype will produce a relatively higher grain yield than a less efficient cultivar. A high nutrient efficiency may be obtained by high utilization efficiency, which is the ability to produce much plant DM, and thereafter much grains, from each unit of nutrient taken up. A disadvantage of high utilization efficiency is that the nutritive value of the grain seeds may be redu-ced, as well as the early growth rate after seeding. Under conditions of limited nutrient supply, this may hamper the competition with weeds and is hence not desirable. A better alternative is high uptake efficiency, which is the total amount of nutrients taken up in plant material per unit area. Spring cereals have a rapid growth rate during a very limited period and the ability to take up large amounts of nutrients between germination and maturing is essential.
The availability of mineral nutrients such as P and various micronutrients restricts grain yields in large areas of the world, and hence nutrient effici-ency in cereals has been intensively studied. However, as no simple and standardized measure-ment of the complex nutrient efficiency trait has yet been generally accepted, nutrient efficiency is seldom targeted in the commercial cereal breeding. In a scientific study, some barley genotypes were better adapted to limited phosphorus (P) availabili-ty because of relatively longer roots and/or a more efficient nutrient uptake at the cell level (Nielsen
1
ABSTRACT
From a representative selection of 52 accessions of spring wheat and barley grown in Norway during 1900-2000, 20 accessions were chosen for comparing nutrient uptake and grain yields in field by limited nutrient supply and pesticide use. The accessions were precedingly grown in low-P nutrient solution for records of root traits (L*, RHL), and in field with optimal nutrient supply. Grain yield ranking was comparable under both field conditions. However, some accessions, especially those selected for organic farming, performed relatively better with limited supply. The older accessions were not superior to modern when grown with limited supply. The highest grain yields were achieved with modern accessions that were fairly resistant to the major diseases, powdery mildew (Blumeria graminis (Oudem.) J.J. Davis) in wheat and scald
(Rhynchosporium secalis(Oudem.) J.J. Davis) in barley. A higher HI contributed significantly to the higher
yields of modern accessions. No relationship was found between root traits recorded in nutrient solution or RHL in field, and the nutrient uptake in field. However, the uptake of N, P and K during the growing sea-son varied significantly between accessions. The amount of P taken up in ADM at the ripening stage had a significant impact on grain yields in barley, and correspondingly, the amount of N effected grain yields in wheat significantly. Susceptibility to fungal disease and growing period also influenced grain yields. Some older accessions possessed interesting traits e.g. resistance to mildew and high nutrient uptake that may be useful in future breeding programs.
and Schjørring, 1983). For barley genotypes with varying RHL, the RHL were positively related to P uptake (Gahoonia et al., 1999). Some authors (e.g. Nielsen, 1983; Sattelmacher et al., 1994) suggest that genetic variability in cereals provides a signifi-cant potential to breed especially nutrient efficient cereal varieties. However, it must be kept in mind that information on the genetic background of a plant trait is essential for breeding, and this know-ledge is often limited with respect to root traits (Manske and Vlek, 2002).
Grain production with limited nutrient
supply and use of pesticides
For farming systems refraining from the use of pesti-cides and mineral fertilizers, such as organic farming (International Federation of Organic Agricultural Movements (IFOAM), 2003), an ideal cereal cultivar is nutrient efficient, resistant to fungal disease and competes efficiently with weeds (Lammerts van Bueren et al., 2003). In humid regions, resistance to fungal diseases has been essential in conventional breeding, but nutrient efficiency and competitive abi-lity have not been given priority. Significantly lower use of fertilizers and animal manure in conventional as compared to organic farming systems caused 21-37% lower grain yields on the organic farms (Halberg and Kristensen, 1997). There is no doubt that modern cultivars produce higher yield when grown with conventional applications of fertilizer and pesti-cides, and it seems as if the genetic gain has been especially large since approximately 1960 onwards. However, it is less clear whether the modern cultivars perform superior with limited nutrient supply and use of pesticides. Foulkes et al. (1998) found that the most recent accessions were adapted to high levels of N in soil and took up relatively more N from fertili-zer, whereas the older accessions in their selection had a relatively larger uptake of N mineralized from soil. The N uptake from fertilizer was calculated as the apparent recovery of fertilizer N, which is N in yield with N fertilizer minus N in yield with no N applied. There is also a possibility that the nutrient efficiency of modern accessions has decreased becau-se genotypes producing large amounts of biomass seem to have a more efficient nutrient uptake (Feil, 1992). In maize, genetic gains in grain yield have been achieved by increasing the above ground bio-mass. For this cereal species, there is no negative cor-relation between yield level and grain N on, whereas in small grains, the grain N concentrati-on decreases with increasing yield levels. This might be seen as an indication of lower nutrient efficiency in modern cultivars (Feil, 1992). In Nordic countries, cereal accessions with large differences in growth period are available because of the large variation in longitude of the area in which cereals, especially bar-ley, are grown. Early genotypes have fewer days avai-lable for nutrient uptake, and it is possible that this may contribute to a less efficient nutrient uptake in such genotypes.
Aim of the paper
The aim of the present paper is to discuss if diffe-rences in root traits can be related to diffediffe-rences in nutrient uptake among cereal accessions, and assess the agronomic value of cereal accessions released during the period 1900-2000 when grown with limited nutrient supply and pesticide use. The following topics will be studied:
1. Will the genotypic differences in RHL be simi-lar when measured in nutrient solution and under field conditions?
2. Will L* and RHL influence the nutrient uptake in field?
3. Is the nutrient uptake different in older as compared to modern accessions?
4. Is the nutrient uptake affected by the lateness of the accession?
5. Is the susceptibility to fungal diseases different in older as compared to modern accessions? 6. Is the grain nutrient utilization efficiency diffe-rent in older as compared to modern accessions?
This will provide a basis on which to conclude whether the breeding efforts designed for conven-tional, high-input farming systems also have been suitable for organic farming systems. Finally, we discuss whether some accessions have attributes that may be useful in future selection of cultivars for farming systems with limited nutrient supply and pesticide use.
In the field experiments presented here, optimal nutrient supply was combined with use of fungici-de in one season and limited nutrient supply with no use of fungicide in the next season. This design provides information of a total effect of a high-input conventional farming system as compared to a low-input farming system resembling organic farming practice.
MATERIAL AND METHODS
Selection of cereal accessions
Overview of experiments
All accessions were grown to maturity in a field with optimal nutrient supply. Thereafter, all accessions were grown in circulating low-P nutri-ent solution in a climate chamber, and screened for L*, RHL and P use efficiency. Accessions with contrasting root traits (9 of wheat, 11 of barley) were selected for a field experiment with limited nutrient supply. The pedigree of all accessions is shown in Løes and Gahoonia (submitted).
Field experiment with optimal nutrient
supply and use of fungicides
On a morainic soil with medium high nutrient concentrations, most accessions were grown in two replicates with medium high N, P and potas-sium (K) fertilization (Table 1) in year 2000.
These growing conditions will be referred to as optimal nutrient supply. Ten out of the 52 accessi-ons were received from Nordic Gene Bank, and were grown without replicates due to lack of seeds. The experiment was located at The Norwegian Crop Research Institute, Apelsvoll Research Centre (60O42'N, 10O51'E). The plot size
was 1.5 x 8 m, harvest plot 1.5 x 5.6 m. Fungal disease was recorded as the fraction of leaves infected by mildew, leaf spot septoria
(Mycosphaerella graminicola(Fuckel) Schröt.),
or scald. Yield levels of grain and straw were recorded on 6 September for barley, and 20 September for wheat, by means of a plot combine harvester. No plant analyses were performed in this experiment. In addition to the comparison of the cereal accessions under optimal nutrient sup-ply, the experiment was used to multiply seeds under equal growing conditions.
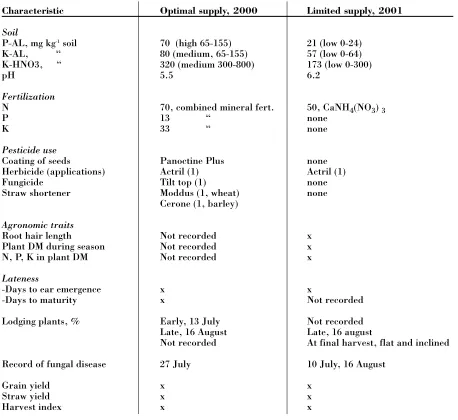
3 Characteristic Optimal supply, 2000 Limited supply, 2001
Soil
P-AL, mg kg-1soil 70 (high 65-155) 21 (low 0-24)
K-AL, “ 80 (medium, 65-155) 57 (low 0-64)
K-HNO3, “ 320 (medium 300-800) 173 (low 0-300)
pH 5.5 6.2
Fertilization
N 70, combined mineral fert. 50, CaNH4(NO3) 3
P 13 “ none
K 33 “ none
Pesticide use
Coating of seeds Panoctine Plus none
Herbicide (applications) Actril (1) Actril (1)
Fungicide Tilt top (1) none
Straw shortener Moddus (1, wheat) none
Cerone (1, barley)
Agronomic traits
Root hair length Not recorded x
Plant DM during season Not recorded x
N, P, K in plant DM Not recorded x
Lateness
-Days to ear emergence x x
-Days to maturity x Not recorded
Lodging plants, % Early, 13 July Not recorded
Late, 16 August Late, 16 august
Not recorded At final harvest, flat and inclined
Record of fungal disease 27 July 10 July, 16 August
Grain yield x x
Straw yield x x
[image:5.595.70.528.357.777.2]Harvest index x x
Screening for root traits in
low-P nutrient solution
Seeds were disinfected with 10% sodium hypochlo-rite, rinsed and germinated on moist filter paper. After 1 week, vigorous seedlings of all accessions were selected and grown for 3 weeks in well-aerated circulating nutrient solution in a climate chamber with light intensity 130 mE s-1, light/dark period
16/8 h, temperature 18/15 OC and 75% relative
humidity. There were three replicates per accessi-on. Each experimental unit consisted of five single plants grown in a strip of foamed plastic. An initial complete basic nutrient solution (Gahoonia et al. 1999) with 25 mM P was later supplemented with a maintenance solution equal to Gahoonia et al. (1999), or ammonium nitrate solution to adjust pH and to keep the electric conductivity approximately constant at 0.67 mS m-1. After 3 weeks, all plants
were harvested. Leaf and root DM were recorded after drying at 70OC until constant weight. N, P
and K concentrations were measured, and L* and average RHL were recorded as described.
Field experiment with limited nutrient
supply
Eleven barley and 9 wheat accessions with contras-ting root traits (Table 2) were selected for a field experiment on morainic soil with low nutrient con-centrations, and a low N-fertilization (Table 1). These growing conditions will be referred to as limited nutrient supply. On the experimental field, no fertilizers had been applied since 1995 and the preceding crops were a grass-clover ley in 1998 and 1999, and barley in 2000. The grain yield level (Table 4) was considerably lower in this experi-ment, which supports that the use of the terms “optimal” and “limited” are reasonable. The N-fer-tilizer was applied to increase the demand for other mineral nutrients. In this way, we hoped to reveal genotypic variability more readily, caused mainly by limiting P and K availability. The experiment was located at Apelsvoll Research Centre division Kise (60O46'N, 10O49'E). Seed stock from the
multi-plication field in 2000 was used. Herbicide was applied once to ensure comparable conditions; no other pesticides were used (Table 1).
Each accession was randomly sown within four replicate blocks. However, to reduce the effect of soil variation, all accessions within each cereal spe-cies were located next to each other within each block. Each experimental plot measured 1.5 x 12 m (12 rows of plants), of which the inner 1 m width was used for ADM sampling. ADM was recorded at 2-week intervals after germination, which occurred on 1 June. The sampling dates, 18-19 June, 2-3 July, 16-17 July, 1 August and 14-15 August will be referred to as sampling 1, 2, 3, 4 and 5, respective-ly. At each sampling, 1 x 0.50 m of the canopy was
cut off from the end of the plot inwards and remo-ved. Then another 1 x 0.50 m was cut and sampled. DM of plant samples was recorded after drying to constant weight at 80OC. A considerable disease of
scald occurred on the barley, and mildew on the wheat accessions. For mildew, the infected fraction (%) of the upper 3 or 4 leaves was recorded on both dates (Table 1). For scald, the fraction of the bottom leaves was recorded on the first and the fraction of the upper leaves on the last date. For the two dates of fungal record, the fungal disease fractions have been abbreviated FD1 and FD2, respectively. The phenological development rate varied considerably between accessions, especially for barley, and hence the developmental stage was not recorded at each sampling. The number of days until ear emergence was recorded and used to cha-racterize the lateness of each accession.
The final harvest occurred on 12 September for 6-row barley and on 18 September for wheat and 2-row barley. A plot combine harvester was used, and the harvest plot was 1.35 x 6 m. Again, 0.50 m of the canopy was removed before the sample har-vest started. HI was recorded by weighing the straw and grain yield from each plot. N, P and K concentrations were analyzed in ADM at each sam-pling and in grain and straw at the final harvest. At sampling 1, average RHL was measured as descri-bed below.
Plant and soil analysis
For plant samples from the nutrient solution expe-riment, dried root and leaf material was mixed for each experimental unit and ground, assuming that the concentrations of N, P and K in roots and lea-ves did not vary much as these nutrients are highly mobile within the plant. For determination of P and K, approximately 1 g of dry sample was dige-sted in a mixture of H2SO4, H2O2and HNO3. P was determined colorimetrically (Murphy and Riley, 1962) and K by inductive coupled plasma analysis (ICP). The N concentration was determined by a Leco autoanalyser.
Plant samples from the field experiment with limi-ted nutrient supply were ground, then 150-200 mg of dry sample was digested with Na2SO4and con-centrated H2SO4. N concentrations were then determined by a colorimetric method using FIA (Flow Injection Analyser), whereas P and K were determined by ICP.
Root traits
Root length (L) was measured by scanning 10-30 cm long samples of two or three continuous roots taken randomly from each experimental unit grown in nutrient solution. These roots were care-fully spread by forceps in a film of distilled water in a glass tray, and the resulting root picture was scanned by a flatbed scanner (ScanJet IIx HP) and stored as a picture data file. The root sample was then dried at 70 OC and carefully weighed.
The digital picture data files were analyzed by Dt-Scan Software (Delta-T Devices, Cambridge, England; procedure “Object perimeter/2”), to determine L. The trait L*, which is a measure of photosynthate invested in roots to nourish the leaves, was then calculated. L was not determined in the field experiments.
Average RHL was determined on separate root samples taken from the nutrient solution experi-ment and also from the field experiexperi-ment with limi-ted nutrient supply. The root samples were placed in distilled water and studied under a microscope interfaced with a video camera and a computer. For the root samples from nutrient solution, 20 representative RHL (some short, some long, some medium; all measured root hairs were easily visible on the picture) were measured for each experimental unit. In the field experiment, a clus-ter of five plants including roots from each acces-sion was sampled at sampling 1. The roots were gently rinsed to remove soil particles, and 40 representative RHL were measured on each of three sub-samples from each accession.
RHD was assessed for root samples from the field experiment in a simple way. One representative root picture of each accession, without knowing which accession the picture belonged to, was ran-ked 1, 2..9 for wheat accessions and 1, 2..11 for barley accessions. The picture given the character 1 had the least dense root hairs, and 9 or 11 had the densest root hairs. No notice was taken of the RHL during this procedure. A meaningful ran-king was confirmed when an unprejudiced collea-gue observed the series of pictures without any other information and concluded that RHD had to be the trait that caused a meaning.
Statistical analysis
Statistically significant differences between acces-sions were assessed by one-way balanced analysis of variance for the results from the field experi-ment in 2000; and for the results from the nutri-ent solution experimnutri-ent where no effect of locali-zation within the growth boxes was found (Anova, SAS Institute, 1989). For the results from the field experiment with limited nutrient supply, the effects were assessed by two-way analysis (effect of accession and block). Interesting relations were
analyzed by linear regression or correlation ana-lysis using Minitab software. Levels of significance are abbreviated as * = 0.05 >P> 0.01, ** = 0.01 >P> 0.001 and *** = P< 0.001. In some cases, tendencies have been assigned by (*) for 0.1 > P> 0.05. To assess whether certain characteristics were related to changes that might have occurred during breeding, the age of each accession was calculated as 2000 minus its year of release. The age of not yet released accessions was set to 1 year. When age of accession was used in linear regression or correlation analysis, the means of the other characteristics were used.
To study how various factors affected the grain yields, stepwise regression (Minitab software) and a multivariate regression technique, partial least square (PLS) regressions (Unscrambler software) were used. PLS regression analysis is a data com-pression technique where the information in the original set of variables is projected down on a smaller number of new variables, called principal components. These latent new variables are linear combinations of the original variables. As they are orthogonal to each other, they can be used in a regression model without problems caused by collinearity. In the PLS regression analysis, the following characteristics were used as x-variables:
– The P and K balance in soil (spring values minus harvest values of P-AL and K-AL for each experimental plot)
– Nutrient uptake (Nu2 etc where 2 refers to the sampling number)
– Nutrient concentrations (N2 etc )
– Root traits (RHL measured in field, L* from nutrient solution)
– Fungal disease (FD1, FD2) – Age of accession (Age)
– Lateness, measured as number of days to ear emergence (Ear)
– Lodging inclination (L2f) – Replicate (rep1,..rep4)
– The yields of grain and straw by optimal nutri-ent supply, as a measure of the yield potnutri-ential (DMgO, DMstrO)
Grain yields (DMg), straw yields (DMstr) and total DM yields (DMtot) as well as ADM at vari-ous sampling dates (DM1, DM2..) were used as y-variables. Mathematically, the regression model describes, by decreasing order of the principal components, the covariance between a set of x-and y-variables. The principal components are plotted to visualize the variables in a “loading“ plot, as well as the initial samples in a “score” plot. These graphical presentations give informa-tion about the patterns of variainforma-tion in the
results. Interpretation of the principal compo-nents shows the effect of the x-variables on the y-variables. The number of statistically significant principal components in the regression model is determined by cross validation, where the signifi-cance of the model is repeatedly tested on a sub-set of samples that is temporarily excluded from the calibration set. All replicates of each accessi-on were simultaneously excluded from the model. The significance of the various x-variables were evaluated by a Jack Knifing procedure (Martens and Martens, 2001). In the loading and score plots presented here, only characteristics signifi-cant after cross validation are shown. Further details of PLS regression analysis are given in Martens and Næs (1989) and Martens and Martens (2001).
RESULTS
RHL in nutrient solution and field, and other root traits as related to P use efficiency in solution
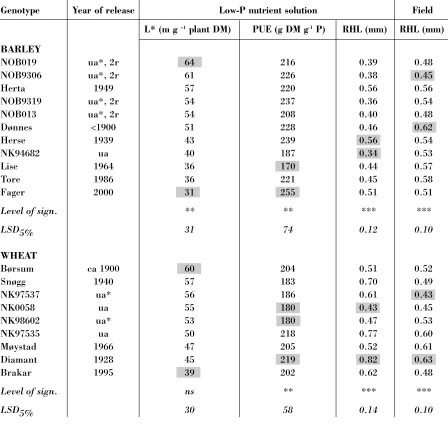
A significant variation was found among the bar-ley accessions grown in low-P nutrient solution with respect to RHL, L* and P use efficiency (PUE, g plant DM mg-1P taken up), as shown in
Table 2. For wheat, the difference in L* was not significant, but significant differences in PUE and RHL were found. Accessions with contrasting values of L*, PUE and RHL were chosen for the field experiment with low nutrient supply, and for these accessions the exact values for L*, PUE and RHL are shown in Table 2.
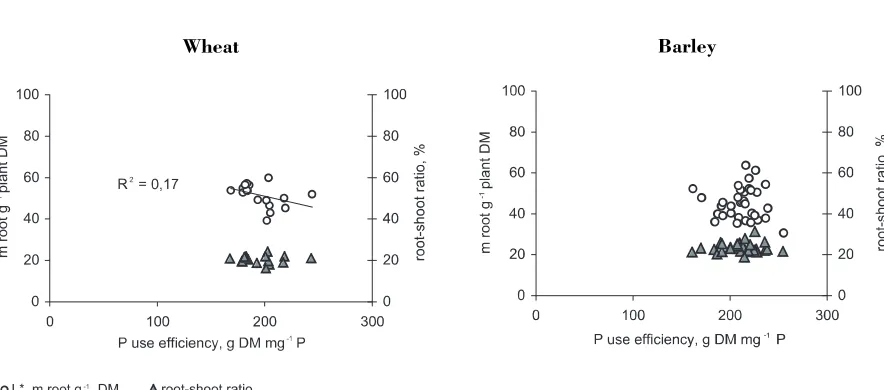
There was also a significant variation in root-shoot ratio among barley accessions (P< 0.001) as well as wheat accessions (P< 0.01) (Figure 1). However, the variations in PUE were not related to variations in L* or to variations in root-shoot ratio (Figure 1), except for a slight negative impact of L* on PUE in wheat (P = 0.09). The root-shoot ratio and L* values were correlated, r = 0.42*** for wheat and 0.50*** for barley. The average RHL value for each experimental unit and PUE were weakly correlated, r = 0.20* for barley and 0.27(*) for wheat.
Significant differences in RHL were also found in field (Table 2). In general, the average RHL valu-es measured in field did not deviate much from those measured in nutrient solution (Table 2). However, the ranking of accession with respect to RHL was not the same when grown in solution as in the field. No significant relation was found bet-ween RHL in field and nutrient solution for any of the cereal species. Hence, the answer to questi-on 1 (see Aim of the paper) was negative. The genotypic differences in RHL were not similar in nutrient solution and field.
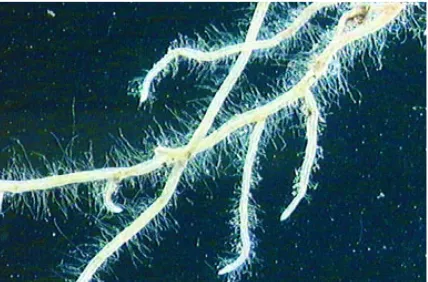
For the roots from the field experiment, a positive correlation was found between RHD and RHL for the wheat accessions, r = 0.58(*). This may be seen in Figure 2, where the general impression is that the accessions with the longest average root hairs also have the highest root hair density.
[image:8.595.73.515.521.716.2]20 40 60 80 100
Figure 1.The relations between average values for each accession for P use efficiency (PUE) and root/shoot ratio,
and PUE and m root g-1plant DM (L*), for 17 wheat and 35 barley accessions grown in circulating low-P nutrient
solution.
Genotype Year of release Low-P nutrient solution Field
L* (m g –1plant DM) PUE (g DM g-1P) RHL (mm) RHL (mm)
BARLEY
NOB019 ua*, 2r 64 216 0.39 0.48
NOB9306 ua*, 2r 61 226 0.38 0.45
Herta 1949 57 220 0.56 0.56
NOB9319 ua*, 2r 54 237 0.36 0.54
NOB013 ua*, 2r 54 208 0.40 0.48
Dønnes <1900 51 228 0.46 0.62
Herse 1939 43 239 0.56 0.54
NK94682 ua 40 187 0.34 0.53
Lise 1964 36 170 0.44 0.57
Tore 1986 36 221 0.45 0.58
Fager 2000 31 255 0.51 0.51
Level of sign. ** ** *** ***
LSD5% 31 74 0.12 0.10
WHEAT
Børsum ca 1900 60 204 0.51 0.52
Snøgg 1940 57 183 0.70 0.49
NK97537 ua* 56 186 0.61 0.43
NK0058 ua 55 180 0.43 0.45
NK98602 ua* 53 180 0.47 0.53
NK97535 ua 50 218 0.77 0.60
Møystad 1966 47 205 0.52 0.61
Diamant 1928 45 219 0.82 0.63
Brakar 1995 39 202 0.62 0.48
Level of sign. ns ** *** ***
LSD5% 30 58 0.14 0.10
Nutrient uptake in field and changes in
soil P and K concentrations
The uptake of N, P and K in ADM during the whole growing season including the final harvest (sum of grains and straw) is shown for each acces-sion in Figure 3. The uptake in cereals occured rapidly, especially that of N in barley where 70-80% of the total N in ADM was taken up within 1 month after germination. For the majority of accessions, the total N uptake was more than twice the amount that had been added in mineral fertilizer. The time course of uptake in ADM dif-fered with the nutrient element. For most accessi-ons, the amount of N and P taken up increased
quite steadily until the final harvest, whereas for K, much was lost between sampling 5 and the final harvest. Most probably, this occured by lea-ching during an episode of 20 mm rainfall on 1 September. From sampling 1 onwards, there was a strong and positive impact of the amount of each nutrient taken up in ADM on one date, on the amount of the same nutrient in ADM at a later date. Also, on each sampling the amount of N in ADM was positively correlated to the amount of P and K and vice versa, r > 0.47 for barley, r > 0.73 for wheat. The only exception was the amount of P in ADM at sampling 5 in barley, which was not significantly correlated to the amount of K (P= 0.21).
[image:9.595.75.523.123.548.2]7
Table 2.Year of release, and average values of L*, PUE (P use effiency) andRHL (root hair length) in low-P nutrient solution, and RHL in the field by limited nutrient supply, for wheat and barley accessions released during the period 1900-2000. The accessions are arranged by decreasing L* value. For each trait, the level of significance for variation among accessions is shown. Minimum and maximum values of each trait are shaded. LSD = Least significant difference
1 ua= under approval, * = selected for organic farming, 2r = 2-row barley, other barley accessions are 6-row
2 LSD values for L* were calculated for 17 accessions of wheat and 35 of barley
3 LSD values for RHL in nutrient solution were calculated for17 accessions of wheat and 35 of barley
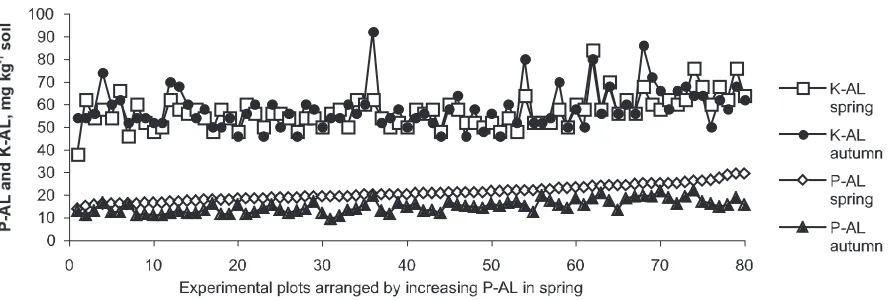
Significant differences (P> 0.05) between accessi-ons with respect to uptake of N, P or K in ADM on 2 July and 1 August are shown in Table 3. For wheat, significant differences were only found at these dates (sampling 2 and 4) as well as in grain and straw. For barley, the nutrient uptake was significantly different among accessions also at other samplings (data not shown). For the topsoil (0-25 cm depth) P-AL values, a significant decrea-se was found during the growing decrea-season (Figure 4). On average for all plots, the decrease was from to 21 to 15 mg P kg-1soil, corresponding to
an amount of 22 kg P ha-1 by a bulk density (Riley et al., 2003) of 1.45 t soil m-3. The average
total P uptake at harvest was 15 kg ha-1. As P
uptake in the roots was not measured, a some-what larger decrease in soil than measured in ADM seems reasonable. The easily available K fraction was obviously replenished during the sea-son because no general decrease in topsoil K-AL
values was found, in spite of that the average amount of K removed in grain and straw was 47 kg ha-1. The average K-AL value was 57 mg K kg-1
soil in spring and 58 in autumn. The changes in soil P-AL or K-AL values from spring to autumn, hereafter called P or K balance, did not vary bet-ween barley or betbet-ween wheat accessions.
[image:10.595.311.525.70.211.2]However, for barley, the average P balance for each accession was related to average P uptake in grain, r = 0.58(*) as well as to the total P uptake in grain and straw, r = 0.55 (*). Further, the K uptake in ADM at sampling 3, 4 and 5 as well as in grains was related to the P balance for the bar-ley accessions (r varied from 0.64* to 0.71*). For wheat, the P uptake in ADM at sampling 2 was related to the P balance, r = 0.59 (*), but there was no relation between K uptake and the P balance. The N uptake was not related to the P balance in wheat nor in barley, and no nutrient uptake was related to the K balance.
Figure 2.Root hairs from wheat and barley accessions with the lowest or highest values of root hair density, recor-ded in field with limited nutrient supply. Roots were sampled 18 days after germination, June 2001. Average root hair length (RHL) values are shown for each accession.
Wheat cv. NK97537, RHL 0.43 mm Wheat cv. Møystad, RHL 0.61 mm
9
Figure 3.
Nutrient concentrations in above ground plant dry matter (ADM) during the growing season of wheat accessions (upper panel) and
barley accessions (lower panel) grown
in the field with limited nutrient supply
Nutrient uptake in field as related to
genotypic differences in root traits
The barley accessions NOB019 and NOB9306, selected because of high values of L*, had only intermediate uptake of nutrients until the final har-vest (Table 3), except from K in ADM at sampling 5 (Figure 3). However, these accessions had short root hairs both in solution and in field (Table 2). Dønnes was selected due to a relatively high PUE in nutrient solution, and had long root hairs, espe-cially in field. This may explain the relatively high P uptake early in the season. Fager, Lise and Tore were selected because of low L* values, but Lise and Tore had relatively long root hairs in field. Tore had a low uptake of all nutrients, whereas Lise had the largest uptake of P. Fager had a high uptake of N and P, but intermediate of K. The ran-king of barley accessions with respect to nutrient uptake was approximately the same at sampling 2 and sampling 4.
The wheat accessions Børsum and Snøgg were selected because of high L* values, and Diamant, Møystad and NK97535 were selected because of the relatively long root hairs (Table 2). Børsum, Snøgg and Møystad had the highest uptake of P at sam-pling 2 (Table 3), and Møystad also had the highest uptake of N and K. This may be ascribed to long and dense root hairs in this accession (Figure 2). Later, Snøgg had the largest nutrient uptake (Table 3). Børsum and Diamant had low nutrient upta-kes, whereas NK97535 had an intermediate uptake until the final harvest. Brakar, selected for a low L*, had an intermediate uptake of P and K at sam-pling 2, but generally a low uptake of N and later also of P and K.
Hence, for some accessions, a positive answer could be given to question 2, but for other accessions, the uptake patterns were opposite to what was
expec-ted. No significant relations were found between the RHL in field and nutrient uptakes, or between L* in solution and nutrient uptakes. Neither were any relations found between these root traits and nutrient concentrations, or ADM during the season for any of the cereal species. Further, none of these root traits were related to the grain yield. Hence, in general the answer to question 2 for the accessi-ons studied here was negative. The nutrient uptake was not significantly influenced by L* as measured in nutrient solution, or by RHL in field.
Nutrient uptake and the age of accessions
No significant relation was found between age of accession and uptake of N, P or K in ADM on any sampling date before the final harvest, with one exception. This was a negative impact of accession age on the P uptake at sampling 5, r = - 0.33* for wheat and r = - 0.51*** for barley. The total nutrient uptake in ADM at the final harvest (sum of grain and straw) was negatively correlated to the age of the accession both for N, P and K, in both cereal species. This reflects a generally lower grain yield for the oldest accessions, as shown in Figure 10. Hence, the answer to question 3 is negative. The nutrient uptake during the growing season was not significantly affec-ted by age of accession.
Nutrient uptake and lateness
For the season of 2000 there was a close correlation between days until ear emergence and days until maturity for barley (r2= 0.80***), and a weaker
correlation for wheat (r2= 0.48**). Hence, it seems
[image:12.595.78.523.576.726.2]reasonable to use the days until ear emergence recorded in 2001 as a general measure of the lateness, and this trait will further be referred to as the lateness of the accession.
11
Table 3. Average values for uptake of N, P and K in above ground plant DM for barley and spring wheat accessions grown with limited nutrient supply, 18 and 32 days after germination (sampling 2 and 4, respectively). The
accessions have been arranged by increasing P uptake at sampling 2. Maximum and minimum values have been shaded. LSD = Least significant difference
For wheat, the lateness varied only from 41 to 45 days, and no significant relations were found betwe-en the latbetwe-eness and amount of N, P or K in ADM at any sampling date, except from a positive correlati-on (r = 0.33*) for the K uptake at sampling 4. For barley, the lateness varied from 41 to 53 days, and among the modern accessions there was a conside-rable variation (Figure 5). The later barley accessi-ons had a lower uptake of P during most of the gro-wing season. Negative relations were found between lateness and P in ADM at sampling 1, 2, 3 and 4; 0.28(*) < r < 0.52***. At sampling 4, the lateness also had a negative impact on N in ADM;
r= -0,45**. Hence, the answer to question 4 is positi-ve. Lateness affected the nutrient uptake of the bar-ley accessions. However, it was expected that the latest accessions would have the highest nutrient uptake, but the result was contrary. Only in the mature grain and straw, the latest barley accessions had the largest amount of K in grain and straw, and of P in straw. As the barley plots were harvested within only four days, with small amounts of
preci-pitation during this period, this probably shows that later maturing accessions lost less K by the leaching episode on 1 September than earlier accessions.
Sampling 2, mg m-2 Sampling 4, mg m-2
N P K N P K
BARLEY
Tore 7.96 0.44 5.10 8.42 1.23 6.61
Herta 9.69 0.53 6.73 9.10 1.04 7.43
NOB019 9.59 0.58 6.58 8.89 1.21 8.34
NOB9319 8.66 0.61 6.51 9.33 1.25 7.20
NOB9306 9.73 0.62 6.63 8.95 1.25 6.62
NOB013 10.31 0.65 7.04 10.03 1.42 8.87
Dønnes 9.19 0.66 6.35 10.05 1.30 8.55
Fager 9.40 0.71 6.64 11.23 1.66 7.11
Herse 10.23 0.71 7.44 10.58 1.35 8.63
NK94682 9.84 0.72 6.79 9.88 1.58 8.52
Lise 10.04 0.72 7.28 10.86 1.71 10.15
LSD5% 2.03 0.17 2.07 2.17 0.50 2.41
WHEAT
NK97537 8.40 0.59 5.88 9.63 1.35 7.21
NK97535 8.33 0.60 5.90 9.57 1.41 7.68
NK0058 9.37 0.62 6.39 9.69 1.41 7.55
Diamant 8.25 0.65 6.47 8.93 1.15 7.40
Brakar 8.03 0.68 6.40 7.81 1.15 5.87
NK98602 9.81 0.71 7.25 10.13 1.49 8.57
Snøgg 9.51 0.73 7.46 11.08 1.52 9.33
Børsum 9.16 0.73 7.01 8.56 1.24 8.71
Møystad 10.20 0.86 8.07 9.28 1.20 7.64
LSD5% 1.67 0.20 1.45 2.42 0.39 2.49
[image:13.595.311.520.598.724.2]Fungal disease as related to age of
accession and ADM
In both field experiments, a significant variation (P< 0.02) was found among accessions with respect to mildew in wheat and scald in barley. The same wheat accessions were most susceptible to mildew with optimal nutrient supply and fungi-cide application in year 2000 and with limited supply and no fungicide in 2001 (Figure 6). Only negligible amounts of scald in barley were recor-ded in 2000; 1% for Fager and 0.5% for Dønnes, respectively. These accessions were very suscep-tible to scald also in 2001.
With limited nutrient supply in barley, the avera-ge FD1 values were avera-generally small and varied from 0.5% (NK94682) to 3.25% (Fager). There was a positive correlation between average FD1 and FD2 values, r = 0.88**. For FD2, the barley accessions were clustered in two groups. Herta, NOB013, NOB9310 and NOB019 had FD2 = 65% - 68%, and the other accessions 88-98%. The accession NK94682 was less infected by scald than any other barley accession, but had some infecti-on of other, unidentified fungi that prevented an exact record of the late scald attack. The pedigree of this accession
(Arve//HS72-8/MØ75-278/3/PH107) includes a line that is resistant to many scald isolates (Reitan et al., 2002) which explains this result.
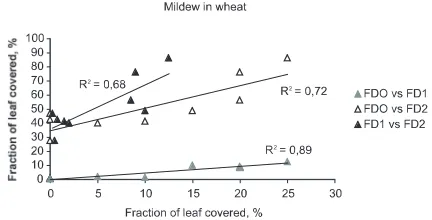
In wheat, the accessions were clustered in two groups with respect to FD1 values. The least sus-ceptible accessions were NK97537, NK97535, NK0058, NK98602 and Snøgg, with FD1= 0.25 to 2%. For the other accessions, the average FD1 varied from 8.5 to 12%. By the second recording of fungal disease, NK97535 was most resistant, FD2 = 28% (Figure 7). The accessions NK98602 and NK97537, selected for organic production, also had relatively low FD2 values.
[image:14.595.308.524.84.194.2]No correlation was found between age of accessi-on and the average FD1 or FD2 values in wheat, and not either in barley. The reason for this was probably that in wheat, the modern cv. Brakar was very susceptible to mildew, whereas the older accessions Snøgg and Børsum were less suscep-tible (Figure 7). For barley, the older accessions were heavily infected by scald in mid-August, but Herta was an exception to this (Figure 8). The modern accessions varied considerably, with three of the NOB-accessions having relatively low levels of disease, whereas NOB9306 had a higher FD2 value, comparable to the modern cultivars Tore and Fager. Because of the lacking scald records for cv. NK94682, this accession is not shown in Figure 8.
[image:14.595.307.523.341.476.2]Figure 6.Relations between average values for mildew susceptibility (fraction of leaves covered, %) with fun-gicide application in 2000 recorded on 27 July (FDO), and without in 2001 recorded on 10 July (FD1) and 16 August (FD2), for nine accessions of spring wheat. For each series, the first characteristic mentioned is shown on the x-axis, and the second on the y-axis.
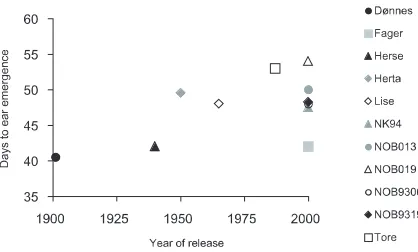
Figure 8.Fungal disease (FD2), scald, recorded on 16 August for accessions of barley grown without fungicide application, 2001, in relation to the year of release of the accessions.
[image:14.595.77.283.576.708.2]13
The answer to question 5 is that some modern accessions were much more resistant to the fungal diseases recorded here than some of the older accessions, but the variation was large and in general the age of accession was not related to the fungal disease. Both for wheat and barley, some older accessions were relatively resistant to mil-dew or scald, respectively. It should be noted that the selection of accessions was much less repre-sentative in 2001, when only 9 accessions of wheat and 11 of barley were grown, as compared to 2000 when these numbers were 17 and 35, respec-tively. In the 2001-experiment, the modern acces-sions constituted a relatively higher proportion than in 2000.
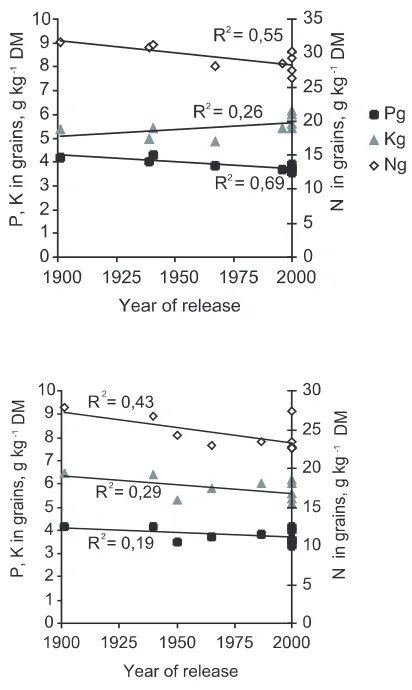
Nutrient concentrations in grains
The concentrations of N, P and K in grains were significantly different between barley accessions (P< 0.001), and the older accessions in general had the highest nutrient concentrations (Figure 9). The accession Fager was the only exception, with a mean grain N content of 27.4 g kg-1DM. In
wheat, the P and K concentrations were signifi-cantly different (P< 0.001), and as found for bar-ley, the oldest wheat accessions had the highest concentrations of P. However, the modern acces-sions had the highest grain K concentrations. As K is easily leached after maturity, this result may reflect that the wheat accessions in general were less mature than barley accessions at harvest.
Very close, negative correlations (r = -0.99***) were obtained between nutrient use efficiencies of grain (amount of grain DM produced per g nutri-ent taken up in grains) and the grain nutrinutri-ent concentrations of N, P and K in barley, and of P and K in wheat. For N in wheat, however, the correlation was somewhat weaker, r = -0.73*** (when omitting one replicate of NK97537 with an extraordinary high N concentration, 42.9 g N kg-1
grain DM). A strong and positive correlation was found between P and N concentration in grains, r = 0.53** in wheat and 0.71*** in barley. The relations between P and K, or N and K concen-trations, were not significant in wheat, but slight-ly positive in barley; for P vs K, r = 0.35* and for N vs K, r = 0.30*.
The HI of N and P (amount of N or P taken up in grain divided by the total amount of N or P in ADM at final harvest) was not significantly diffe-rent between the accessions. For N, the average values varied from 0.70 to 0.76 in barley (cv. NOB9319 and NK94682, respectively) and from 0.75 to 0.82 in wheat (cv. Brakar and NK97537, respectively). For P, the index varied from 0.81 to 0.86 in barley (cv. NOB013 and Dønnes, respectively) and from 0.75 to 0.85 in wheat (the same accessions as mentioned for N).
Based on these results, question 6 can be answe-red positively. The nutrient utilization efficiency is higher, and the grain nutrient concentration lower, in modern as compared to in old accessions.
Grain yields in relation to nutrient
supply and age of accession
With optimal nutrient supply, the average barley yields were 1 t ha-1higher than for wheat; 5.6 as
compared to 4.6 t ha-1. With limited nutrient
sup-ply, the grain yield levels were generally lower, and the average wheat and barley yields were almost equal; 3.6 and 3.8 t ha-1, respectively. In
[image:15.595.317.523.74.419.2]general, the ranking of accessions with respect to grain yield was comparable by both levels of nutri-ent supply. The relation between average yields for each accession in 2000 and 2001 were r = 0.71* for wheat and 0.69* for barley. However, barley cv. Lise performed relatively better with limited than
with optimal supply, whereas Tore and Fager per-formed better with optimal than with limited supply. The wheat and barley cultivars selected for organic farming performed well, especially with limited nutrient supply.
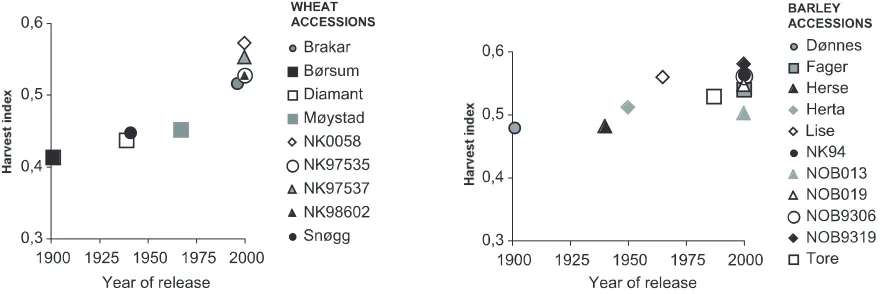
Both for wheat and barley, the grain yields were generally higher for modern as compared to older cultivars, regardless of nutrient supply (Figure 10, Table 4). The wheat cv. Brakar was an exception to this yield level pattern. This may be due to the sus-ceptibility of this cultivar to mildew. Another excep-tion was the wheat cv. Snøgg (released in1940), which performed relatively well and had a relatively large resistance to mildew.
An important reason for the higher grain yields in modern accessions was a generally higher HI, espe-cially in wheat. The relation between age of accession and the average HI for each accessiaccession was r = -0.92*** in wheat, and -0.72* in barley (Figure 11). Especially in barley, there was a large difference
between the modern accessions with respect to HI.
Grain yields as influenced by fungal
disease
As expected, the fungal disease had a negative impact on grain yields in both cereal species (Table 5). It is somewhat surprising that the impact of FD2, recorded in mid-August 2001, was not more closely related to the grain yields that year. As very few barley accessions were infected by scald at the date of recording in 2000, no correlation between fungal disease and grain yield were found in barley that year. The negative correlations between fungal dis-ease in 2001 and grain yields in 2000 show that for wheat, and as a tendency for barley, the susceptibili-ty to fungal disease was also reflected in the grain yield levels in 2000.
Surprisingly, neither FD1 nor FD2 had a negative impact on the ADM during the growing season (sam-pling 1-5). Further, no relation was found between FD1 or FD2 and straw yield by the final harvest in September. On the contrary, FD1 was positively cor-related to the ADM in barley on sampling 2, r = 0.28* and sampling 5, r = 0.30*.
The reason for this may have been that the earliest accessions (Fager, Herse, Dønnes; Figure 4) had produced relatively more ADM at sampling 2, on average 186 g m-2as compared to 153 g for the other
[image:16.595.308.522.168.282.2]8 accessions. At the same time, these accessions were somewhat more infected by scald in early July, on average FD1 = 3% as compared to 2% for the other 8 accessions.
Figure 10.Dry matter (DM) yields of grain (g), straw (str) and total DM yields (tot) for barley and spring wheat accessions released 1900-2000, in relation to the year of release of the accessions. Only grain DM yields were significanty influenced by the year of release.
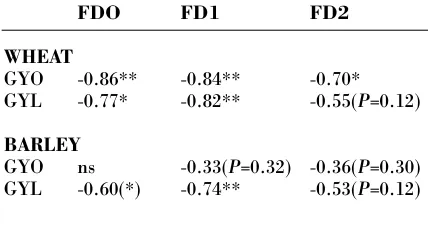
FDO FD1 FD2
WHEAT
GYO -0.86** -0.84** -0.70*
GYL -0.77* -0.82** -0.55(P=0.12)
BARLEY
GYO ns -0.33(P=0.32) -0.36(P=0.30) GYL -0.60(*) -0.74** -0.53(P=0.12)
[image:16.595.72.286.335.633.2]Grain yields as influenced by nutrient
uptake
As expected, there was a significant positive relation between the nutrient uptakes in ADM at the last sampling before final harvest, and the grain yield. In wheat, the N uptake had the largest impact. The regression coefficient between grain yield and N in ADM at sampling 5 was r = 0.85***, followed by the P uptake, r = 0.55** and the K uptake, r = 0.31(*). In barley, the P uptake had a relatively larger impact than in wheat, r = 0.55***, followed by the N uptake, r = 0.41** and the K uptake, r = 0.30(*). To assess the relative importance of various recor-ded traits for the grain yields, a stepwise regression model was made using the grain DM yield as respon-se variable (y-variable). The age of accession, lateness, fungal disease (FD1, FD2), HI and uptakes of N, P and K in ADM at sampling 5 (No5, Po5, Ko5) were used as x-variables. In addition, each accession was given a number 11 for barley and 1-9 for wheat, to include the genotype as x-variable in the analysis. The levels of significance for each term in the equations are shown.
The regression equation for barley was:
Y = -1771 + 0.92 x Po5** + 42 x lateness* -3235 x HI(*), r2(adj.) = 0.50
The regression equation for wheat was:
Y = -1504 + 7433 x HI*** - 8.7 x age***
+ 0.129 x No5** - 61 x genotype(*), r2(adj.) = 0.69
As some of the x-variables were correlated, stepwise regression must be interpreted with care. A further approach is provided by the PLS regression analy-sis, which solves and utilises multi-collinearity among the variables.
[image:17.595.80.521.73.220.2]15
Figure 11.Harvest index (grain DM relative to total above ground DM) for barley and spring wheat accessions released 1900-2000, in relation to the year of release of the accessions.
Table 4. Mean grain yields (15% water content) with optimal and limited nutrient supply for barley and spring wheat accessions, arranged by increasing yield levels with optimal nutrient supply. Maximum and minimum values are shaded. LSD = Least significant difference
Optimal supply Limited supply
t ha-1 WHEAT
Brakar 3.80 2.83
Børsum 4.26 2.81
Diamant 4.31 2.77
Møystad 4.38 3.47
NK98602 4.47 4.21
NK0058 4.70 3.80
NK97535 4.99 4.53
Snøgg 5.22 3.24
NK97537 5.49 4.82
LSD5% 1.27 1.07
BARLEY
Dønnes 3.61 2.95
Herse 4.49 3.43
Lise 5.34 4.03
NOB019 5.65 4.25
NOB013 5.73 4.05
Herta 5.85 3.61
NOB9319 5.85 3.98
Tore 5.92 3.73
Fager 6.12 3.31
NOB9306 6.42 4.03
NK94682 6.52 4.79
[image:17.595.71.280.354.685.2]Overview of results by partial least
square (PLS) regression analysis
For wheat, the first principal component (PC1) reflects variability in the DM production during the growing season. There was a close relation between the y-varia-bles describing ADM recorded at sampling 1, 2, 3, 4 and 5 (DM1 etc.). These variables are clustered to the right along the horizontal axis that constitutes PC1 (Figure 12a). The straw yield (DMstr) and uptake of N, P and K in ADM at each sampling (Nu1, etc.) were clo-sely correlated to the ADM during the growing season. The N concentrations in ADM (N4, N5) and N and K in straw were negatively correlated to the ADM producti-on, as shown by their location to the left along the PC1 axis. The N concentration at sampling 5 had the largest average impact on the DM production in general, as well as on the grain yields in wheat. The second PC, shown as the vertical axis in the plots, reflects allocati-on of the ADM into the grain. DMg is located allocati-on the negative side of the PC2, whereas DMstr and DM1-5 are located slightly on the positive side. The total ADM at the final harvest (DMtot) was more related to the DM yield of grain (DMg) than to ADM at sampling 1-5 (DM1 etc.), as it is located close to DMg and more downwards along PC2. Among the x-variables, the total uptakes of N, P and K (Nutot etc.) as well as uptakes in grain (Nug etc.) were closely related to the grain yield, as shown by the clustering of these variables in the loa-ding plot. PC2 was related to age of accession (Age) and fungal disease (FD1, FD2, positive side of PC2), which were both negatively related to DMg, and to the HI, (negative side), which was positively related to DMg. The corresponding scoreplot, presented as average value of each accession (Figure 12b), shows large diffe-rences between the accessions. Not released wheat accessions had the highest total nutrient uptakes and grain yield levels, whereas Brakar and Diamant had low levels. All the high yielding accessions N58 (=NK0058), N35 (=NK97535), N37 (=NK97537) and N02 (=NK98602) are located in the fourth quadrant, positively related to grain yield. These accessions were relatively resistant to mildew (Figure 7), they were young (not yet released) and had a large HI (Figure 11). The modern accession Brakar was located to the left due to its susceptibility to fungal disease and low grain yield. The much older accession Snøgg was loca-ted in the first quadrant, describing that this accession produced much total DM, but only had a medium grain yield due to its relatively low HI.
The PC1 explained 36% of the total variability in the y-variables for wheat (Table 6), and PC2 explai-ned another 16% as evaluated by cross validation. With respect to the wheat grain yield, a total of 97% of the variability could be predicted from the signifi-cant principal components. The number of these was 10. The PC1 explained 42%, and PC2 another 39% of the grain yield.
Both for wheat and barley, there was a significant effect of soil variation within the field, as shown by the replicate number (re1, etc.) in the loading plots. Results of the PLS regression performed on a subset of the replicates was, however, similar to the overall
analysis (results not shown). This shows that the blocking design of the experiment successfully limi-ted the effect of soil variation.
In barley, the PC1 in the loading plot (Figure 13a) reflects variability in DM production. This pattern was also found for wheat, however the relation among the ADM values at sampling 1-5 was somew-hat less clear for barley than for wheat. The ADM in mid-August (DM5) was closely related to the total ADM at final harvest, as well as to the grain yield level. These characteristics and the nutrient uptake in grains dominated on the positive side of PC1, whereas a cluster of nutrient concentrations, especi-ally N3, 4 and 5 dominated among the x-variables on the negative side. The age of accession was loca-ted negatively to the DM production and the grain yield, and has been shown in the diagram although it was not selected as significant according to the Jack Knifing procedure. The PC2 was determined mainly by the lateness of the accession (Ear), loca-ted on the negative side of the axis.
The PC1 explained 43% of the total variability in the y-variables for the barley accessions (Table 6), and PC2 explained another 15% as evaluated by cross validation. With respect to the barley grain yield, a total of 55% of the variability could be pre-dicted from the significant principal components. The number of these was 11. However, in contrast to what was found for wheat, the PC1 and PC2 descri-bed more of the variability in grain yields that the PC2 did; 55% and another 24%, respectively. The score plot for barley (Figure 13b) shows large diffe-rences between the accessions. However, it is somew-hat surprising tsomew-hat the four accessions with the initi-als NOB (NOB013 = N13, etc.) were not more dense-ly clustered, because of their common pedigree (Løes and Gahoonia, submitted). NK94682, NOB013 and Lise had the highest grain yields, and Tore per-formed poorly.
Total Grain Straw WHEAT
PC1 36 42 15
PC1-2 52 81 10
PC1-3 69 85 65
PC1-6 79 97 81
BARLEY
PC1 43 55 25
PC1-2 58 79 16
PC1-3 60 80 28
[image:18.595.311.524.623.773.2]PC1-11 88 91 83
17
[image:19.595.80.521.458.709.2]Figure 12b.Score plot of PLS regression analysis for 9 wheat accessions grown with limited nutrient supply. PC1 and PC2 are shown. The names of accessions are abbreviated by the first three letters (Dia = Diamant, etc.). For accessions identified by numbers, the last two numbers are shown (NK98602 = N02 etc).
Figure 13b.Score plot of PLS regression analysis for 11 barley accessions grown with limited nutrient supply. PC1 and PC2 are shown. The names of accessions are abbreviated as described in Fig.12b. N13=NOB013, N19= NOB019, N9=NOB9319, N6=NOB9306.
19
DISCUSSION
In short, the answers to the initial six questions were that the ranking of accessions with respect to RHL was not the same in field as in nutrient solution. Only for a few accessions, a relation bet-ween L* or RHL and the nutrient uptake was found. The age of accession was not found to influence the nutrient uptake. For the barley accessions, lateness had a negative impact of the nutrient uptake. This was contrary to what was expected, namely increased nutrient uptake by an increased growing period. The resistance to fun-gal diseases varied among the modern as well as among the older accessions, but in general, the modern accessions were less susceptible. The con-centrations of nutrients in grains were higher in older than in modern accessions.
Impact of root traits on nutrient
efficiency
Many previous studies (Gahoonia et al., 1999; Nielsen and Schjørring, 1983; Römer et al., 1988; Römer and Schenk, 1998; Bertholdsson, 2000; Watt et al., 2001) have demonstrated significant genetic variation in root traits. Some of these stu-dies (Nielsen and Schjørring, 1983; Bertholdsson, 2000) did also show a clear relation between root trait differences and grain yields. The present study could not confirm the relationship of root traits to nutrient uptake or grain yield. The results of Manske and Vlek (2002) may contribute to explain this. These authors found that root length density in soil was only positively correla-ted to wheat grain yields with low P-supply. With high supply, there was a negative effect of high root density on grain yield level, explained by the carbon costs to produce the roots. The nutrient supply in the field experiment of the present study was low for Norwegian conditions, and the nutrient supply was indeed limited, only 50 kg N ha-1. Still, the nutrient supply might have been
above a level where the differences in L* or RHL could have a significant impact. The grain yields were equal to the average grain yields reported by Kerner (1994) for commercial organic farming systems, fertilized with on average 25 t farmyard manure ha-1y-1. This reflects that when a small
amount of easily available N is provided, cereal crops have a large capacity to take up P and K from soil, even when reserves of these nutrients are small.
With respect to RHL, most evidence for the importance of these plant organs in nutrient upta-ke have been achieved in controlled environment studies (Gahoonia et al., 1997; Gahoonia and Nielsen, 1998; Bates and Lynch, 2000). However, in field the results regarding the impact of root hairs on nutrient uptake remained less clear. Wen
and Schnable (1994) found no restrictions in field growth for maize mutants with very restricted root hair elongation. In a study of pairs of barley and wheat accessions with long vs. short root hairs, the barley accession with long root hairs had a significantly larger uptake of P in field. However, in wheat, the accession with the shor-test root hairs took up most P (Gahoonia et al., 1999), possibly due to P-mobilizing factors such as root exudates. These results may contribute to explain why RHL only in a few cases was positive-ly related to the nutrient uptake in the present study.
Impact of other factors influencing
nutrient uptake and grain yield
In most previous studies of nutrient efficiency in cereals, variables such as susceptibility to fungal disease and lateness have not been discussed. Our study highlights the importance of linking root traits and nutrient efficiency with such traits of cereal accessions to achieve results that may be reliable and useful for low-input farming systems like organic farming. Further, it must be mentio-ned that the present study mainly concentrated on morphological root traits like L* and RHL. Other possible differences in root traits, such as the exudation of organic acids or the association with arbuscular mycorrhiza, might have contri-buted to explain the differences in nutrient upta-ke under conditions of limited nutrient supply.
Impact of breeding on nutrient
efficiency, grain nutrient concentrations,
fungal disease and grain yields
breeding in the first part of the last century did not impact nutrient efficiency, there is a possibili-ty that the last decades of breeding has caused a decreasing ability to take up nutrients from soil. This should be further studied.
The grain nutrient concentrations in the present study were generally higher, and the nutrient use efficiencies lower, in older as compared to modern accessions. This is in accordance with Austin et al. (1980), whereas Foulkes et al. (1998) did not find any significant relationship.
However, the years of release for the accessions studied by Austin et al. (1980), 1900-1986 were more comparable to those in the present study. A lower nutrient concentration in the grains is not fortunate for farming systems with limited nutri-ent supply and pesticide use because it may decrease the early growth vigor and hence the competitive ability of the seedlings. This topic should be addressed in future cereal breeding.
Resistance to fungal disease has been an essential goal in Scandinavian cereal breeding, and this was reflected in the present data. Stöppler et al. (1989) also found that the susceptibility to mildew was larger for the older accessions of wheat, and that this contributed to significant higher yield levels for modern as compared to old accessions grown in an organic farming system. In the pre-sent study, some modern wheat accessions had a relatively strong resistance to mildew, and some modern barley accessions to scald. However, some older accessions were also relatively resis-tant. All accessions with a relatively high uptake of nutrients were those which were less suscep-tible to fungal disease (compare Figure 3 with Figures 7 and 8). A reason for this may be that these accessions were able to keep the nutrient uptake at a high level for a longer period of time because they kept their leaves green longer.
Not surprisingly, the results demonstrated close relationships between ADM production and N, P and K uptakes. ADM as well as the amounts of N, P and K included in ADM accumulated during the growing season, until the amount of K taken up declined from sampling 4 onwards (early August). Some accessions, notably wheat cv. Snøgg, NK98602, NK97535 and NK97537, and barley cv. Lise, Fager and NK94682, had a relati-vely higher nutrient uptake during the season than the other accessions. In some cases, the accessions with the highest nutrient uptakes also had high grain yields, and for barley, the uptake of P at sampling 5 was an important explanation for the grain yields. However, in general the rela-tion between nutrient uptake in ADM in mid-August (when the grain-filling period started) and the grain yields was weaker than could have been expected with the limited nutrient supply. In accordance with other authors (Stöppler et al., 1989), the modern accessions produced higher
grain yields than older accessions both with limi-ted and with optimal nutrient supply. This is not because the modern accessions have an increased ability to take up nutrients from soil, but an increased HI and increased resistance to fungal disease contributed to this result both in the pre-sent study and in the study of Stöppler et al. (1989).
Accessions of special interest for
further breeding
The wheat cv. Møystad demonstrated an interes-ting correlation between root hairs and high nutrient uptake levels in the early growing sea-son. The wheat cv. Snøgg seemed to combine a high nutrient uptake, possibly correlated to a high L* value measured in nutrient solution, with a favorable resistance to fungal disease. In orga-nic farming systems with animal husbandry, cere-al straw yields are of interest both as fodder and for bedding. Hence, some of the older accessions such as Snøgg and Møystad may be of interest for organic farming systems because of their higher straw yield (Figure 10). Some modern accessions, such as wheat accessions NK97537 and NK97535 and barley NOB013, also had high straw yields. Both wheat accessions selected for organic far-ming, NK98602 and NK97537 performed well and produced high grain yields regardless of nutrient regime conditions. NK97537 also had a large straw yield, and hence is of special interest for organic farming systems. However, it was taken out of breeding in 2002. Among the barley acces-sions selected for organic farming, NOB013 see-med to be the best when both grain and straw yields are considered. NK94682, actually selected for conventional farming, performed best of all the barley lines and could probably have become a good cultivar for organic farming systems. However, this accession was also taken out of bre-eding in 2002, as well as all NOB-accessions.
21
CONCLUSION
The present study has demonstrated that root traits should not be considered alone, but as an integrated part of other yield determining factors to provide a meaningful explanation of the nutri-ent uptake during the growing season. Hence, records of root traits, fungal disease, lateness of accessions and grain and straw yield at harvest, should be essential for selection of accessions for farming systems with limited nutrient supply and pesticide use. In many cases, records of root traits may be necessary, especially in the initial laboratory screening of accessions. However, recording the ability to produce satisfactory grain yields with limited, but well-defined field conditi-ons, may be a simpler indirect measure of nutri-ent efficiency in cereals, that comes close to far-mers' practice. On the whole it seems that the achievements of conventional cereal breeding have also been useful for organic farming sys-tems.