A METHOD TO MEASURE THE INFLUENCE OF HUMIDITY AND
TEMPERATURE ON THE INTERFACIAL ADHESION IN POLYAMIDE
COMPOSITES
A. Kerrie A. Downesa*, B. James L. Thomasonb,
a
Department of Mechanical and Aerospace Engineering, University of Strathclyde,
75 Montrose Street, Glasgow, G1 1XJ, United Kingdom
Keywords: Glass Fibre, Polyamide, Interfacial Shear Strength, Adhesion, Microbond
Abstract
The work presented focuses on the need to better understand the effect environmental
conditions, namely humidity have on the interfacial shear strength (IFSS) of composites. The
IFSS was first characterised using the microbond test method in a laboratory atmosphere. A
specialised rig was then designed and manufactured in order to carry out the microbond test
in a Dynamic Mechanical Analyser with a humidity chamber accessory. Due to the
well-known moisture absorbing nature of polyamide matrices the effect of a range of conditions
from 0% to 90% relative humidity were investigated. Results presented for both methods are
based on the use of a PA6 matrix. Steel fibres are used extensively for method development
and comparison throughout this work. Finally, successful testing on the primary system of
fully sized HiPer-Tex™glass fibre polyamide 6 effectively shows that humidity influences the
1. Introduction
Glass fibre reinforced polyamides are widely used in industrial applications due to their relatively high stiffness and strength; they also possess high temperature resistance which is particularly attractive to the automotive industry. Polyamide 6 (PA6) is widely known to provide a reasonable performance to price ratio and possesses good design flexibility due to its high flow rate [1]. Coupled with an increased demand for these composites, is the recognition for a better understanding of the fibre matrix interface that exists. The interaction and stress transfer between the matrix and reinforcing fibre at this interface is widely accepted as key to the overall performance of the composite.
PA6 has one of the highest rates of moisture absorption and it has been extensively reported by Thomason et al. that the mechanical properties of similar polyamides and resulting composites they are used in, are markedly decreased upon moisture absorption [8–12]. Consequently it was noted, that in order to assess the effect of moisture on the IFSS measured during the microbond test that a controlled environment is required. The microbond experiments presented in this paper were developed specifically with this GFPA6 material system in mind meaning the optimal conditions necessary for successful droplet debond were investigated fully before testing was carried out. All tests were initially carried out in the laboratory atmosphere at room temperature on a rig used extensively by Yang et al. [6]. Typical debonding characteristics were observed and the results are presented and discussed.
2. Experimental
2.1. Materials
Experiments were carried out on HiPer-Tex™ glass fibre taken from a roving with a full commercial sizing and an average diameter of 14μm, this was received directly from 3B – The Fibreglass Company. The PA6 used throughout this work was BASF Ultramid B3 and was received in pellet form. The steel fibre used was purchased from GoodFellow and was a stainless steel with average diameter 50μm.
2.2. Sample Preparation
The microdroplet sample preparation method, developed and described was universal throughout this work. PA6 was received in pellet form and it was necessary to begin by isolating a smaller fibrous amount of polymer to be arranged on the reinforcing fibres for droplet formation. The first step in doing this was to heat a small number of pellets on a glass slide placed on a pre heated to 275°C hot plate. When the PA6 began to melt single fibres were pulled and collected using tweezers. The next step was to prepare a single reinforcing fibre to receive the PA6: a short length of glass or steel fibre was selected from the roving and suspended in front of a light source. At this stage it was possible to tie a section of PA6 fibre around the single suspended fibre. The free ends of PA6 were trimmed and the sample mounted onto a metal frame. This configuration was then placed in a preheated oven at 250°C
rapid air cooling, this was found to be a sufficient process to aid in the symmetrical microdroplet formation process. The samples were then transferred to paper tabs with care taken to maintain a free fibre length of 5mm between the card edge where the glass fibre is secured with gel glue, and the free hanging microdroplet. At this stage samples were viewed under an optical microscope and measurements of the fibre diameter (Df), droplet diameter (Dd) and embedded length (Le) were obtained.
2.3. Room Temperature Microbond Test
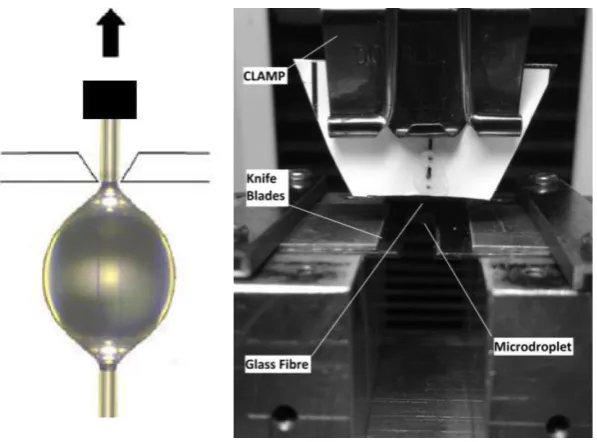
The apparent IFSS of GFPA6 and SFPA6 was initially measured on an Instron 3342 tensile test machine with 10N load cell and laboratory developed microbond rig (6). The card tabs on which samples are mounted were secured in the Instron tensile test machine with the microdroplet hanging down to be restrained by the shearing blades on the microbond rig as shown in figure 1. A microscope and scope tech camera were utilized for on screen live imaging of the process. Carrying out experiments for both material systems on the instron rig allowed for accurate comparisons during the DMA method development and also provided a baseline guide value for the apparent IFSS in both systems.
Figure 1. Instron laboratory atmosphere microbond test setup
The environmental conditions in the laboratory were recorded as approximately 30% relative humidity and an average temperature of 25°C. The rate of fibre displacement was set at
ramp rate used at 5mm gauge length tensile tests. The load displacement curve for each test was recorded and a typical graph for both material systems is shown in figure 2.
Figure 2. Typical load displacement curve produced by instron microbond test
The apparent IFSS for each individual test was calculated using the following equation:
𝜏 =𝜋.𝐷𝑓.𝐿𝑒𝐹𝑚𝑎𝑥 (1)
Where the graph provides the maximum force (Fmax), and the fibre diameter (Df) and embedded length (Le) are as measured in the optical microscope. A minimum of 20 successful tests for each material combination were analysed.
2.4. Controlled Environment Microbond Test
It should be noted at this stage that the sample preparation was as described for the room temperature Instron microbond test and remains unchanged throughout. However, there were three key challenges to overcome in order to facilitate the functional measurement of the apparent IFSS through the microbond test in the DMA humidity chamber. They are as follows:
1. Sample mounting – how to clamp the glass fibre to the central moving shaft
2. Droplet restraint – to manufacture a clamp to be attached via the four mounting posts that will provide the shearing blades to enable debonding of samples
3. Method – to develop a suitable test method in the DMA software to perform and record the desired experimental outputs
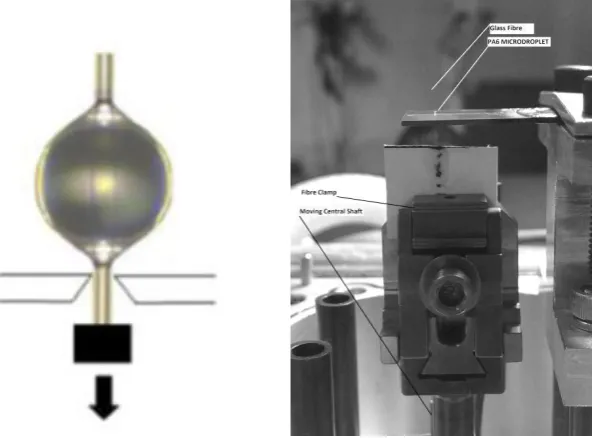
For film testing the DMA kit includes a film clamp for attachment to the central moving shaft. It was noted that by inverting the initial experimental set up to as shown in figure 3, whereby the reinforcing fibre is subjected to an increasing downwards force, we could clamp the card tab with the sample pointing upwards on the central shaft and design a microblade vice to be mounted on the stationary posts, above the sample.
Figure 3. DMA microbond inverted loading and sample set up
along one of the surfaces. Based on the design used by Yang during similar method development [13] a small angle of approximately 1.2 degrees was deliberately designed between these two blades to facilitate sliding of the fibre into the gap. This also ensured the required experimental condition that there was no gap between the fibre and the shearing blades for each fibre, despite the individual variations of fibre diameter from sample to sample. Compared to the perfect parallel shearing blade system that is used in room temperature testing, this angle leads to the difference of 0.33% in the fibre perimeter in loading points around the fibre on each side. However, this slight non-parallel alignment of the shearing blades was not expected to have any significant effect on the loading pattern of the resin droplet in comparison with the conventional parallel slot. The two blades were welded together with a third joining piece of steel. Once the blades were complete the focus was placed on how exactly to mount the blades at a height and position which would allow the central shaft to move freely but still be close enough to maintain the 5mm free fibre length as well as leaving the blades easily accessible. An I-beam was manufactured that was attached to two of the mounting posts as shown with the blades positioned directly above the shaft. This allowed maximum access for sliding the samples into position between the blades before securing in the film clamp.
displacement of the fibre at a constant rate, however whilst the DMA was able to operate in this mode when the droplet debonded from the fibre the run does not automatically end. This gave rise to a few issues not least that the shaft would continue to try and displace the sample and therefore move the full length of the shaft damaging the remaining sample fragments. The film/fibre testing mode with a custom force ramp was used whereby the DMA was configured to measure sample displacement during a linear force ramp which was subject to run completion upon debond. A typical load displacement curve is shown in figure 4.
Figure 4. Typical DMA successful microbond load displacement curve
debond in the Instron laboratory condition testing. Using the maximum recorded force and equation (1) the apparent IFSS of samples tested in the DMA were calculated and presented.
3. Results and Discussion
The results of the microbond tests carried out on GFPA6 samples in the laboratory atmosphere on the Instron machine are shown in figure 5. A large spread in data points is observed as expected for a test of this nature in which there occurs a natural variation in droplet sizes across the sample set. This is typically due to human operation which results in a range of embedded fibre lengths as observed. This spread in droplet size is also exhibited in SFPA6 sample analysis.
Figure 5. Laboratory atmosphere Instron machine microbond test results
altering the equilibrium in the microdroplets which would be an influencing factor on the failure of the sample interface. The unknown moisture content of the PA6 matrix is as previous discussed a parameter which should be known and controlled to provide the most accurate analysis of the interaction between these two materials.
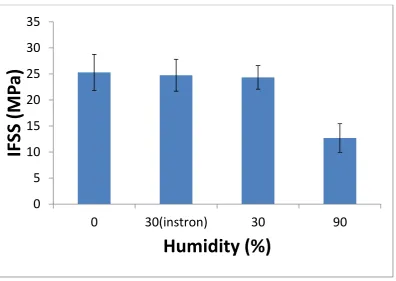
As previously mentioned SFPA6 samples were also tested on the instron rig to provide a baseline result for the system. This set of results was also used for method comparison during the development of the microbond test in the DMA humidity chamber. Figure 6 shows the apparent IFSS for SFPA6 samples carried out in the DMA at 0% humidity, 30% humidity and 90% humidity, compared with the Instron room conditioned sample results. The temperature condition for each of these sets of tests was the average measured room temperature and set in the DMA chamber as 25°C.
Figure 6. SFPA6 DMA method development microbond test results
temperature and humidity. All Instron tests are conducted under conditions taken from an average of environmental readings whereby the droplet may not be in a state of equilibrium and therefore each droplet may be at various stages of moisture uptake or drying out. This conclusion gives further justification for the range of results noted in Instron results presented in figure 5.
From figure 6 it is also clear there is an effect on the apparent IFSS as a direct result of an increasing humidity in the atmosphere. During high humidity conditioning in the DMA it would be expected that the microdroplet would up take moisture from the atmosphere inside the chamber and swell. Analysis of the DMA recorded data shows during conditioning there exists a change in the displacement of the central shaft on which the sample is attached. This suggests the polymer reacts as expected; it takes up moisture during the humidity ramp and iso conditioning sections of the experiment and is reflected in a decreased value of adhesion.
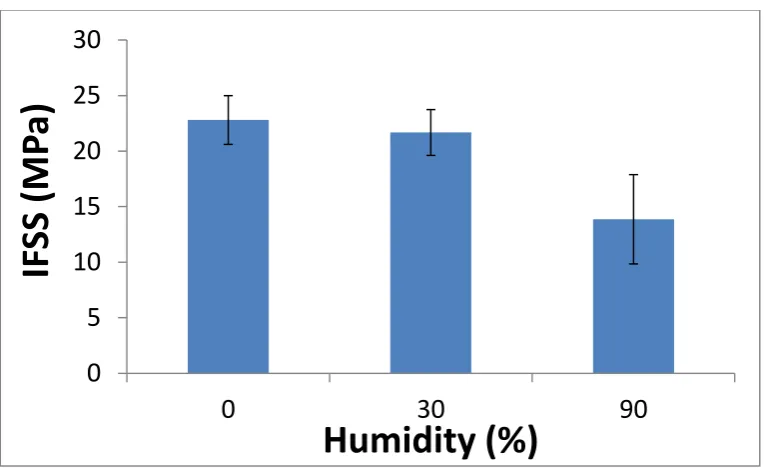
Initial work with glass HiPer-Tex™ fibres in the DMA also exhibited similar trends in adhesion. Figure 7 shows that as the humidity in the chamber ramps and iso conditions at 90% humidity, the level of apparent IFSS can decrease up to 40%.
Figure 7. GFPA6 DMA changing humidity condition microbond results
4. Conclusions
test machine with a custom rig. Due to the moisture absorbing nature of polyamides and the importance of interface stress transfer in composite performance a novel method was designed and carried out using a DMA machine with an environmental chamber to allow humidity defined microbond tests to be conducted. This method was first developed using the high strength steel fibre samples where the Instron baseline values were used for method validation. It was noted that with the absence of moisture the apparent IFSS value increased from what was first recorded during standard laboratory testing. Most significant was the marked decrease in IFSS as a result of 90% humidity chamber conditions. These findings were in agreement with studies carried out by Prabhakaran et al. in which it was noted that composite properties and in particular properties which were highly dependent on the matrix were significantly affected by moisture [12]. Micromechanical tests by Thomason et al. confirm also that large scale samples are subject to decreased performance as a direct result of moisture absorption into a polyamide matrix. This body of work reinforces the need for further investigation into the changes that occur to composites throughout their lifetime as a result of environmental conditions and how this can affect their overall performance. In conclusion, the work presented in this paper has shown that as a direct result of the presence of elevated humidity, a signification reduction in the apparent IFSS was measured for both steel fibre and glass fibre polyamide 6 composites samples.
Acknowledgements
References
1. Benseddiq BMI. A Fracture Analysis of Short Glass Fibre Reinforced SGFR-PA66. Book of Particle and Continuum aspects of Mesomechanics. 2007.
2. Herrera-Franco PJ, Drzal LT. Comparison of methods for the measurement of fibre/matrix adhesion in composites. Composites. 1992;23:2–27.
3. Zhandarov, S. Mader E. Characterization of fiber/matrix interface strength: applicability of different tests, approaches and parameters. Compos. Sci. Technol. 2005;65:149–160.
4. Gray RJ. Experimental techniques for measuring fibre/matrix interfacial bond shear strength. Int. J. Adhes. Adhes. 1983;3:197–202.
5. Devaux E, Campagne C, Caze C. New micromechanical experimental approach for the characterization of fibre–matrix adhesion in composite materials. Polym. Test. 2001; 20:671–676.
6. Yang L, Thomason JL. Development and application of micromechanical techniques for characterising interfacial shear strength in fi bre-thermoplastic composites. Polym. Test; 2012;31:895–903.
7. Cho D, Yun SH, Kim J, Lim S, Park M, Lee S-S, Lee G-W. Influence of silane
8. Rajesh JJ, Bijwe J. Effect of water absorption on erosive wear behaviour of polyamides. Mat. Sci. 2002;7:5107–5113.
9. Thomason JL, Ali JZ. The dimensional stability of glass–fibre reinforced polyamide 66 during hydrolysis conditioning. Compos. Part A Appl. Sci. Manuf. 2009 ;40:625– 634.
10. Thomason JL, Porteus G. Swelling of Glass-Fiber Reinforced Polyamide 66 During Conditioning in Water , Ethylene Glycol , and Antifreeze Mixture. Polymer (Guildf). 2011;
11. Thomason JL, Ali JZ, Anderson J. The thermo-mechanical performance of glass-fibre reinforced polyamide 66 during glycol – water hydrolysis conditioning. Compos. Part A Appl. Sci. Manuf . 2010; 820-826
12. Prabhakaran RTD, Andersen TL, Lystrup A. Influence of Moisture Absorption on Properties Of Fiber Reinforced Polyamide 6 Composites. 2012.
13. Thomason JL, Yang L. Temperature dependence of the interfacial shear strength in glass–fibre polypropylene composites. Compos. Sci. Technol. Elsevier Ltd.
Figures
[image:16.595.120.480.457.642.2]Figure 1.Instron laboratory atmosphere microbond test setup
Figure 3. DMA microbond test with inverted loading direction and sample set up
[image:17.595.129.475.443.594.2]Figure 5. Laboratory atmosphere Instron machine GFPA6 microbond test results
Figure 6. SFPA6 DMA microbond method development results
0
100
200
300
400
0
5
10
15
20
P
e
ak
Load
(mN)
Embedded Area (1000µm²)
0
5
10
15
20
25
30
35
0
30(instron)
30
90
IF
SS
(MP
a)
[image:18.595.100.497.351.632.2]Figure 7. GFPA6 DMA changing humidity condition microbond results