International Journal of Innovative Technology and Exploring Engineering (IJITEE) ISSN: 2278-3075, Volume-8 Issue-9, July 2019
Enhancing Cell Throughput & Area Spectral
Efficiency Using Two Level Soft Frequency Reuse
Technique
Baljot kaur, Garima Saini
Abstract: Heterogeneous networks consist of different characteristics of networks like small cells having low power deployed along with macro cells having high power. Interference is the major issue to degrade the quality of signal in the heterogeneous networks. Number of interference coordination techniques are implemented to minimize interference. One of the interference coordination technique is fractional frequency reuse (FFR) and soft frequency reuse (SFR). In this paper two level Soft Frequency Reuse technique is implemented along with sectors. Parameters such as area spectral efficiency and cell edge throughput are calculated and compared with conventional FFR and Multi-level FFR technique with 6 sectoring. Better results are analyzed while simulating in the network model. Cell edge throughput improved to 54 Mbps, average cell throughput improved to 667 Mbps, peak data throughput improved to 76.7 Mbps and area spectral efficiency improved to 70.3 bits/sec/Hz/cell.
Keywords: Area spectral efficiency, Fractional Frequency Reuse (FFR), Interference, Millimetre wave band, 5G.
I. INTRODUCTION
Number of mobile users and demand for high data rate is increased exponentially over few years. In order to fulfil the urge for high data rate, maximum frequency reuse should be done [1]. Frequency reuse scheme is used to increase efficiency as well as quality of signal. There are two different frequency reuse techniques Reuse-1 and Reuse-3. In reuse-3 scheme it provides barrier against inter-cell interference by using only one-third of resources in each cell. In reuse-1 scheme all resources are effectively utilized by each cell. It also enhance the spectral efficiency. But cell edge area suffers from interference. If both the schemes are combined efficiently it gives better results as well as protection against interference. Conventional frequency reuse technique not suitable for heterogeneous network because of inter-cell interference. That's why FFR and SFR techniques are introduced [2]. In fractional frequency reuse technique total geographical area is partitioned into two parts i.e. centre region and edge region. Centre region can use similar frequencies while edge region use different frequencies in order to reduce interference from the neighbouring cells as well as enhance the spectral efficiency [3].
Revised Manuscript Received on July 05, 2019.
Baljot kaur, M.Tech Student, Department of Electronics & Communication Engineering, National Institute of Technical Teachers Training & Research, Chandigarh, India
Garima Saini, Assistant Professor, Phd persuing, Department of Electronics & Communication Engineering, National Institute of Technical Teachers Training & Research, Chandigarh, India
In [4] author explained FFR as one of the interference coordination techniques and helps to find out cell throughput as well as threshold value. Author uses two scheduling techniques for analyzing threshold value i.e. round robin and maximum SINR and with the round robin scheduling technique better results are observed. In [5] author introduces iterative multi level soft frequency reuse which helps to solve the non convex problem occurred in multi level soft frequency reuse (ML-SFR). ML-SFR is used to improve the system capacity but it also increases the interference problem. In [6] author discussed about two frequency reuse techniques i.e. soft frequency reuse and strict frequency reuse. The results of both techniques are compared with conventional frequency reuse technique. Finally, better results are achieved for soft frequency reuse technique. Author in [7] discuss about heterogeneous network that uses both high power as well as low power nodes. Proper power control strategies are implemented to reduce interference among nodes having high power as well as nodes having low power. Technique is developed to solve convex dual problem. In [8] author discuss about pitfalls of conventional frequency reuse technique that it helps to enhance the system capacity but also increases interference. So in order to tackle interference problem, cell is partitioned into different zones like centre and edge and mostly cell edge area get effected by interference thus multi-level helps to improve its throughput. In [9] author introduces higher order sectoring which helps to improve the capacity of system and throughput of edge region is also enhanced. Using millimetre frequency with fractional frequency reuse, better results are achieved. The rest of paper is organized as section 2 discuss about network model which is known as 2L-3 sector SFR, section 3 discuss about the simulation and results and the last section 4 concluded the paper.
II. 2L-3 SECTOR SFR TECHNIQUE
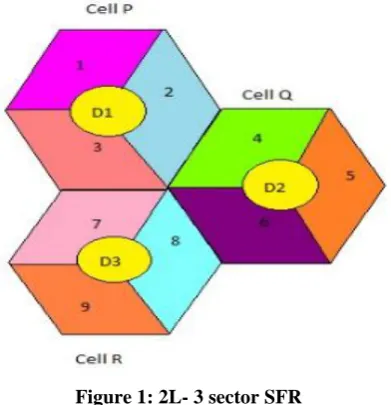
Soft frequency reuse is used for managing interference issues. Sectoring is done to improve the capacity of the system. When both techniques get combined they provide significantly improved results in terms of interference as well as overall bandwidth utilization. In 2L-3 sector SFR scheme, total geographical area is partitioned into different hexagonal cells such as cell P, cell Q and cell R as shown in Figure 1. Each cell is again partitioned into two parts i.e. centre user area (CUA) and edge user area (EUA). Centre user area is known as inner region and edge user area is known as outer region. Users
user area support FR3. The CUA can use entire bandwidth
where as EUA can use only limited bandwidth.The SINR threshold parameter is used to decide either user lie in CUA or EUA. If user having less value than SINR threshold value then user lie in EUA region having FR3 otherwise user lie in
CUA region having FR1. The focus of FR3 is to enhance the
[image:2.595.74.270.140.343.2]SINR so that minimum resources can be used.
Figure 1: 2L- 3 sector SFR
Sectoring is done in the edge user area. The EUA is sectored into 3 parts having 120o beam width Omni-directional antennas in each sector. Total available bandwidth of 500MHz is divided into 9 parts known as resource blocks. Each cell is assigned with different sub bands except the CUA. The CUA uses entire bandwidth except those frequencies which are allotted to EUA. In cell P CUA is assigned with D1 whereas EUA is assigned with f1, f2 and f3 frequencies. In cell Q CUA is assigned with D2 whereas EUA is assigned with f4, f5 and f6 frequencies. Likewise in cell R CUA is assigned with D3 whereas EUA is assigned with f7, f8 and f9 frequencies. Users reside in EUA will not interfere with the CUA.
The region in which user reside in will be decided according to:
UEi
(1) is the SINR threshold and is the measured threshold value. If user having low SINR than threshold value it will lie in edge user area i.e. outer region whereas user having high SINR than threshold will lie in centre user area i.e. inner region.
A. SFR Cell Throughput
SINR of the user can be calculated by using mathematical equation given in [10] as:
(2)
denotes transmitted power from m base station with x sub carrier, denotes channel fading from m base station having channel x for user u, denotes channel path loss from base station x for user u, N denotes noise component, L and k denotes interfering base stations. Path loss can be measured as:
(3)
(4) here c represents speed of light and f represents carrier frequency.
Channel capacity can by calculated by using Shannon's formula which is given by:
C = B log2 (1+ SINR) (5)
For resource assignment bandwidth is divided into two regions centre user area and edge user area. Total bandwidth of three sector is given by Btotal . Bandwidth of one sector is
given by:
Btotal = BCUA + BEUA (6)
where BCUA is the bandwidth of centre user area and BEUA
is the bandwidth of edge user area. Bandwidth in normalized form is given as: =
, where 0 (7)
Total bandwidth for one sector will be given as:
.Btotal+ (1- Btotal (8)
where BFR denotes the bandwidth of one cell.
It is known that Btotal BFR :
when = 0
, identical to FR3 (9)
and when = 1
BFR= Btotal , identical to FR1 (10)
It shows that requirement of total usable bandwidth is reduced. Centre user and edge user do not share bandwidth with each other which leads to reduction in interference. Bandwidth allotment can be done as shown in Table I .
Table I. Different bandwidth allotment BCUA MHz BEUA MHz
1 500 0
0.9 450 50/3
0.8 400 100/3
0.7 350 150/3
0.6 300 200/3
0.5 250 250/3
0.4 200 300/3
0.3 150 350/3
0.2 100 400/3
0.1 50 450/3
0 0 500/3
Different bandwidth configuration is considered to choose best so that maximum throughput can be achieved. After simulating all the value in MATLAB, best results are achieved by using For calculating cell throughput mathematical expression in [9] is given as:
[image:2.595.310.533.460.622.2]International Journal of Innovative Technology and Exploring Engineering (IJITEE) ISSN: 2278-3075, Volume-8 Issue-9, July 2019
RFR3 =
(12) Equation (11) determines throughput for centre user area
using FR1 scheme whereas equation (12) determines
throughput for edge user area using FR3 scheme.
Average cell throughput can be calculated as:
(13) B. SFR Area Spectral Efficiency
In heterogeneous network, area spectral efficiency is defined as summation of highest attainable data rates per unit bandwidth per cell area for all the users [11]. The S.I unit for area spectral efficiency is bits/sec/Hz/cell.
Let's consider two capacities such as Cin for inner region and
Cout for outer region in bits/sec/Hz. Area spectral efficiency
of channel is given in [8]as:
(14)
Here is frequency reuse for inner region and is frequency reuse for outer region.
Now consider as number of channel allotted to inner region and as number of channel allotted to outer region. Area spectral efficiency is calculated by using equation (15) given as:
(15)
Mobile has a probability to be present anywhere in the cell. That's why channel assigned among users will be according to average number of users in each cell so that fair distribution of channel can be done. For that equation (16) is given as:
(16)
here = denotes normalized value of threshold where R denotes radius of cell and denotes radius of cell centre region.
By using equation (15) and (16) following expression is obtained which is used to calculate area spectral efficiency.
(17)
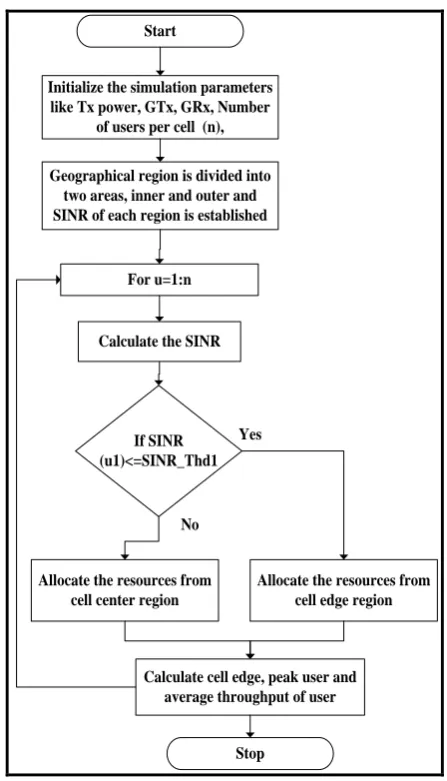
Flow chart of the proposed scheme
Initialize the simulation parameters like Tx power, GTx, GRx, Number
of users per cell (n), Start
Allocate the resources from cell center region
Calculate cell edge, peak user and average throughput of user If SINR
(u1)<=SINR_Thd1
No Yes Geographical region is divided into
two areas, inner and outer and SINR of each region is established
For u=1:n
Calculate the SINR
Allocate the resources from cell edge region
[image:3.595.314.538.65.456.2]Stop
Figure 2: Flow chart for 2L-3 sector scheme III. SIMULATION AND RESULTS:
Table II. Simulation Parameters
[image:4.595.57.372.77.634.2][image:4.595.48.284.280.623.2]
Figure 3: SINR v/s Distance graph
Figure 4: SINR v/s Distance graph
Figure 3 shows SINR v/s distance graph for different techniques like conventional FFR, multi-level 6 sector FFR and 2L-3 sector SFR. As seen from the figure that 2L-3 sector SFR technique has better results than the other two techniques. As number of levels and sectors are reduced in the proposed scheme, interference is reduced and high SINR value is achieved. Here CUA uses FR1 frequency technique
whereas EUA uses FR3 which leads to minimum
interference in the cell edge region. Threshold value for CUA is taken as 1 whereas for EUA is taken as 2.
[image:4.595.312.557.312.707.2]According to threshold value resources can be allocated to the users. Figure 4 shows SINR v/s distance graph for conventional FFR, multi-level 3 sector FFR and multi-level 6 sector FFR. As seen from the graph 2L-3 sector SFR has better results than other two techniques.
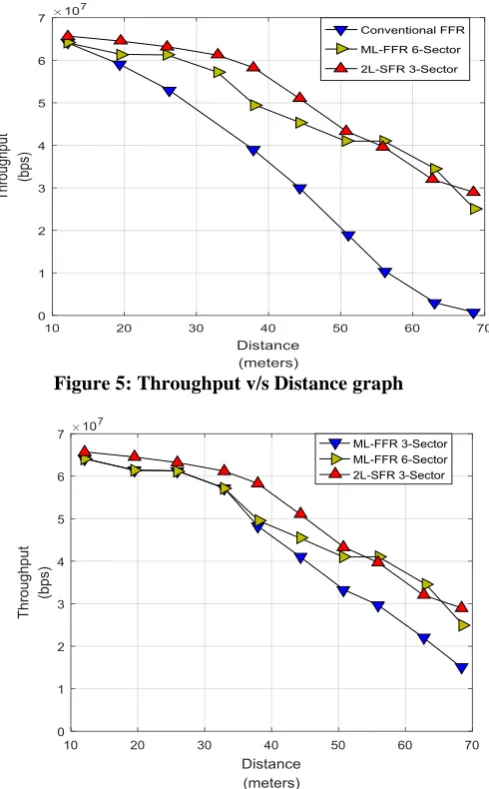
Figure 5: Throughput v/s Distance graph
Figure 6: Throughput v/s Distance graph
Parameters Value
Multiple access technique OFDMA
Network Size 21 cell pattern with 10 UE per
cell
BS Transmission Power 43dBm
Gain of Transmission Antenna 18dB
Receiver Antenna Gain 0dB
Carrier Frequency 26GHz
Bandwidth 500MHz
Modulation Adaptive (QPSK, 16 QAM, 64
QAM)
International Journal of Innovative Technology and Exploring Engineering (IJITEE) ISSN: 2278-3075, Volume-8 Issue-9, July 2019
Figure 5 shows throughput v/s distance graph for different techniques like conventional FFR, multi-level 6 sector FFR and 2L-3 sector SFR and seen from the graph that 2L-3 sector SFR technique has better throughput than the other two techniques. As number of levels and sectors are reduced in the proposed scheme, value is optimized which in turn enhances the throughput in cell edge area. Best results
[image:5.595.52.544.149.388.2]are analyzed when value of is taken as 0.7. At =0.7, total bandwidth which is divided into CUA and EUA will be 350 MHz and 150/3 MHz respectively. It also gives maximum attainable data rates. Throughput v/s distance graph for conventional FFR, multi-level 3 sector FFR and multi-level 6 sector FFR is shown in Figure 6. 2L-3 sector SFR has better results
than other two techniques.
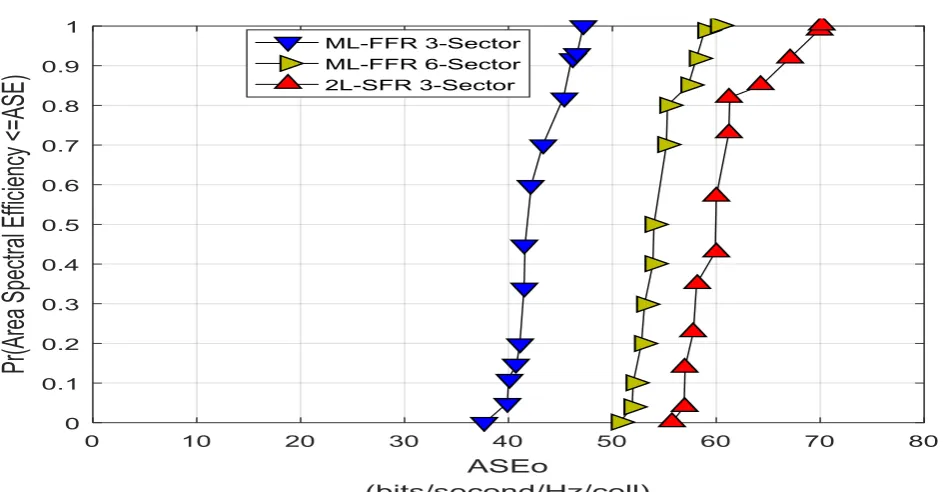
[image:5.595.52.546.178.667.2]Figure 7: Area Spectral Efficiency v/s Average Area Spectral Efficiency
[image:5.595.64.536.420.666.2]Figure 7 shows area spectral efficiency v/s average spectral efficiency graph for different techniques like conventional FFR, multi-level 6 sector FFR and 2L-3 sector SFR. As seen from the figure 2L- 3 sector SFR technique has better area spectral efficiency than the other two techniques. 2L- 3 sector scheme used to enhance the system capacity by increasing area spectral efficiency. Area spectral efficiency helps to enhance the spectrum availability. Area spectral
efficiency is one of the performance measure in heterogeneous networks where development is not planned. Figure 8 shows spectral efficiency v/s average spectral efficiency graph for conventional FFR, multi-level 3 sector FFR and multi-level 6 sector FFR and seen from the figure 2L-3 sector SFR has better results than other two techniques.
[image:6.595.76.516.229.362.2]Results of proposed scheme 2L- 3 sector is compared with existing techniques and comparison is given in Table
III.
Table III: Empirical improvement of proposed scheme against the others
Parameters Ref [9]
ML-3 Sector[10]
ML-6
Sector[10] 2L-3 Sector
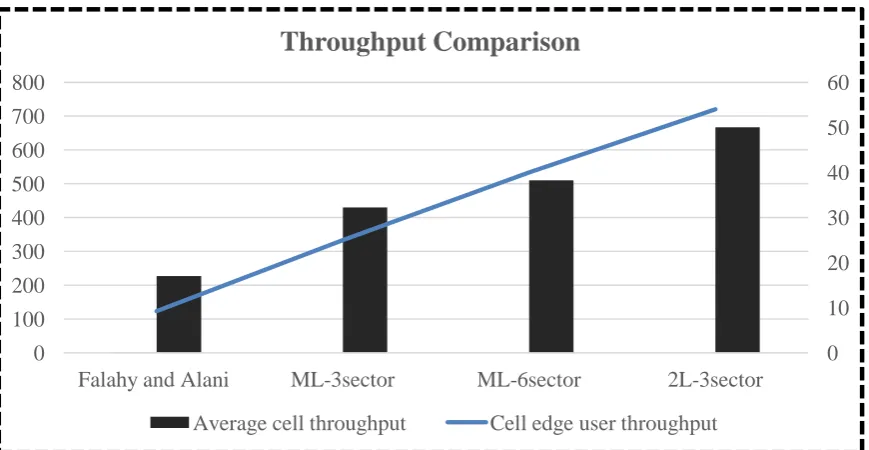
Cell edge Throughput (Mbps) 9.26 25 40 54
Average cell Throughput (Mbps) 226.69 430 510 667
Peak data Throughput (Mbps) 66.28 68 68 76.7
Area Spectral Efficiency
(bits/sec/Hz/cell) - - - 70.3
[image:6.595.83.518.416.641.2]Throughput comparison for all the existing technique is shown in Figure 9 below.
Figure 9: Throughput comparison of existing techniques
0
10
20
30
40
50
60
0
100
200
300
400
500
600
700
800
Falahy and Alani
ML-3sector
ML-6sector
2L-3sector
Throughput Comparison
International Journal of Innovative Technology and Exploring Engineering (IJITEE) ISSN: 2278-3075, Volume-8 Issue-9, July 2019
IV. CONCLUSION
With the increase in traffic, high data rate's demand is increasing day by day. In order to fulfil this demand more spectrum should be there which is not possible. So there are number of techniques developed to reuse the spectrum. But there are certain limitations in reusing spectrum i.e. interference. Interference effect the quality of service as well as SINR. To get high data rate, capacity and efficiency there is need to maintain quality of service The frequency reuse scheme helps to enhance the network capacity and overall performance of the system. FFR scheme helps to minimize the inter-cell interference. The cell edge throughput of the proposed model 2L-3 sector SFR scheme in heterogeneous network is extracted. As per the simulation results illustrated there is remarkable enhancement in performance parameters such as cell edge throughput by 25.92%, average cell throughput by 23.53% and peak data rate by 11.34% when compared with multi level 6 sector technique.. Area spectral efficiency plays an important role to fulfil the demands for high data rates. Future work can be extended to MIMO communications for improving high data rates.
V. ACKNOWLEDGEMENT
The authors would like to thank the Director, National Institute of Technical Teachers’ Training & Research, Chandigarh, India for continuous support throughout this research work.
REFERENCES
1. L. Chen, D. Yuan, "Generalizing and Optimizing Fractional Frequency Reuse in Broadband Cellular Radio Access Networks", EURASIP Journal on Wireless Communications and Networking, vol. 15, no.20, pp.115-130, 2012.
2. S. Kumar, S. Kalyani, K. Giridhar, "Optimal Design Parameters for Coverage Probability in Fractional Frequency Reuse and Soft Frequency Reuse", IET Communications Journal, vol. 09, no. 10, pp. 1324-1331, 2015.
3. J. C. Ikuno, M. Taranetz, M. Rupp, "A fairness-based performance evaluation of fractional frequency reuse in LTE", in Proc. 17th Int. ITG Workshop Smart Antennas (WSA), Stuttgart, Germany, pp. 1-6, 2013. 4. Z. Xu, G. Y. Li, C. Yang, X. Zhu, “Throughput and Optimal Threshold for FFR Schemes in OFDMA Cellular Networks”, IEEE Transactions on Wireless Communications, vol. 11, no. 8, pp. 2776-2785, 2012. 5. G. Giambene , V. A. Le, T. Bourgeau. H. Chaouchi, ”Iterative
Multi-Level Soft Frequency Reuse With Load Balancing for Heterogeneous LTE-A Systems”, IEEE Transactions on Wireless Communications, vol. 16, no 02, 2017.
6. T. D. Novlan, R.K. Ganti, A. Ghosh and J. G. Andrews, “Analytical Evaluation of Fractional Frequency Reuse for OFDMA Cellular Networks”, IEEE Transactions on Wireless Communications, vol. 10, no. 12, pp. 4294-4305, 2011.
7. Q. Li, R. Hu, Y. Xu, and Y. Qian, “Optimal Fractional Frequency Reuse and Power Control in the Heterogeneous Wireless Networks”, IEEE Transactions on Wireless Communications, vol. 12, no. 6, pp. 2658–2668, 2013.
8. J. G. Morales, G. Femenias, F. R. Palou, J. S. Thompson, “Multi-Layer FFR-Aided OFDMA-Based Networks Using Channel-Aware Schedulers”, IEEE Access, vol. 6, pp. 7134-7147, 2018.
9. N. A. Falahy, O. Y. K. Alani, “Network Capacity Optimisation in Millimetre-Wave Band Using Fractional Frequency Reuse”, IEEE Access Journal, vol. 06, pp. 10924-10932, 2017.
10. G. Kumar, G. Saini, "Multi-Level Fractional Frequency Reuse Schemes for 5G Networks", Journal of Advance Research in Dynamical & Control Systems, vol. 10, no. 06, pp. 2027-2033, 2018.
11. A. Mahmud, K.A. Hamdi, " A unifies Framework for the Analysis of Fractional Frequency reuse Techniques", IEEE Transactions on Communications, vol. 62, no. 10, pp. 3692-3705.
AUTHORS PROFILE