Visualizing the Protein Sequence Universe
Larissa Stanberry
∗ Bioinformatics & High-throughput Analysis Laboratory, Seattle Children’sResearch Institute (SCRI); DELSA
larissa.stanberry@
seattlechildrens.org
Roger Higdon
Bioinformatics & High-throughput Analysis Laboratory, SCRI; DELSAroger.higdon@
seattlechildrens.org
Winston Haynes
Bioinformatics & High-throughput Analysis Laboratory,SCRI; DELSAwinston.haynes@
seattlechildrens.org
Natali Kolker
High-Throughput AnalysisCore, SCRI; DELSA
natali.kolker@
seattlechildrens.org
William Broomall
High-Throughput AnalysisCore, SCRI; DELSA
[email protected]
Saliya Ekanayake
School of Informatics and Computing and Pervasive Technology Institute, IndianaUniversity
[email protected]
ABSTRACT
Modern biology is experiencing a rapid increase in data vol-umes that challenges our analytical skills and existing cy-berinfrastructure. Exponential expansion of the Protein Se-quence Universe (PSU), the protein seSe-quence space, together with the costs and complexities of manual curation creates a major bottleneck in life sciences research. Existing re-sources lack scalable visualization tools that are instrumen-tal for functional annotation. Here, we describe a multi-dimensional scaling (MDS) implementation to create a 3D embedding of the PSU that allows visualizing the relation-ships between large numbers of proteins. To demonstrate the method, we use sequence similarity scores as a measure of proximity. An example of the prokaryotic PSU shows that the low-dimensional representation preserves important grouping features such as relative proximity of functionally similar clusters and clear structural separation between clus-ters with specific and general functions. The advantages of the method and its implementation include the ability to scale to large numbers of sequences, integrate different similarity measures with other functional and experimental data, and facilitate protein annotation. Transdisciplinary approaches akin to the one described in this paper are ur-gently needed to quickly and efficiently translate the influx of new data into tangible innovations and groundbreaking discoveries.
∗Corresponding author, 1900 9th Ave, C9S-9, Seattle, WA 98101,[email protected]
Permission to make digital or hard copies of all or part of this work for personal or classroom use is granted without fee provided that copies are not made or distributed for profit or commercial advantage and that copies bear this notice and the full citation on the first page. To copy otherwise, to republish, to post on servers or to redistribute to lists, requires prior specific permission and/or a fee.
Copyright 20XX ACM X-XXXXX-XX-X/XX/XX ...$10.00.
Categories and Subject Descriptors
J.3 [Computer Applications]: Life and Medical Sciences—
Biology and genetics; H.3.3 [Information Systems]: In-formation Storage and Retrieval—Information search and retrieval
Keywords
MapReduce, data-enabled life sciences, sequence similarity, computational bioinformatics, protein annotation, protein sequence universe, PSU, COG, UniProt, UniRef, DELSA, multidimensional scaling, data visualization, BLAST, Azure, Sammon, Twister, Hadoop, Needleman-Wunsch, Hive, MPI, EM.
1.
INTRODUCTION
Functional annotation of newly sequenced genomes and meta-genomes is one of the principal challenges of modern biology. Rapidly advancing sequencing technologies gener-ate peta- and even exabyte scale data, exponentially expand-ing the PSU (see Table1) [57,60,14]. Assigning functions to this glut of newly sequenced proteins is an immense com-putational challenge that requires advanced analytical tools and scaling capabilities [64,67,56,52,51,44,41,59,39,29, 43].
Protein functional annotation relies on expert knowledge along with sophisticated statistical and machine-learning meth-ods including pairwise and multiple sequence alignment al-gorithms [1,2,18,72], structure prediction models [61,16], motif and domain finding algorithms [65,4,19,53],and clus-tering methods [70,31,34,73,46]. Existing information on proteins and their functions is scattered across numerous databases including general resources [5, 7], pathways [32, 71, 11, 54], protein structure [8], protein domains [19,53], protein families [35,31,47,73,46,70] and protein expres-sions [38].
Table 1: Definitions of keywords and abbreviations used in this paper. Abbreviation/Keyword Definition
ActiveMQ Apache publish-subscribe environment;http://activemq.apache.org/.
Apache Hadoop A software framework that supports data-intensive distributed applications and provides a distributed file system that stores data on the compute nodes, allowing for high aggregate bandwidth across the cluster;http://hadoop.apache.org/.
Apache Hive
An open source software designed to run data warehouse-styled operations against large datasets stored in Hadoop Distributed File System. Hive allows projecting an RDBMS-like structure onto the stored data and run queries against those structures using HiveQL language;http://hive.apache.org/.
Azure, MIcrosoft Windows
Provides on-demand compute and storage to host, scale, and manage applications on the internet through Microsoft datacenters. The NCBI BLAST on Windows Azure is a cloud-based
implementation of the NCBI BLAST tool;
http://research.microsoft.com/en-us/projects/azure/azureblast.aspx.
BLAST
A heuristic algorithm which is optimized to identify local alignments with high sequence
similarity. After optimal alignments are determined, BLAST calculates a bit score and an e-value for each alignment where the latter considers both the bit score and additional information about search database size and the scoring systemhttp://blast.ncbi.nlm.nih.gov/Blast.cgi[1,2].
COG
Clusters of Orthologous Groups of proteins database developed by NCBI. The database is separated into COGs for prokaryotic genomes and KOGs for eukaryotic genomes; http://www.ncbi.nlm.nih.gov/COG/[69,70].
DELSA Global
Data-Enabled Life Sciences Alliance International whose mission is to accelerate the impact of data-enabled life sciences research on solutions to the pressing needs of our global society; http://delsaglobal.org/.
EM Expectation Maximization is an iterative algorithm used to find maximum likelihood estimators of the underlying distribution for incomplete data or data with missing values. KOG Clusters of orthologous groups for eukaryotic genomes;http://www.ncbi.nlm.nih.gov/COG/[70].
MapReduce A computational paradigm, where the application is divided into many small fragments of work, each of which may be executed on any node in the compute cluster.
MDS
Multidimensional scaling finds a low-dimensional Euclidean representation of data given the matrix of pairwise similarities. The classical MDS estimates the projections so that the relation between the resulting interpoint distances and the original similarities is linear.
MPI The Message Passing Interface designed for high performance on massively parallel machines and on workstation clusters;http://www.mcs.anl.gov/research/projects/mpi/.
NW Needleman-Wunsh dynamic programming algorithm is used to find the highest-scoring global alignment of two sequences.
PlotViz A visualization software developed by SALSA group at Indiana University; http://salsahpc.indiana.edu/plotviz/[62].
PSU
Protein Sequence Universe is the totality, or the aggregate, of all the protein sequences that exists in nature. PSU is also an interactive visualization framework with scalable software architecture. When developed the framework will allow users to explore, browse, analyze, and visualize protein data;http://manxcatcogblog.blogspot.com/.
Sammon’s loss A cost function for nonlinear MDS with an emphasis on preserving small distances [63].
Sequence similarity A score that gives the degree of matching between the two compared sequences. The examples include BLAST, NW and Smith-Waterman scores.
Twister
An open source implementation of Iterative MapReduce that supports more efficient and broader range of communication collectives (including reduce, gather, and broadcast in an MPI language) in the Reduce phase of MapReduce;http://www.iterativemapreduce.org/.
UniProt The Universal Protein Resource for protein sequence and annotation data; http://www.uniprot.org/.
UniRef
The UniProt Reference Clusters database that groups members based on sequence similarity. UniRef is composed of the distinct databases UniRef100, UniRef90, and UniRef50, that have 100%, 90%, and 50% sequence similarity, respectively, within protein clusters and reduce the UniProt database size by approximately 10%, 40%, and 70%, respectively. Each cluster
[image:2.612.53.582.98.694.2]vast amount of information across large sets of proteins. The data are typically analyzed on the experiment level and in the context of known relationships, e.g. pathways, com-plexes. Tools for pathway and network visualization (e.g. Ingenuity or Biobase) consider neither sequence information nor extend to the entire PSU.
Functional annotation and analysis is typically done on a gene-by-gene (protein-by-protein) basis. While the ‘man-ual’ approach is feasible for a small group of proteins, it quickly becomes unsustainable as the volume of sequences expands [22, 6]. Furthermore, in functional and compara-tive genomics approximately 30% of proteins in any newly sequenced genome have unknown function [10, 41, 39, 40, 23, 44]. This barrier remains relatively constant as more new organisms are sequenced. Combining this problem with the influx of data from novel sequencing technologies creates an ever expanding backlog of un-annotated proteins, or so called “hypothetical” proteins [10, 45, 41, 39, 23]. In ad-dition, there is a growing number of databases that are no longer supported or updated including some of the most popular protein family resources like the Clusters of Orthol-ogous Groups database (COG; see Table1, [70]), SYSTERS [46], and CluStr[47].
The size and complexity of data from high-throughput technologies requires the methods to cohesively integrate in-formation on protein expression, pathways, structure and functional annotation across different experiments, organ-isms and conditions, and to put these data into context with sequence information [38]. Comprehensive functional anno-tation of large scale data and the ability to generate new re-search directions fully depend on the wide range of skills and tools including expert knowledge, manual curation, compute power, analytic methods with scaling capabilities, and new transdisciplinary collaboration models between computer-and life scientists.
To demonstrate the complexities of protein annotation, we completed the first of a kind all-versus-all sequence align-ment for 9.9 million proteins in the UniRef100 database (Table 1, [68]) [44]. The alignment was done on the Mi-crosoft Windows Azure cloud system (Table 1, [17]) with 475 eight-core virtual machines that produced over 3 bil-lion filtered records in six days. Using the normalized align-ment score, we have assigned 68% of 5.1 million bacterial proteins into clusters from the COG database [44]. The re-maining proteins were classified into functional groups using an innovative implementation of a single-linkage algorithm on a Hadoop compute cluster using Hive and the MapRe-duce paradigm (Table1). This implementation significantly reduced the run time for non-indexed queries and optimized clustering performance [44]. Consequently, nearly 2 million proteins were agglomerated into half a million functional groups. Similarly, the eukaryotic database was expanded by over 1 million proteins with unclustered proteins classified into 100,000 new functional groups [44].
The UniRef100 clustering project showcased both the promise and the challenges of protein annotation. In particular, it has demonstrated that, in view of the exponential growth of data, a clustering approach is computationally advanta-geous because it can facilitate the annotation of large num-bers of proteins [70,31,34,73,46,44]. However, the project took the considerable efforts of a diverse group of researchers along with multiple cloud systems to successfully complete the task. Publicly available cluster resources are struggling
to cope with the influx of data and, as a result, are either no longer supported [70,47,46] or provide limited interactive and analytic capabilities [31,35]. These problems highlight the pressing need in the biological community for a scalable and efficient computational approach to visualize, explore and assign functional annotations to new proteins.
Functional annotation of protein sequences, especially on the scale of the entire PSU, is one of the unsurmounted hur-dles toward comprehensive understanding of life and medical cure. An accurate, sustainable, large-scale method for func-tional annotation demands focused and concentrated efforts of experts from multiple scientific fields. Given the scale of data and the range of skills required to translate it to knowl-edge to action, scientists forge alliances to leverage resources and expertise across different disciplines [55]. This drive for collective innovation in data-enabled sciences translates into community efforts such as DELSA Global, the Data-Enabled Life Sciences Alliance International (see Table 1) [55, 37, 44,43,42]. The goal of the newly founded transdisciplinary alliance is to create a synergy between the computer sci-ence and life-scisci-ences to tackle modern biological challenges through best computational practices and advanced cyber-infrastructure.
In this paper, we propose a visualization tool to explore the structure of the protein space and relationships between the proteins. The visualization is based on the MDS ap-proach (Table1) that uses a parallel implementation on a multigrid platform with Iterative MapReduce, the standard Message Passing Interface (MPI; see Table1), and thread-ing. The MDS approach is a form of low-dimensional embed-ding, similar to principal component analysis, independent component analysis, principal coordinate analysis, spring embedding, feature selection and others [24,30,27]. While low-dimensional representation of data has been widely used by scientists, existing methods neither address large-scale biological problems nor do they offer sustainable, affordable means to cope with the influx of new information. The pro-posed PSU tool provides interactive, exploratory means to examine complex biological data both independently and in the context of the existing information. The low-dimensional representation allows visualizing the vastness of the PSU, its structure and complexity on a variety of scales and in dif-ferent domains.
To demonstrate the performance of the method, we apply it to the COG data creating a 3D projection of the prokary-otic PSU. Prokaryotes are one of the four major biologi-cal kingdoms. Despite lack of support, the COG database remains one of the most popular scientific resources (over 6K citations according to Google Scholar). The resulting PSU can be further integrated with functional, experimen-tal, structural, environmental and other data. Most im-portantly, the implementation allows for new experimental data to be mapped into the existing universe using inter-polation. Interpolation allows for efficient expansion of the PSU, a feature that is essential for large-scale data. For ex-ample, the prokaryotic PSU can be efficiently updated and expanded as the new data come in. The exa-scale of data in the PSU requires cutting-edge technologies, advanced cy-berinfrastructure, transdisciplinary collaboration and a wide range of skills and expertise. This work represents an exam-ple of the potential impact DELSA Global could have to solve large-scale biological problems.
100,000 sequences to create the 3D rendering of the prokary-otic PSU. We briefly describe the data, outline the imple-mentation and discuss the results. We then elaborate on the application and merits of the proposed approach to the functional annotation of new protein data.
2.
MATERIALS AND METHODS
2.1
COG Database
A major principle of molecular evolution is that function-ally important proteins tend to be conserved across species. The COG database was developed by the National Cen-ter for Biotechnology Information (NCBI) [70]. The project constructed clusters of proteins from 66 prokaryotic and seven eukaryotic genomes. For each protein, the best aligned protein in every other genome was determined using a se-quence similarity search [1]. If three proteins from three or-ganisms were mutual best hits, they created a triple. COGs are the result of exhaustive, successive merging of triples with two common members. Manual curation of the clus-ters was done by experts to ensure correct grouping and functional annotations. The COG database is separated into COGs for prokaryotic genomes and KOGs for eukaryotic genomes (see Table1) [69,70]. According to Google scholar, COG project is one of the most popular protein resources with approximately 4.5K citations. However, the database was last updated in 2008 and is not currently maintained.
In this paper, we are using the COG database of prokary-otic genomes that we will refer to as COGs. We have selected a sample of 100,000 proteins from well-characterized COG clusters.
2.2
UniRef Databases
UniRef is composed of three databases UniRef100, UniRef90, and UniRef50, which have 100%, 90%, and 50% sequence similarity (see Table1), respectively, within protein clusters and reduce the UniProt database size by approximately 10%, 40%, and 70%, respectively. Each cluster contains one refer-ence sequrefer-ence and all proteins within the similarity thresh-old to the reference. UniRef retains annotation from all members of the protein cluster to prevent information loss [5,68].
2.3
Multi-Dimensional Scaling
The MDS algorithm was used to project the protein se-quence similarity data into a low-dimensional space [13,48]. The method has anO(n2) computational complexity to map
nsequences into 3D. It can be heuristically solved in several ways including the expectation maximization (EM) [9, 49, 12] and Newton’s method (see Table 1) [33]. Here, we used Sammon’s loss function [63] (see Table1) given by
H=
n
X
i,j=1
i<j
(f(δij)−d(xi, xj))2
f(δij)
, (1)
where δij is the dissimilarity measure between sequences i and j and d is the Euclidean distance between the corre-sponding 3D projectionsxiandxj. Functionfin equation (1) is a monotone transformation of dissimilarity measure. The denominator term in (1) ensures a larger contribution from smaller dissimilarities thus making the clustering struc-ture of the data more apparent. We used a highly robust
implementation of the nonlinear minimization with Leven-berg - Marquardt algorithm to regularize Newton’s equa-tions [50].
The transformation f is chosen heuristically to increase the ratio of standard deviation to mean for f(δij) and to increase the range of dissimilarity measures. For example, if
fis an identity, the high dimensional data will essentially be projected onto the surface of a 3D structure, which lowers the utility of the mapping.
2.4
Implementation
We used a scaling, parallel traditional MPI with thread-ing intranode for MDS implementation [20]. In the Reduce phase of MapReduce, we used Twister (see Table1) [72,74, 15]. In Twister, all communication avoids using intermedi-ate disk and is built around ActiveMQ (see Table1) in Java Twister and around Azure primitives in the Microsoft cloud. The method was applied to obtain a 3D projection of 100,000 sequences from well-characterized COGs in prokary-otic PSU. Here, we chose sequence alignment scores as a proximity measure. Pairwise distances were calculated using an MPI implementation of the Needleman-Wunsch (NW, see Table1) alignment algorithm. The NW algorithm was real-ized by a parallel computation on the 24-core node system. The efficiency of the parallel distance computation was less than that of MDS due to saturation of memory bandwidth. Further, we applied a monotone square-root transforma-tion to the pairwise NW distances. To map the data into a 3D Euclidean space, we fed the transformed distances into an MPI implementation of the nonlinear MDS [36]. The resulting 3D projections were visualized in PlotViz (see Ta-ble1) [62]. The calculations were performed on a 768 core Microsoft HPC cluster.
The NW distance calculation required one day to com-plete and the MDS job ran for three days. The parallel efficiency of the code was approximately 70% based on ear-lier studies that discuss both the inter-node and intra-node cases and find that it is essential to adopt a hybrid model with intra-node threading and MPI between nodes [20,58, 21]. The transformation was chosen heuristically to reduce the formal dimension of distance data (in this case, from 244 with originalδijto 14 forf(δij) after mapping), which allows for a more uniform coverage of the target Euclidean space by the MDS projections.
The COG data was downloaded from the NCBI site. All software used to analyze and visualize the data is an open source. The results of the MDS analysis including esti-mated coordinates, parameters and captures are availalbe at http://manxcatcogblog.blogspot.com/.
3.
RESULTS
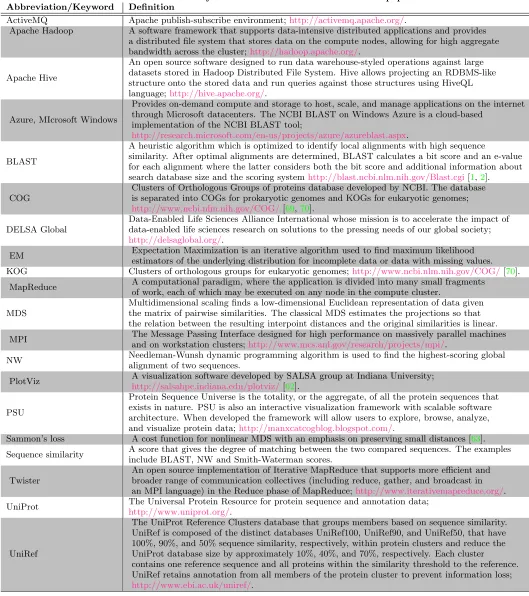
Figure 1: MDS representation of the 100,000 sequences from well-characterized COGs in prokaryotic PSU. Each point represents a protein sequence. Eleven COG clusters were color-coded as marked in the legend. The number of proteins in each cluster is given in parentheses.
[image:5.612.88.515.451.642.2]Table 2: Annotations for COG clusters shown in Figures1 and4.
COG Annotation Size UniRef
COG1131 ABC-type multidrug TS, ATPase comp. 244 14,406
COG1136 ABC-type antimicrobial peptide TS, ATPase comp. 198 7,306
COG1126 ABC-type polar amino acid TS, ATPase comp. 118 4,061
COG3839 ABC-type sugar TSs, ATPase comp. 142 4,121
COG0444 ABC-type di-/oligopeptide/nickel TS, ATPase comp. 142 3,520
COG4608 ABC-type oligopeptide TS, ATPase comp. 132 3,074
COG3842 ABC-type spermidine/putrescine TSs, ATPase comp. 115 3,665
COG0333 Ribosomal protein L32 49 1,148
COG0454 Histone acetyltransferase HPA2 & related acetyltransf. 285 14,085
COG0477 Permeases of the major facilitator superfamily 381 48,590 COG1028 Dehydrogenases with different specificities 299 37,461
0.00
0.05
0.10
0.15
MDS distance
COG1131
COG1136 COG1126 COG3839 COG3842 COG0444 COG4608
COG0454
COG0477
COG0333 COG1028
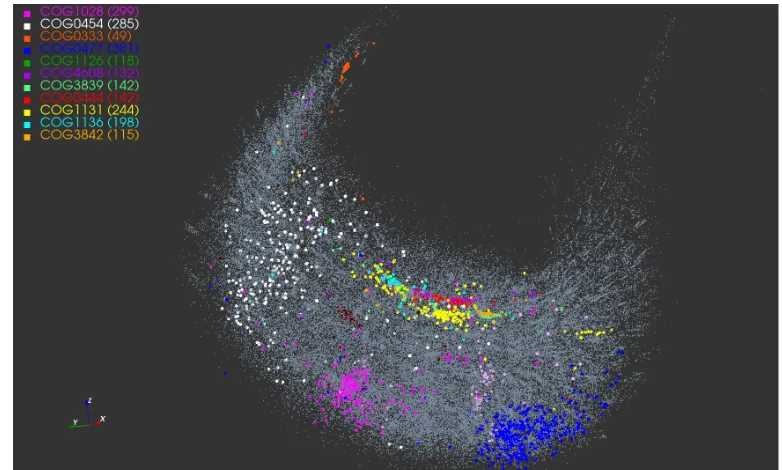
Figure 3: The dendrogram tree of the cluster cen-troids. The cluster labels are color-coded as in Fig-ure1.
Table2.
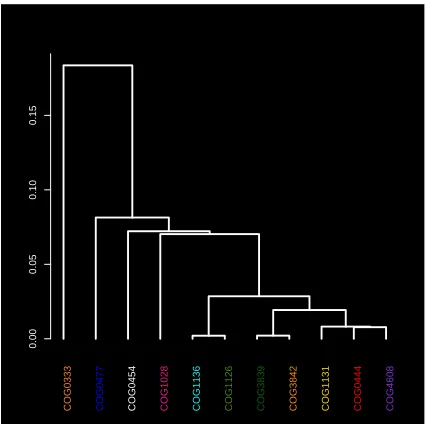
Recall that in MDS, the goal is to create a low-dimensional representation of a high-dimensional space while preserving the similarity measures. Hence, given the choice of the sim-ilarity measure, the proximity of two points in the 3D rep-resentation in Figures1and4implies the similarity of the corresponding protein sequences as measured by the NW scores. High intensity values along the diagonal in Figure2
(left) show a strong correlation between the NW distances and the distances based on MDS projections. The excess of points with mapped distances less than original values can be traced to equation (1) where the denominator depends on the original rather than mapped distances. Consequently, clusters that appear tight in 3D can be thought of as consist-ing of similar sequences, in NW sense. Similarly, scattered clusters imply greater variability of NW alignments between the proteins in the same cluster. Spatial proximity of clus-ters indicates the similarity of the sequences across these clusters. Note that the histogram of NW distances in Fig-ure 2 also shows a lack of spatial separation between the clusters.
For the eleven color-coded COG clusters in Figure1, we computed the centroids of their respective MDS projections. The dendrogram tree in Figure3shows the relative proxim-ity of the cluster centroids to each other. Out of the eleven selected clusters, COG1131 (yellow) and COG1136 (cyan) are the tightest with respect to the mean intra-cluster dis-tance. These two clusters are a part of a group that includes seven COGs in all; see right branch of the dendrogram. The other four COGs 1028, 0333, 0477, 0454 appear to be less similar to this group of seven or to each other.
The magnified view in Figure4details the neighborhood structure of the COG1131 and COG1136 showing five more COGs lying in close proximity. Remarkably, all seven clus-ters are functionally similar and correspond to the ABC-type transport system, ATPase component (see Table 2). The heatmap shows a good agreement between the NW dis-tances and MDS projections for the seven selected clusters; see Figure5.
From the biological standpoint, the spatial features of the MDS projection of sequence alignment scores conform well to the clusters’ functions. For example, a tight COG3839 cluster contains 142 protein sequences of the sugar transport systems that are similar both in function and composition. Similarly, COG1126 of the polar amino acid transport sys-tem proteins with very specific functions appears as a very tight cluster. In turn, the apparent diffusivity of COG1131 can be explained by the fact that 244 multidrug transport system proteins that compose the cluster differ in amino acid composition and functional mechanisms. The inter-cluster distance of the 3D projections reflects the similarity between protein sequences in the corresponding clusters. For exam-ple, the two oligopeptide transport systems, COG4608 and COG0444, have similar shape and are located in close prox-imity to one another. The example of the COG data clearly demonstrates that MDS can effectively create a 3D projec-tion of the PSU while preserving the fundamental grouping structure.
As mentioned, in our previous work we used all-versus-all alignment of 10 million UniRef100 proteins to populate the existing COG clusters [44]. The last column in Table2
shows the number of UniRef100 proteins added to each of the eleven clusters from Figure1. Notably the most diffuse clusters show the greatest expansion.
4.
DISCUSSION
[image:6.612.67.280.223.435.2]impor-Figure 4: Magnified version of the prokaryotic PSU showing the seven functionally similar COG clusters from Figure1.
[image:7.612.93.521.55.365.2] [image:7.612.63.546.433.659.2]tant and resource-intensive challenges in biology [6]. The rapid influx of data from newly sequenced genomes together with the limited number of annotation experts creates a major bottleneck, stalling scientific advances. The number of sequenced genomes is poised to increase in the next five years. The Earth Microbiome Project alone is expected to sequence 500,000 microbial genomes, which will contain on the order of 1.5 billion protein sequences and half a trillion amino acids [14]. This is well over a 100-fold increase in the number of sequenced microbial genomes and proteins currently contained in GenBank. The i5K Insect and other Arthropod Genome Sequencing Initiative plans to sequence the genomes of 5,000 insects and related species over the next five years, yielding nearly 100 million new protein se-quences [60]. Assigning functions to this glut of newly se-quenced proteins is an immense scientific challenge.
Large-scale annotation projects require expert knowledge, manual curation, significant compute power, a wide spec-trum of analytic tools with scaling capabilities, and new collaboration models between computer scientists and bi-ologists. Low-dimensional representation of data and inter-active visualization tools would substantially aid functional annotation efforts, allow generating new hypotheses and pro-vide new research directions.
The exploratory MDS tool allows interactive visualization of dependencies between a large number of proteins. Cur-rently existing methods address large-scale biological prob-lems or offer sustainable, affordable means to cope with the influx of new information. A low-dimensional MDS pro-jection of biological data allows dynamic, interactive explo-ration that is a mandatory precursor to statistical model-ing. The projection provides a unique perspective on the structure of data and can be integrated with information on function, pathways, structure, and environment, enabling analysis across domains of interest. The MDS approach can be readily adapted to incorporate a composite simi-larity measure based on different types of proximities and biological information [1, 66, 25]. The parallel MDS im-plementation used here was developed to handle large-scale data.Furthermore, the newly developed MDS interpolation methods allow for quick mapping of sequences into the exist-ing projection space. The interpolation runs in O(n) time after an initial MDS embedding with the O(n2) approach
[3]. Given the ever increasing volumes of data from new sequencing technologies, this feature is essential as it facili-tates prompt integration of large scale data while avoiding significant computational costs. In the future, we intend to explore the merits of our new MDS inmplementation that incorporates deterministic annealing into the EM approach. The deterministic annealing helps achieve significantly bet-ter results with little increase in execution time [36].
The challenges associated with the functional annotation of newly sequenced genomes cannot be solved by the life sci-ences community alone. A successful and sustainable solu-tion requires a new, trans-disciplinary approach that would leverage and adopt the most prominent advances of modern sciences. This turn to collective innovation in data-enabled sciences is essential for truly ground-breaking medical dis-coveries and advances in public health. Scientific alliances like DELSA Global stand to harness the essential diversity of skills and expertise, thus quickly and efficiently trans-lating the influx of new data into tangible innovations and groundbreaking discoveries [55,37,43,42].
5.
ACKNOWLEDGEMENTS
We would like to thank Elizabeth Stewart, Christopher Moss, Courtney MacNealy-Koch, Maggie Lackey, Randy Solomon and Gregory Yandl for their comments. This work was made possible by the support from NSF (under DBI: 0969929 to E.K. and 0910818 to G.F.) and NIH (grant 5 RC2 HG 005806- 02 to G.F.; NIGMS grant R01 GM-076680-04 to E.K.; NIDDK grants U01-DK-089571 and U01-DK-072473 to E.K.).
6.
ADDITIONAL AUTHORS
Additional authors: Adam Hughes (Pervasive Technology Institute, Indiana University), Yang Ruan (School of Infor-matics and Computing and Pervasive Technology Institute, Indiana University Bloomington, [email protected]); Judy Qiu (School of Informatics and Computing and Per-vasive Technology Institute, Indiana University Blooming-ton; DELSA; [email protected]); Eugene Kolker (Bioin-formatics & High-throughput Analysis Laboratory, SCRI; High-throughput Analysis Core, SCRI; Predicitive Analyt-ics, Seattle Children’s Hospital; Departments of Pediatrics and Biomedical Informatics & Medical Education, Univer-sity of Washington; DELSA;eugene.kolker@seattle childrens.org); and Geoffrey Fox (School of Informatics and Computing and Pervasive Technology Institute; DELSA;
7.
REFERENCES
[1] S. F. Altschul, W. Gish, W. Miller, E. W. Myers, and D. J. Lipman. Basic local alignment search tool.J. Mol. Biol., 215:403–410, Oct 1990.
[2] S. F. Altschul, T. L. Madden, A. A. Schaffer, J. Zhang, Z. Zhang, W. Miller, and D. J. Lipman. Gapped BLAST and PSI-BLAST: a new generation of protein database search programs.Nucleic Acids Res., 25:3389–3402, Sep 1997.
[3] S.-H. Bae, J. Y. Choi, J. Qiu, and G. Fox. Dimension reduction and visualization of large high-dimensional data via interpolation. In Hariri and Keahey [26], pages 203–214.
[4] T. L. Bailey, M. Boden, F. A. Buske, M. Frith, C. E. Grant, L. Clementi, J. Ren, W. W. Li, and W. S. Noble. MEME SUITE: tools for motif discovery and searching.Nucleic Acids Res., 37:W202–208, Jul 2009. [5] A. Bairoch, R. Apweiler, C. H. Wu, W. C. Barker,
B. Boeckmann, S. Ferro, E. Gasteiger, H. Huang, R. Lopez, M. Magrane, M. J. Martin, D. A. Natale, C. O’Donovan, N. Redaschi, and L. S. Yeh. The Universal Protein Resource (UniProt).Nucleic Acids Res., 33:D154–159, Jan 2005.
[6] W. A. Baumgartner, K. B. Cohen, L. M. Fox, G. Acquaah-Mensah, and L. Hunter. Manual curation is not sufficient for annotation of genomic databases.
Bioinformatics, 23:i41–48, Jul 2007.
[7] D. A. Benson, I. Karsch-Mizrachi, K. Clark, D. J. Lipman, J. Ostell, and E. W. Sayers. GenBank.
Nucleic Acids Res., 40:48–53, Jan 2012.
macromolecular structures.J. Mol. Biol., 112:535–542, May 1977.
[9] I. Borg and P. Groenen.Modern Multidimensional Scaling: Theory and Applications. Springer, 2005. [10] P. Bork. Powers and pitfalls in sequence analysis: the
70% hurdle.Genome Res., 10:398–400, Apr 2000. [11] R. Caspi, T. Altman, J. M. Dale, K. Dreher, C. A.
Fulcher, F. Gilham, P. Kaipa, A. S. Karthikeyan, A. Kothari, M. Krummenacker, M. Latendresse, L. A. Mueller, S. Paley, L. Popescu, A. Pujar, A. G. Shearer, P. Zhang, and P. D. Karp. The MetaCyc database of metabolic pathways and enzymes and the BioCyc collection of pathway/genome databases.
Nucleic Acids Res., 38:D473–479, Jan 2010. [12] J. Y. Choi, S.-H. Bae, X. Qiu, and G. Fox. High
performance dimension reduction and visualization for large high-dimensional data analysis. InCCGRID, pages 331–340. IEEE, 2010.
[13] J. de Leeuw. Applications of convex analysis to multidimensional scaling. In J. Barra, F. Brodeau, G. Romier, and B. V. Cutsem, editors,Recent Developments in Statistics, pages 133–146. North Holland Publishing Company, Amsterdam, 1977. [14] Earth Microbiome Project.
http://www.earthmicrobiome.org/
[15] J. Ekanayake, H. Li, B. Zhang, T. Gunarathne, S.-H. Bae, J. Qiu, and G. Fox. Twister: a runtime for iterative mapreduce. In Hariri and Keahey [26], pages 810–818.
[16] N. Eswar, B. Webb, M. A. Marti-Renom, M. S. Madhusudhan, D. Eramian, M. Y. Shen, U. Pieper, and A. Sali. Comparative protein structure modeling using Modeller.Curr Protoc Bioinformatics, Chapter 5:Unit 5.6, Oct 2006.
[17] Microsoft eXtreme Computing Group. NCBI BLAST on Windows Azure, 2011.
http://research.microsoft.com/en-us/projects/azure/azureblast.aspx
[18] R. D. Finn, J. Clements, and S. R. Eddy. HMMER web server: interactive sequence similarity searching.
Nucleic Acids Res., 39:29–37, Jul 2011.
[19] R. D. Finn, J. Tate, J. Mistry, P. C. Coggill, S. J. Sammut, H. R. Hotz, G. Ceric, K. Forslund, S. R. Eddy, E. L. Sonnhammer, and A. Bateman. The Pfam protein families database.Nucleic Acids Res.,
36:D281–288, Jan 2008.
[20] G. Fox, S.-H. Bae, J. Ekanayake, X. Qiu, and H. Yuan. Parallel data mining from multicore to cloudy grids. In W. Gentzsch, L. Grandinetti, and G. R. Joubert, editors,High Performance Computing Workshop, volume 18 ofAdvances in Parallel Computing, pages 311–340. IOS Press, 2008.
[21] G. Fox, X. Qiu, S. Beason, J. Y. Choi, J. Ekanayake, T. Gunarathne, M. Rho, H. Tang, N. Devadasan, and G. Liu. Biomedical case studies in data intensive computing. In M. G. Jaatun, G. Zhao, and C. Rong, editors,CloudCom, volume 5931 ofLecture Notes in Computer Science, pages 2–18. Springer, 2009. [22] D. Frishman. Protein annotation at genomic scale: the
current status.Chem. Rev., 107:3448–3466, Aug 2007. [23] M. Y. Galperin and E. Kolker. New metrics for
comparative genomics.Curr. Opin. Biotechnol.,
17:440–447, Oct 2006.
[24] D. R. Gilbert, M. Schroeder, and J. van Helden. Interactive visualization and exploration of relationships between biological objects.Trends Biotechnol, 18(12):487–494, Dec. 2000.
[25] O. Gotoh. An improved algorithm for matching biological sequences.J. Mol. Biol., 162:705–708, Dec 1982.
[26] S. Hariri and K. Keahey, editors.Proceedings of the 19th ACM International Symposium on High Performance Distributed Computing, HPDC 2010, Chicago, Illinois, USA, June 21-25, 2010. ACM, 2010. [27] T. Hastie, R. Tibshirani, and J. H. Friedman.The
Elements of Statistical Learning. Springer, corrected edition, July 2003.
[28] G. Hather, W. Haynes, R. Higdon, N. Kolker, and et al. The United States of America and scientific research.PLOS ONE, 5(8):e12203, 2010.
[29] R. Higdon, B. Louie, and E. Kolker. Modeling sequence and function similarity between proteins for protein functional annotation. InHPDC ’10
Proceedings of the 19th ACM International Symposium on High Performance Distributed
Computing, ACM Digital Library, pages 499–502, New York City, NY, 2009.
[30] A. Hyv¨arinen and E. Oja. Independent component analysis: algorithms and applications.Neural Networks, 13(4-5):411–430, 2000.
[31] L. J. Jensen, P. Julien, M. Kuhn, C. von Mering, J. Muller, T. Doerks, and P. Bork. eggNOG:
automated construction and annotation of orthologous groups of genes.Nucleic Acids Res., 36:D250–254, Jan 2008.
[32] M. Kanehisa, S. Goto, S. Kawashima, Y. Okuno, and M. Hattori. The KEGG resource for deciphering the genome.Nucleic Acids Res., 32:D277–280, Jan 2004. [33] A. J. Kearsley, R. A. Tapia, and M. W. Trosset. The solution of the metric stress and sstress problems in multidimensional scaling using newton’s method, 1995. [34] P. Kersey, D. Lonsdale, N. J. Mulder, R. Petryszak,
and R. Apweiler. Building a biological space based on protein sequence similarities and biological ontologies.
Comb. Chem. High Throughput Screen., 11:653–660, Sep 2008.
[35] W. Klimke, R. Agarwala, A. Badretdin,
S. Chetvernin, S. Ciufo, B. Fedorov, B. Kiryutin, K. O’Neill, W. Resch, S. Resenchuk, S. Schafer, I. Tolstoy, and T. Tatusova. The National Center for Biotechnology Information’s Protein Clusters
Database.Nucleic Acids Res., 37:D216–223, Jan 2009. [36] H. Klock. Data visualization by multidimensional
scaling: a deterministic annealing approach.Pattern Recognition, 33(4):651–669, 2000.
[37] E. Kolker. Editorial: Special issue on data-intensive science.OMICS, 15(4):197–198, Apr 2011.
[38] E. Kolker, R. Higdon, W. Haynes, D. Welch,
W. Broomall, D. Lancet, L. Stanberry, and N. Kolker. MOPED: Model Organism Protein Expression Database.Nucleic Acids Res., 40:D1093–1099, Jan 2012.
S. Purvine, T. Holzman, T. Cherny, D. Armbruster, R. S. Munson, G. Kolesov, D. Frishman, and M. Y. Galperin. Identification and functional analysis of ’hypothetical’ genes expressed in Haemophilus influenzae.Nucleic Acids Res., 32:2353–2361, 2004. [40] E. Kolker, A. F. Picone, M. Y. Galperin,
M. F. Romine, et al. Global profiling of Shewanella oneidensis MR-1: expression of hypothetical genes and improved functional annotationsProc. Natl. Acad. Sci. U.S.A., 102(6):2099–2104, 2005.
[41] E. Kolker, S. Purvine, M. Y. Galperin, S. Stolyar, D. R. Goodlett, A. I. Nesvizhskii, A. Keller, T. Xie, J. K. Eng, E. Yi, L. Hood, A. F. Picone, T. Cherny, B. C. Tjaden, A. F. Siegel, T. J. Reilly, K. S. Makarova, B. O. Palsson, and A. L. Smith. Initial proteome analysis of model microorganism Haemophilus influenzae strain Rd KW20.J. Bacteriol., 185:4593–4602, Aug 2003.
[42] E. Kolker and E. Stewart. Data to knowledge to action.Scientist, April, 2012.
[43] E. Kolker, E. Stewart, and V. Ozdemir. Opportunities and challenges for the life sciences community.
OMICS, 16(3):138–147, Mar 2012.
[44] N. Kolker, R. Higdon, W. Broomall, L. Stanberry, D. Welch, W. Lu, W. Haynes, R. Barga, and
E. Kolker. Classifying proteins into functional groups based on all-versus-all BLAST of 10 million proteins.
OMICS, 15:513–521, 2011.
[45] E. Koonin and M. Galperin.Sequence evolution -function: computational approaches in comparative genomics. Kluwer Academic, 2003.
[46] A. Krause, J. Stoye, and M. Vingron. The SYSTERS protein sequence cluster set.Nucleic Acids Res., 28:270–272, Jan 2000.
[47] E. V. Kriventseva, W. Fleischmann, E. M. Zdobnov, and R. Apweiler. CluSTr: a database of clusters of SWISS-PROT+TrEMBL proteins.Nucleic Acids Res., 29:33–36, Jan 2001.
[48] J. Kruskal. Multidimensional scaling by optimizing goodness of fit to a nonmetric hypothesis.
Psychometrika, 29(1):1–27, 1964.
[49] J. Leeuw. Convergence of the majorization method for multidimensional scaling.Journal of Classification, 5(2):163–180, September 1988.
[50] K. Levenberg. A method for the solution of certain non-linear problems in least squares.Quarterly Journal of Applied Mathmatics, II(2):164–168, 1944. [51] B. Louie, S. Bergen, R. Higdon, and E. Kolker.
Quantifying protein function specificity in the gene ontology.Stand Genomic Sci, 2:238–244, 2010. [52] B. Louie, R. Higdon, and E. Kolker. A statistical
model of protein sequence similarity and function similarity reveals overly-specific function predictions.
PLoS ONE, 4:e7546, 2009.
[53] A. Marchler-Bauer, S. Lu, J. B. Anderson, F. Chitsaz, M. K. Derbyshire, C. DeWeese-Scott, J. H. Fong, L. Y. Geer, R. C. Geer, N. R. Gonzales, M. Gwadz, D. I. Hurwitz, J. D. Jackson, Z. Ke, C. J. Lanczycki, F. Lu, G. H. Marchler, M. Mullokandov, M. V. Omelchenko, C. L. Robertson, J. S. Song, N. Thanki, R. A. Yamashita, D. Zhang, N. Zhang, C. Zheng, and S. H. Bryant. CDD: a Conserved Domain Database for
the functional annotation of proteins.Nucleic Acids Res., 39:D225–229, Jan 2011.
[54] L. Matthews, G. Gopinath, M. Gillespie, M. Caudy, D. Croft, B. de Bono, P. Garapati, J. Hemish, H. Hermjakob, B. Jassal, A. Kanapin, S. Lewis, S. Mahajan, B. May, E. Schmidt, I. Vastrik, G. Wu, E. Birney, L. Stein, and P. D’Eustachio. Reactome knowledgebase of human biological pathways and processes.Nucleic Acids Res., 37:D619–622, Jan 2009. [55] V. Ozdemir, D. Rosenblatt, L. Warnich, and S. e. a.
Srivastava. Towards an ecology of collective innovation: Human Variome Project, Rare Disease Consortium for Autosomal Loci and Data-Enabled Life Sciences Alliance.Current Pharmacogenomics and Personalized Medicine, 9(4):1–9, 2011.
[56] E. Pennisi. Human genome 10th anniversary. Will computers crash genomics? Science, 331:666–668, Feb 2011.
[57] L. M. Proctor. The Human Microbiome Project in 2011 and beyond.Cell Host Microbe, 10:287–291, Oct 2011.
[58] J. Qiu and S.-H. Bae. Performance of Windows multicore systems on threading and MPI.
Concurrency and Computation: Practice and Experience, 24(1):14–28, 2012.
[59] A. Raghunathan, N. D. Price, M. Y. Galperin, K. S. Makarova, S. Purvine, A. F. Picone, T. Cherny, T. Xie, T. J. Reilly, R. Munson, R. E. Tyler, B. J. Akerley, A. L. Smith, B. O. Palsson, and E. Kolker. In Silico Metabolic Model and Protein Expression of Haemophilus influenzae Strain Rd KW20 in Rich Medium.OMICS, 8:25–41, 2004.
[60] G. E. Robinson, K. J. Hackett,
M. Purcell-Miramontes, S. J. Brown, J. D. Evans, M. R. Goldsmith, D. Lawson, J. Okamuro, H. M. Robertson, and D. J. Schneider. Creating a buzz about insect genomes.Science, 331:1386, Mar 2011. [61] A. Roy, A. Kucukural, and Y. Zhang. I-TASSER: a unified platform for automated protein structure and function prediction.Nat Protoc, 5:725–738, 2010. [62] Indiana University, SALSA group. PlotViz: a tool for
visualizing large and high-dimensional data.
http://salsahpc.indiana.edu/plotviz/
[63] J. W. Sammon. A nonlinear mapping for data structure analysis.IEEE Trans. Comput., 18:401–409, 1969.
[64] M. C. Schatz, B. Langmead, and S. L. Salzberg. Cloud computing and the DNA data race.Nat. Biotechnol., 28:691–693, 2010.
[65] C. J. Sigrist, L. Cerutti, E. de Castro, P. S. Langendijk-Genevaux, V. Bulliard, A. Bairoch, and N. Hulo. PROSITE, a protein domain database for functional characterization and annotation.Nucleic Acids Res., 38:D161–166, Jan 2010.
[66] T. F. Smith and M. S. Waterman. Identification of common molecular subsequences.J. Mol. Biol., 147:195–197, Mar 1981.
[67] L. D. Stein. The case for cloud computing in genome informatics.Genome Biol., 11:207, 2010.
[68] B. E. Suzek, H. Huang, P. McGarvey, R. Mazumder, and C. H. Wu. UniRef: comprehensive and
Bioinformatics, 23:1282–1288, May 2007.
[69] R. Tatusov, E. Koonin, and D. Lipman. A genomic perspective on protein families.Science, 278:631–637, 1997.
[70] R. L. Tatusov, N. D. Fedorova, J. D. Jackson, A. R. Jacobs, B. Kiryutin, E. V. Koonin, D. M. Krylov, R. Mazumder, S. L. Mekhedov, A. N. Nikolskaya, B. S. Rao, S. Smirnov, A. V. Sverdlov, S. Vasudevan, Y. I. Wolf, J. J. Yin, and D. A. Natale. The COG database: an updated version includes eukaryotes.
BMC Bioinformatics, 4:41, Sep 2003.
[71] P. D. Thomas, A. Kejariwal, M. J. Campbell, H. Mi, K. Diemer, N. Guo, I. Ladunga, B. Ulitsky-Lazareva, A. Muruganujan, S. Rabkin, J. A. Vandergriff, and O. Doremieux. PANTHER: a browsable database of gene products organized by biological function, using curated protein family and subfamily classification.
Nucleic Acids Res., 31:334–341, Jan 2003.
[72] J. D. Thompson, D. G. Higgins, and T. J. Gibson. CLUSTAL W: improving the sensitivity of progressive multiple sequence alignment through sequence weighting, position-specific gap penalties and weight matrix choice.Nucleic Acids Res., 22:4673–4680, 1994. [73] G. Yona, N. Linial, and M. Linial. ProtoMap:
automatic classification of protein sequences and hierarchy of protein families.Nucleic Acids Res., 28:49–55, Jan 2000.
[74] B. Zhang, Y. Ruan, T.-L. Wu, J. Qiu, A. Hughes, and G. Fox. Applying twister to scientific applications. In