https://doi.org/10.5194/bg-15-5653-2018 © Author(s) 2018. This work is distributed under the Creative Commons Attribution 4.0 License.
Increase of dissolved inorganic carbon and decrease in pH
in near-surface waters in the Mediterranean Sea during
the past two decades
Liliane Merlivat1, Jacqueline Boutin1, David Antoine2,3, Laurence Beaumont4, Melek Golbol3, and Vincenzo Vellucci3
1Sorbonne Université-CNRS-IRD-MNHN, LOCEAN, 75005 Paris, France
2Remote Sensing and Satellite Research Group, School of Earth and Planetary Sciences, Curtin University, Perth, Australia 3Sorbonne Université-CNRS, Laboratoire d’Océanographie de Villefranche, LOV, 06230 Villefranche-sur-Mer, France 4Division Technique INSU-CNRS, 92195 Meudon CEDEX, France
Correspondence:Liliane Merlivat ([email protected]) Received: 4 July 2017 – Discussion started: 6 July 2017
Revised: 3 September 2018 – Accepted: 4 September 2018 – Published: 21 September 2018
Abstract.Two 3-year time series of hourly measurements of the fugacity of CO2 (fCO2) in the upper 10 m of the
sur-face layer of the northwestern Mediterranean Sea have been recorded by CARIOCA sensors almost two decades apart, in 1995–1997 and 2013–2015. By combining them with the alkalinity derived from measured temperature and salinity, we calculate changes in pH and dissolved inorganic carbon (DIC). DIC increased in surface seawater by∼25 µmol kg−1 andfCO2 by 40 µatm, whereas seawater pH decreased by
∼0.04 (0.0022 yr−1). The DIC increase is about 15 % larger
than expected from the equilibrium with atmospheric CO2.
This could result from natural variability, e.g. the increase between the two periods in the frequency and intensity of winter convection events. Likewise, it could be the signa-ture of the contribution of the Atlantic Ocean as a source of anthropogenic carbon to the Mediterranean Sea through the Strait of Gibraltar. We then estimate that the part of DIC accumulated over the last 18 years represents∼30 % of the total inventory of anthropogenic carbon in the Mediterranean Sea.
1 Introduction
The concentration of atmospheric carbon dioxide (CO2) has
been increasing rapidly over the 20th century. As a result, the concentration of dissolved inorganic carbon (DIC) in the near surface ocean increases, which drives a decrease in pH in order to maintain a chemical equilibrium. These changes
have complex direct and indirect impacts on marine organ-isms and ecosystems (Gattuso and Hansson, 2011). Empiri-cal methods to estimate the anthropogenic CO2penetration
in the ocean since the industrial revolution have improved over the past few decades (Chen and Millero, 1979; Gruber et al., 1996; Sabine et al., 2008; Touratier and Goyet, 2004, 2009; Woosley et al., 2016). As the concentration of anthro-pogenic carbon, Cant, cannot be distinguished from the
nat-ural background of DIC through total DIC measurements, these methods are based on the analysis of different chem-ical properties of the water column. Direct estimates of the anthropogenic CO2absorption in the sea surface layers are
difficult due to the large natural variability driven by physi-cal and biologiphysi-cal phenomena. Bates et al. (2014) have ex-tracted the trend from the large variability based on the anal-ysis of a long time series (monthly or seasonal sampling). For the global surface ocean, Lauvset et al. (2015) have used the Surface Ocean CO2Atlas (SOCAT) database (Bakker et
al., 2014) combined with an interpolation method. Estimates of anthropogenic storage in the Mediterranean Sea differ by about a factor of 2 (Huertas et al., 2009; Touratier and Goyet, 2009). In addition to the anthropogenic signal, oceanic DIC can also be the signature of a strong inter-annual variability. In the North Atlantic, for instance, McKinley et al. (2011) have shown that the long-term trend emerges only after more than 25 years because of natural variability.
5654 L. Merlivat et al.: Increase of dissolved inorganic carbon and decrease in pH
Figure 1.The area of the northwestern Mediterranean Sea show-ing the southern coast of France, the Island of Corsica, the main current branches (gray arrows), the location of the DYFAMED site (43◦250N, 7◦520E, red star) (http://doi.org/10.17882/43749, last access: 14 September 2018) and the BOUSSOLE buoy (43◦220N, 7◦540E, black star) in the Ligurian Sea.
this paper we analyse two 3-year time series of hourly fugac-ity of CO2, (fCO2), measured with autonomous CARIOCA
sensors (Copin-Montégut et al., 2004; Merlivat and Brault, 1995) in 1995–1997 and 2013–2015 at two nearby locations in the northwestern Mediterranean Sea (Fig. 1). Using mea-suredfCO2, temperature (T) and salinity (S), we derive the
other variables of the carbonate system (pH and DIC). The experimental setting is first described, and the recent data obtained over the 2013–2015 period are presented. Com-bined with the 1995–1997 measurements previously pub-lished (Hood and Merlivat, 2001), we estimate the decrease in pH and the increase in DIC. The results are discussed with respect to the contributions of the exchange with atmospheric CO2, the possible impact of vertical mixing and recent
esti-mates of the transport of anthropogenic carbon from the At-lantic Ocean over a 18-year period.
2 Material and methods
2.1 The BOUSSOLE and DYFAMED sites
Data collection was carried out at the BOUSSOLE site (43◦220N, 7◦540E) in 2013–2015 (Antoine et al., 2006, 2008) and at the DYFAMED site (43◦250N, 7◦520E) in 1995–1997 (Marty et al., 2002). These sites are 3 nauti-cal miles apart, both located in the Ligurian Sea, one of the basins of the northwestern Mediterranean Sea (Fig. 1). The water depth is∼2400 m. The prevailing ocean currents are usually weak (< 20 cm s−1), because these sites are in the central area of the cyclonic circulation that characterises
the Ligurian Sea. The two sites surrounded by the perma-nent geostrophic Ligurian frontal jet flow are protected from coastal inputs (Antoine et al., 2008; Heimbürger et al., 2013; Millot, 1999). Monthly cruises are carried out at the same location.
2.2 Analytical methods
At DYFAMED,fCO2measurements at 2 m were provided
by an anchored floating buoy fitted with a CARIOCA sen-sor. At BOUSSOLE, measurements were carried out from a mooring normally dedicated to radiometry and optical measurements where two CARIOCA sensors were attached. Both monitoredfCO2hourly at the 3 and 10 m depths
(al-though only one of the two depths was equipped with a func-tional sensor at some periods);SandT were monitored at the same two depths using a Seabird SBE 37-SM MicroCat in-strument. The CARIOCA sensors were adapted to work un-der pressure in the water column. They were swapped about every 6 months, with serviced and calibrated instruments re-placing those which were previously deployed. The accuracy of CARIOCAfCO2measurements by the
spectrophotomet-ric method based on the optical absorbance of a solution thy-mol blue diluted in seawater is estimated at 2 µatm during both periods. Hood and Merlivat (2001) have reported agree-ment between the fCO2 measured by CARIOCA buoys,
similar to the one deployed at DYFAMED, with ship-based measurements during a number of field programs and with an accuracy of 2 µatm and a precision of 5 µatm.
At Boussole, newly designedfCO2sensors have been
cal-ibrated using in situ seawater samples taken at 5 and 10 m depths during the monthly servicing cruises to the mooring. The total alkalinity (Alk) and DIC of the samples were de-termined by potentiometric titration using a closed cell ac-cording to the method developed by (Edmond, 1970). Certi-fied reference materials (CRMs) supplied by A. G. Dickson (Scripps Institution of Oceanography, San Diego, USA) were used for calibration (Dickson et al., 2007). The accuracy is estimated at 3 µmol kg−1 for both DIC and Alk. fCO2 is
calculated using the dissociation constants of Mehrbach re-fitted by Dickson and Millero (Dickson and Millero, 1987; Mehrbach et al., 1973) and as recommended by Álvarez et al. (2014) for the Mediterranean Sea. Uncertainty infCO2
derived from an individual sample is expected to be on the or-der of 5 µatm (Millero, 2007). About eight samples have been used to calibrate each CARIOCA sensor so that the uncer-tainty of the absolute calibration of eachfCO2CARIOCA
sensor is estimated at 1.8 µatm. In addition, we observe that the standard deviation of the difference between the CARI-OCAfCO2andfCO2computed with the monthly discrete
samples (Fig. 2b) is equal to 4.4 µatm, consistent with the ex-pected precision on CARIOCAfCO2of 5 µatm. Alk and S
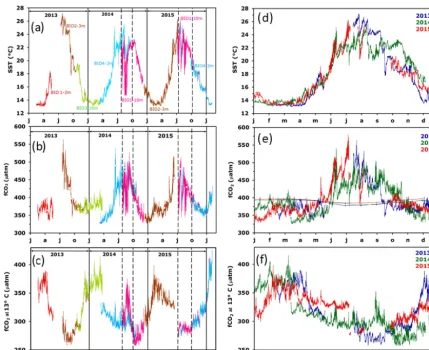
corre-Figure 2.Inter-annual variability of CARIOCA data on the BOUSSOLE mooring; left column represents a function of time and right column a function of months for a given year (blue for 2013, green for 2014 and red for 2015).(a, d)T,(b, e)fCO2and(c, f)fCO2@13◦C. In (a–c), the dotted lines indicate the period affected by stratification and internal waves (26 July to 1 October 2014 and 8 July to 1 October 2015). In(b), the open circles correspond tofCO2data derived from DIC and alkalinity measurements of samples taken at 5 and 10 m. In (e), the thin lines indicatefCO2atm. Note that the colour code on(d–f)is different from(a–c).
lated according the following relationship;
Alk(µmol kg−1)=87.647S−785.5. (1) The standard deviation of the Alk data around the regression line is equal to 4.4 µmol kg−1(r2=0.89).
3 Results
3.1 The BOUSSOLE mooring (2013–2015) time series Temperature andfCO2were measured from February 2013
to February 2016. All seasons were well represented, with missing data only in May–July 2013. For some periods, si-multaneous measurements were made at the 3 and 10 m depths (Fig. 2a–c).
The range of temperature (Fig. 2a) extends from 13◦C in winter up to 27◦C in summer, followed by progressive cool-ing in fall. The coldest temperature, 13◦C, results from the
winter vertical mixing with the deeper Levantine Interme-diate Water (LIW) marked by extremes in temperature and salinity (Copin-Montégut and Bégovic, 2002). Temperature provides the main control of the seasonality offCO2, from
350 µatm to more than 550 µatm in summer 2013 (Fig. 2b). The fugacity of CO2 in seawater is a function of
tempera-ture, DIC, alkalinity, salinity and dissolved nutrients. In the oligotrophic surface waters of the Mediterranean Sea, the ef-fect of nutrients may be neglected. Temperature and DIC have the strongest influences. By normalising fCO2 to a
constant temperature, the temperature effect can be removed and changes infCO2 resulting from changes in DIC can
be more easily identified. Figure 2c shows the variability of fCO2 normalised to the constant temperature of 13◦C,
(fCO2@13) using the equation of Takahashi et al. (1993).
The underlying processes that govern the seasonal variabil-ity of fCO2@13 are successive winter mixing, biological
[image:3.612.84.514.63.413.2]5656 L. Merlivat et al.: Increase of dissolved inorganic carbon and decrease in pH
the deepening of mixed layer in fall (Bégovic and Copin-Montegut, 2002; Hood and Merlivat, 2001). Biological pro-cesses account for the decline infCO2@13 observed from
March–April to late summer; the ensuing increase in surface fCO2@13 is associated with the deepening of the mixed
layer in the fall or convection in winter, as the vertical dis-tribution offCO2@13 at DYFAMED shows a maximum in
the 50–150 m layer. Where a large remineralisation of or-ganic matter occurs, the productive layer is mostly between 0 and 40 m (Copin-Montégut and Bégovic, 2002). The con-tribution of air–sea exchange is not significant (Bégovic and Copin-Montegut, 2002). Over the period 2013–2015, the air– sea CO2 flux from the atmosphere to the ocean surface is
equal to−0.45 mol m−2yr−1.
During summer 2014, large differences between measure-ments at 3 and 10 m were observed (Fig. 2a–c between dashed lines). A detailed analysis of the temporal variability during that period underscores the role of inertial waves at the frequency of 17.4 h that create the observed differences between the 2 depths of observations, with the deeper wa-ters being colder and enriched in fCO2@13. Temperature
andfCO2@13 variability is dominated by inertial waves. In
particular, from 15 to 26 August 2014, the difference in T between the two depths is as large as 7.6 (5.1◦C on average). fCO2decreases on average by 32.7 µatm, corresponding to
an increase infCO2@13 equal to 42.8 µatm.
The 2013–2015 seasonal and inter-annual variability ofT, fCO2 andfCO2@13 is illustrated in Fig. 2–f. The larger
inter-annual changes in temperature (Fig. 2d) are observed during summer, both at 3 and 10 m depth, while over Febru-ary and March, a constant value of 13◦C is observed as the result of vertical mixing with the LIW. A very large inter-annual variability of fCO2@13 is observed for T< 14◦C
(Fig. 2f). This is associated with the winter mixing at the mooring site, which is highly variable from year to year. Win-ter mixed-layer depth (MLD) varies between 50 and 160 m, at the top of the LIW over the 2013–2015 period (Coppola et al., 2016). The variable depth of the winter vertical mix-ing causes the difference infCO2@13, asfCO2increases
with depth (Copin-Montégut and Bégovic, 2002). The deep-ening of the MLD is driven by episodic and intense mixing processes characterised by a succession of events lasting sev-eral days, which are related to atmospheric forcing (Antoine et al., 2008) and lead to increase in fCO2@13. Figure 2e
illustrates the solubility control of the variability offCO2,
as fCO2increases whenT increases. Another cause of the
inter-annual variability offCO2forT ∼14◦C is the timing
of the spring increase in biological activity, which differs by a month between years. For instance, the increase happened at the beginning of April in 2013, whenT ∼15–16◦C and by mid March in 2014, whenT ∼14◦C. Another cause is the deepening of the mixed layer due to the fall cooling, which varies by a month between years.
3.2 Decadal changes in hydrography 3.2.1 Sea surface temperature changes
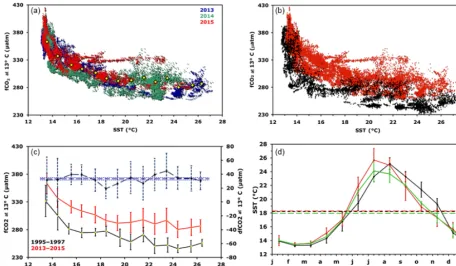
Monthly mean values of temperature have been computed for the two 3-year periods, 1995–1997 and 2013–2015. In 1995– 1997,fCO2andT at 2 m were measured with CARIOCA
sensors installed on a buoy at DYFAMED (Hood and Mer-livat, 2001). The mean annual temperature of hourly CAR-IOCA data is equal to 18.21◦C. For 2013–2015, tempera-ture measurements made on the BOUSSOLE mooring at 3 and 10 m have been used. For the April to September time interval, there are only data at the 3 m depth. In addition, temperature data measured half hourly at 0.7 m at a nearby meteorological buoy (43◦230N, 7◦500E) (https://doi.org/10. 6096/hymex.azurbuoy.thermosalinograph.20100308, last ac-cess: 19 September 2018; Rolland and Bouin, 2010) have been used (Fig. 3d). Mean annual temperatures are equal to 18.29 and 17.97◦C, respectively, based on the meteorolog-ical buoy and the BOUSSOLE mooring data. The two sets of data differ essentially during July and August, with the temperatures at 3 m colder than those at 0.7 m, which indi-cates a thermal gradient between the two depths during sum-mer. Therefore, for 2013–2015, we select the mean annual value computed with the meteorological buoy, 18.29◦C, as a better representation of the sea surface. This value is close to 18.21◦C computed for 1995–1997. Thus, no significant change in SST is found between the 2 decades, with a mean value equal to 18.25◦C.
3.2.2 Sea surface salinity changes
The mean value of salinity and the standard error of the mean computed from 56 samples taken at BOUSSOLE in 2013– 2015 are respectively 38.19 and 0.02. In 1998–1999, ship measurements of surface salinity were made during monthly cruises at the DYFAMED site (Copin-Montégut et al., 2004). The mean salinity and the standard error of the mean of this set of 19 data are respectively 38.21 and 0.03. Thus, there is no significant salinity change between the two decades. 3.3 Decadal changes infCO2@13
3.3.1 Time series offCO2@13 in 1995–1997 and 2013–2015
The two time series of high-frequency data were analysed in order to quantify the change infCO2@13 2 decades apart
at the sea surface. To account for the inter-annual seasonal variability as well as irregular sampling, we performed an analysis of the change infCO2@13 as a function of SST
(Fig. 3a and b). For the 2013–2015 data set, we excluded summer data measured at 10 m depth as they were not rep-resentative of the surface mixed layer due to a strong strati-fication. Much largerfCO2@13 values are observed at low
Figure 3. (a)fCO2@13 as a function of temperature for hourly data in 2013, 2014 and 2015.The yellow dots indicate meanfCO2@13.(b)is similar to(a)but represents all hourly data in 1995–1997 (black) and in 2013–2015 (red).(c)is similar to(b)but represents average values per 1◦C interval (standard deviation as dotted line). The difference between the two periods is also displayed by the dashed blue curve (scale on the right axis; the mean difference over all SST is represented by the horizontal blue line).(d)Mean monthly sea surface temperature for 1993–1995 (black curve for CARIOCA sensors), 2013–2015 (green for CARIOCA sensors) and 2013–2015 (red for meteorological buoy). Corresponding mean annual values are indicated by dotted lines.
similar and strongly nonlinear for the two studied periods. As described in Sect. 3.1, large values at low temperatures result from mixing with enriched deep waters during win-ter, and low values for 26–28◦C temperatures occur at the end of summer after the biological drawdown of carbon. An increase in fCO2@13 between the two periods is evident
across the range of temperatures.
3.3.2 Trend analysis and statistics
To quantify the change infCO2@13 between the two data
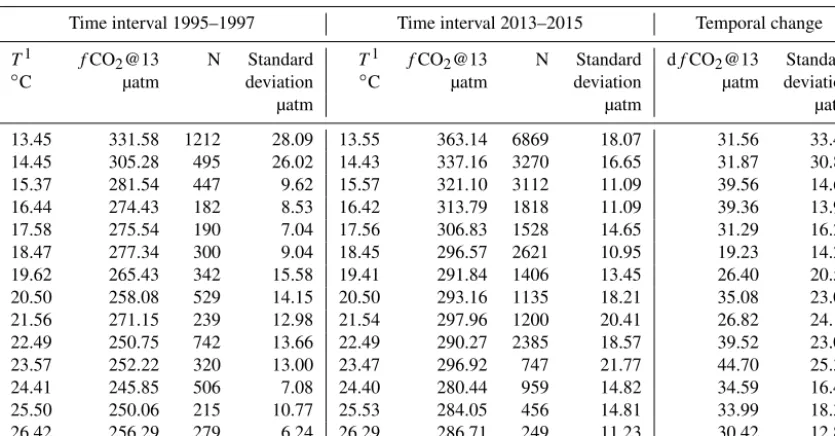
sets, we proceed as follows: data are binned by 1◦C tem-perature intervals, thereby removing any potential seasonal weighting, especially towards the 13–14◦C winter months temperature. The measurements made in this temperature in-terval represent about 25 % of the total number of data for both periods. For each of the fourteen 1◦C steps, the mean and standard deviation of hourly fCO2@13 measurements
are reported in Table 1 and in Fig. 3c. The mean temperature within each of the 1◦steps differ for the two periods, as the distribution of individual measurements are not identical.
For both data sets, a monotonic relationship between fCO2@13 and T is observed with correlation coefficients
respectively equal to −0.861 and −0.857. The difference
infCO2@13 between the two periods, dfCO2@13, is
de-rived in each temperature step, seen in the difference between column 2 and 6 of Table 1. The variability of this differ-ence is estimated as the quadratic mean of the standard de-viation in each time series. Both values are reported in Ta-ble 1, column 9 and 10 and in Fig. 3c. The distribution of each dfCO2@13 values around the mean over all SST of
dfCO2@13 seems random and indicates no trend of
depen-dency with SST (Fig. 3c). This suggests that the processes that control the seasonal variation offCO2@13 at the sea
surface have not changed over the last two decades.
We have estimated the uncertainties in the estimates of the difference dfCO2@13 with two methods. Firstly, the
arithmetic mean of dfCO2@13 is equal to 33.17 µatm, with
a standard deviation (SD) and standard error (SE), respec-tively equal to 6.29 µatm and 1.68 µatm. A 95 % confidence interval is thereby achieved within 1.96 SE, i.e. 3.29 µatm. A second approach consists of computing a weighted aver-age of the mean of dfCO2@13. In this case, mean weighted
value of dfCO2@13 over the whole range of
tempera-tures is estimated, the weights being equal to the vari-ance of dfCO2@13 in each temperature step. The value
of dfCO2@13 is equal to 32.70 µatm. The weighted SD,
[image:5.612.69.526.66.332.2]5658 L. Merlivat et al.: Increase of dissolved inorganic carbon and decrease in pH
Table 1.Distribution of temperature,fCO2@13, and increase dfCO2@13 data binned by 1◦C temperature interval for the two periods 1995–1997 and 2013–2015.
Time interval 1995–1997 Time interval 2013–2015 Temporal change
T1 fCO2@13 N Standard T1 fCO2@13 N Standard dfCO2@13 Standard ◦
C µatm deviation ◦C µatm deviation µatm deviation
µatm µatm µatm
13.45 331.58 1212 28.09 13.55 363.14 6869 18.07 31.56 33.40 14.45 305.28 495 26.02 14.43 337.16 3270 16.65 31.87 30.89
15.37 281.54 447 9.62 15.57 321.10 3112 11.09 39.56 14.68
16.44 274.43 182 8.53 16.42 313.79 1818 11.09 39.36 13.99
17.58 275.54 190 7.04 17.56 306.83 1528 14.65 31.29 16.25
18.47 277.34 300 9.04 18.45 296.57 2621 10.95 19.23 14.20
19.62 265.43 342 15.58 19.41 291.84 1406 13.45 26.40 20.59 20.50 258.08 529 14.15 20.50 293.16 1135 18.21 35.08 23.06 21.56 271.15 239 12.98 21.54 297.96 1200 20.41 26.82 24.19 22.49 250.75 742 13.66 22.49 290.27 2385 18.57 39.52 23.05
23.57 252.22 320 13.00 23.47 296.92 747 21.77 44.70 25.36
24.41 245.85 506 7.08 24.40 280.44 959 14.82 34.59 16.43
25.50 250.06 215 10.77 25.53 284.05 456 14.81 33.99 18.31
26.42 256.29 279 6.24 26.29 286.71 249 11.23 30.42 12.85
equal to 4.85 and 1.30 µatm. A 95 % confidence interval is achieved within 2.54 µatm. The difference between the two mean dfCO2@13 estimates is 0.47 µatm, well below SE. In
the following, we have chosen the former method. 3.4 Changes of seawater carbonate chemistry in
surface waters
We estimated the DIC and pH changes related to the in-crease in fCO2@13 measured at the sea surface 18 years
apart, assuming a mean salinity equal to 38.2, a mean al-kalinity equal to 2562.3 µmol kg−1 following Eq. (1) and a mean in situ temperature (T) equal to 18.25◦C. The dissoci-ation constants of Mehrbach refitted by Dickson and Millero (Dickson and Millero, 1987; Mehrbach et al., 1973) were used. pH is calculated on the seawater scale. The uncer-tainty of dfCO2@13, 3.3 µatm, has been propagated to
com-pute the combined uncertainty in dDIC and dpHSWS. The
uncertainties in the equilibrium constants are neglected in this propagation of uncertainties. Likewise, an implicit as-sumption is that there is no systematic error on DIC and pHSWS derived fromfCO2@13 between the two time
pe-riods; in particular, mean temperature and salinity remain the same (Sect. 3.2). This is further discussed in Sect. 4.1. We compute an increase in DIC and dDIC equal to 25.2±
2.7 µmol kg−1 (1.40±0.15 µmol kg−1yr−1) and a decrease in pHSWS and dpHSWS equal to −0.0397±0.0042 pHSWS
(−0.0022±0.0002 pHSWSyr−1) (Table 2).
3.5 Changes in atmospheric and seawaterfCO2 The increase in atmospheric fCO2 from 1995–1997 to
2013–2015 was computed from the monthly atmospheric
xCO2 concentrations measured at the Lampedusa Island
station (Italy) (35◦310N, 12◦370E) (http://ds.data.jma.go.jp/ gmd/wdcgg/, last access: 14 September 2018) (see Eq. 3 in Hood and Merlivat, 2001). Considering a mean annual in situ temperature equal to 18.25◦C and an atmospheric pres-sure of 1 atm, we derived a mean atmosphericfCO2equal
to 355.3±0.8 µatm for 1995–1997 and 389.6±0.9 µatm for 2013–2015, which is an increase of 34.3±2.3 µatm (95 % confidence interval) (Table 2). At this temperature, the change infCO2 at the sea surface is 41.4±4.1 µatm.
Thus the contribution of the increase in atmospheric CO2is
responsible for 84 %±5 % of the increase in fCO2
mea-sured in the surface waters. With the same salinity and al-kalinity as previously, the measurement of the corresponding change in surface DIC, assuming air–sea equilibrium, would be 20.8±1.3 µmol kg−1(Table 2).
4 Discussion
4.1 Time change in surface alkalinity
High-frequency measurements of fCO2 and temperature
over two periods of 3 years that are 2 decades apart have allowed the computation of an increase in DIC equal to 25.1±2.3 µmol kg−1 assuming no change in alkalinity. In
Table 2.Seasonally detrended long-term and annual trends of seawater carbonate chemistry and atmospheric composition.
dfCO2a dfCO2a dDICa dpHSWSc dfCO2 dDIC annual dpHSWSc @13 µatm @T µatm µmol kg−1 pH unit @T annual µmol kg1yr1 annual pH
µatm yr−1 unit yr1
Sea surface 33.2±3.3 41.4±4.1 25.2±2.7 −0.0397±0.0042 2.30±0.23 1.40±0.15 −0.0022±0.0002
Atmosphere 34.3±2.3 20.8±1.3b 1.91±0.13 1.15±0.07 Lampedusa data
dfCO2@Tair/ 0.83±0.10 0.83±0.09 dfCO2@Tsea
T, mean annual temperature equal to 18.25◦C;achange from 1995–1997 to 2013–2015;bdDIC
ant;cdpHSWScomputed atT.
supplied by A. G. Dickson for calibration. It is difficult to identify the cause for a possible change in alkalinity be-tween the two periods that are 18 years apart, while no salinity change has been observed. At a coastal site 50 km away from DYFAMED, Kapsenberg et al. (2017) have mea-sured an increase in alkalinity unrelated to salinity over the period from 2007 to 2015. They attribute it to changes in freshwater inputs from land. However, based on data from Coppola et al. (2016), alkalinity in the upper 50 m at DY-FAMED did not change significantly from 2007 to 2014 (3.204 µmol kg−1,P =0.0794,r2=0.08). Thus, we cannot conclude whether the difference observed at DYFAMED and BOUSSOLE between the two periods is real or an artifact of measurement techniques. As a sensitivity test, we com-pute the expected changes in DIC and pH from 1995–1997 to 2013–2015 for a mean alkalinity increase in 10 µmol kg−1. We obtain annual changes of dDIC= +0.46 µmol kg−1yr−1 and dpH= −0.0001 pH unit yr−1, which are well below er-rors estimated in Sect. 3.4. Hence, such a change in alkalin-ity does not significantly affect the increase in DIC and the decrease in pH shown in Table 2.
4.2 Drivers of the temporal change in DIC in surface waters
The increase in sea surface DIC from 1995–1997 to 2013– 2015 is 25.2±2.7 µmol kg−1(Table 2), whereas the expected contribution due to ocean uptake of anthropogenic CO2 is
20.8±1.3 µmol kg−1. In order to interpret the difference be-tween these two values, we examine potential changes that may result from the inter-annual variability in local physical and biological processes or anthropogenic carbon invasion from lateral advection of Atlantic waters.
4.2.1 Natural variability
Time series of the mixed layer depth (MLD) show a strong variability in winter at inter-annual scale. During the two pe-riods, 1995–1997 and 2013–2015, the winter MLD never ex-ceeded 220 m, whereas values over 300 m were observed in 1999 and especially in February and March 2006, with values
close to 2000 m (Coppola et al., 2016; Pasqueron de Fom-mervault et al., 2015). These episodes of strong and deep ver-tical mixing must have entrained DIC-rich LIW in the surface waters. This entrainment could be causing an increase in DIC between the 1995–1997 and 2013–2015 periods. Monthly surface samples collected at the Dyfamed time series sta-tion between 1998 and 2013 indicate an increasing DIC trend of 1.35 µmol kg−1yr−1. This value is uncertain (r2=0.05) because of the large seasonal variability displayed in the monthly samples (Gemayel et al., 2015). Nevertheless, this value is closer to the trend we calculated between the two periods, 1993–1995 and 2013–2015 (1.40 µmol kg−1yr−1) than to the trend inferred from the atmospheric increase (1.15 µmol kg−1yr−1). In the DYFAMED time series, we find no evidence that the strong increase in MLD observed during winters 1999 and especially 2006 resulted in a further increase in DIC.
The monthly cruises of the Dyfamed time-series study have also been analysed in order to investigate the hydro-logical changes and some biohydro-logical consequences over the period 1995–2007 (Marty and Chiavérini, 2010). These au-thors show that extreme convective mixing events such as those recorded in 1999 and 2006 are responsible for large increases in nutrient content in surface layers and conclude that biological productivity is increasing, especially during the 2003–2006 period, which could lead to a larger consump-tion of carbon, i.e. a decrease in DIC.
4.2.2 Anthropogenic carbon exchange through the Strait of Gibraltar.
The concentration of oceanic anthropogenic carbon (Cant) is
not a directly measurable quantity. To estimate it, several em-pirical methods have been developed. Flecha et al. (2012) computed the anthropogenic carbon inventory in the Gulf of Cadiz. They used observations made during a cruise in October 2008 throughout the oceanic area covered by the Gulf of Cadiz and the Strait of Gibraltar to estimate Cant
5660 L. Merlivat et al.: Increase of dissolved inorganic carbon and decrease in pH
and ϕC0T (Vázquez-Rodríguez et al., 2009). In the three cases, their results indicate a net import of Cantfrom the
At-lantic towards the Mediterranean through Gibraltar.
Schneider et al. (2010), using the transit-time distribu-tion method applied to a data set from a Mediterranean cruise in 2001, estimated a net anthropogenic carbon flux across the Strait of Gibraltar into the Mediterranean Sea of 3.5 Tg C yr−1. Over the whole period from 1850 to 2001, this contribution of Cant represents almost 10 % of the
to-tal Cant inventory of the Mediterranean Sea. Accordingly,
about 90 % must have been taken directly from an equilib-rium with atmospheric CO2. Based on a high-resolution
re-gional model, Palmiéri et al. (2015) computed the anthro-pogenic carbon storage in the Mediterranean basin. They concluded that 75 % of the total storage of Cantin the whole
basin comes from the atmosphere and 25 % from net trans-port from the Atlantic through the Strait of Gibraltar. The findings of these two studies support our estimated change in DIC of (17±10) % in addition to the direct contribution of air–sea exchange suggesting that it could result from the anthropogenic carbon input from the Atlantic Ocean towards the Mediterranean basin.
Huertas et al. (2009) and Schneider et al. (2010) re-port DICantsurface concentrations respectively equal to 65–
70 µmol kg−1 at the Strait of Gibraltar in the years 2005– 2007 and close to 65 µmol kg−1in the western basin in 2001. We extrapolate these figures to the year 2014, assuming a mean increased rate of DIC equal to 1.4 µmol kg−1yr−1as previously computed (Table 2). Taking into account the in-crease in DICant equal to 25.2 µmol kg−1 between 1995–
1997 and 2013–2015, we estimate that the contribution of the change in DICantover the last 18 years represents∼30 % of
the total change since the beginning of the industrial period (t >∼1800).
4.3 Long-term trends in surface DIC and pH
The annual changes in DIC and pHSWS calculated between
1995–1997 and 2013–2015 are respectively equal to 1.40±
0.15 µmol kg−1and−0.0022±0.0002. At the DYFAMED site, at 10 m, Marcellin Yao et al. (2016) studied the time variability of pH over 1995–2011 based on measurements of T, S, Alk and DIC sampled approximately once a month. They computed a mean annual decrease in pH, −0.003±
0.001, which is not significantly different from our estimate. For the global surface ocean, Lauvset et al. (2015) have re-ported a mean rate of decrease in pH,−0.0018±0.0004 for 1991–2011. This value is also within the limits of uncertainty of the pH change computed in our study.
Bates et al. (2014) examined changes in surface seawa-ter CO2-carbonate chemistry at the locations of seven ocean
CO2time series that have been gathering sustained
observa-tions from 15 to 30 years with monthly or seasonal sampling. Six stations are located in the Atlantic and Pacific oceans in a latitudinal band between 10 and 68◦N. The range of
in-creasing and dein-creasing annual trends of DIC and pH ex-tends from 0.93±0.24 to 1.89±0.45 µmol kg−1yr−1 and
−0.0014±0.0005 to −0.0026±0.0006, respectively. The Revelle factor of surfaces waters vary from 9–10 in low lat-itudes to 12–15 in the subpolar time series sites, with higher Revelle factor values reflecting a reduced capacity to absorb atmospheric CO2. The data show that the increase in DIC is
not only controlled by the buffer capacity of the water but also by the compounding effects of changes in physical fac-tors like the strengthening of winter mixing or larger air–sea uptake (Olafson et al., 2010).
The increase in DIC computed at DYFAMED is in the upper range of values reported in the other time series. A low Revelle factor of close to 10 characterises the Mediter-ranean Sea because of its warm and high-alkalinity waters. Moreover, as the result of a relatively short deep-water re-newal time estimated to be 20–40 years in the western basin (Schneider et al., 2010), the waters of the Mediterranean Sea have a relatively high capacity to absorb anthropogenic CO2
from the atmosphere and transport it to deep water.
The calculated decrease in pH in the surface water at DY-FAMED and in the global ocean are quite similar, despite the higher alkalinity of the Mediterranean Sea. Thermodynamic equilibrium calculations have highlighted the alkalinity’s ef-fect on the anthropogenic acidification of the Mediterranean Sea (Palmiéri et al., 2015). Their results show that, notwith-standing a higher total alkalinity, the average anthropogenic change in the surface pH of the Mediterranean Sea does not differ significantly from that of the average of global oceans.
5 Conclusion
High-frequency oceanfCO2measurements made by
CAR-IOCA sensors have been used to calculate trends infCO2,
DIC and pH over a period of two decades, notwithstanding the short-time and natural seasonal variability of these prop-erties at the sea surface. We have estimated a large change in sea-surface carbonate chemistry, an increase in DIC and a decrease in pH. The computed increase in DIC is larger than the change expected from a chemical equilibrium with atmospheric CO2.This could be the result of the strong
inter-annual variability of the winter mixing observed between the two periods of 1993–1995 and 2013–2015. Likewise, our re-sults support modelling work and analysis of vertical pro-files measurements that suggest that the Atlantic Ocean con-tributes a substantial amount of anthropogenic carbon to the Mediterranean basin, (17±10)%, which lies between the es-timates of 10 % (Schneider et al., 2010) and 25 % (Palmiéri et al., 2015).
Boussole data (2013–2015) are available in the SEANOE database (Merlivat and Boutin, 2018).
Competing interests. The authors declare that they have no conflict of interest.
Acknowledgements. Seawater samples were analysed for DIC
and Alk by the SNAPO-CO2at LOCEAN in Paris. The CO2Sys toolbox of Pierrot et al. (2006) has been used for the calculations of DIC and pH. The adaptation of CARIOCA sensors to high pressure has been supported by the BIO-optics and CARbon EXperiment (BIOCAREX) project, funded by the Agence Nationale de la Recherche (ANR, Paris). We are grateful for the helpful comments from Gilles Reverdin and the reviewers of the manuscript. Many thanks to Laurent Coppola, who kindly provided additional MLD data at Dyfamed.
Edited by: Jack Middelburg
Reviewed by: two anonymous referees
References
Álvarez, M., Sanleón-Bartolomé, H., Tanhua, T., Mintrop, L., Luchetta, A., Cantoni, C., Schroeder, K., and Civitarese, G.: The CO2system in the Mediterranean Sea: a basin wide perspective, Ocean Sci., 10, 69–92, https://doi.org/10.5194/os-10-69-2014, 2014.
Antoine, D., Chami, M., Claustre, H., d’Ortenzio, F., Morel, A., Bécu, G., Gentili, B., Louis, F., Ras, J., Roussier, E., Scott, A.J., Tailliez, D., Hooker, S. B., Guevel, P., Desté, J.-F., Dempsey, C., and Adams, D.: BOUSSOLE: A joint CNRS-INSU, ESA, CNES, and NASA ocean color calibration and validation activ-ity, NASA Tech. Memo. 2006-214147, 2006.
Antoine, D., d’Ortenzio, F., Hooker, S. B., Bécu, G., Gentili, B., Tailliez, D., and Scott, A. J.: Assessment of uncertainty in the ocean reflectance determined by three satellite ocean color sen-sors (MERIS, SeaWiFS and MODIS-A) at an offshore site in the Mediterranean Sea (BOUSSOLE project), J. Geophys. Res., 113, https://doi.org/10.1029/2007JC004472, 2008.
Bakker, D. C. E., Pfeil, B., Smith, K., Hankin, S., Olsen, A., Alin, S. R., Cosca, C., Harasawa, S., Kozyr, A., Nojiri, Y., O’Brien, K. M., Schuster, U., Telszewski, M., Tilbrook, B., Wada, C., Akl, J., Barbero, L., Bates, N. R., Boutin, J., Bozec, Y., Cai, W.-J., Castle, R. D., Chavez, F. P., Chen, L., Chierici, M., Cur-rie, K., de Baar, H. J. W., Evans, W., Feely, R. A., Fransson, A., Gao, Z., Hales, B., Hardman-Mountford, N. J., Hoppema, M., Huang, W.-J., Hunt, C. W., Huss, B., Ichikawa, T., Johan-nessen, T., Jones, E. M., Jones, S. D., Jutterström, S., Kitidis, V., Körtzinger, A., Landschützer, P., Lauvset, S. K., Lefèvre, N., Manke, A. B., Mathis, J. T., Merlivat, L., Metzl, N., Murata, A., Newberger, T., Omar, A. M., Ono, T., Park, G.-H., Pater-son, K., Pierrot, D., Ríos, A. F., Sabine, C. L., Saito, S., Salis-bury, J., Sarma, V. V. S. S., Schlitzer, R., Sieger, R., Skjelvan, I., Steinhoff, T., Sullivan, K. F., Sun, H., Sutton, A. J., Suzuki, T., Sweeney, C., Takahashi, T., Tjiputra, J., Tsurushima, N., van Heuven, S. M. A. C., Vandemark, D., Vlahos, P., Wallace, D. W.
R., Wanninkhof, R., and Watson, A. J.: An update to the Surface Ocean CO2Atlas (SOCAT version 2), Earth Syst. Sci. Data, 6, 69–90, https://doi.org/10.5194/essd-6-69-2014, 2014.
Bakker, D. C. E., Pfeil, B., Landa, C. S., Metzl, N., O’Brien, K. M., Olsen, A., Smith, K., Cosca, C., Harasawa, S., Jones, S. D., Nakaoka, S.-I., Nojiri, Y., Schuster, U., Steinhoff, T., Sweeney, C., Takahashi, T., Tilbrook, B., Wada, C., Wanninkhof, R., Alin, S. R., Balestrini, C. F., Barbero, L., Bates, N. R., Bianchi, A. A., Bonou, F., Boutin, J., Bozec, Y., Burger, E. F., Cai, W.-J., Castle, R. D., Chen, L., Chierici, M., Currie, K., Evans, W., Feather-stone, C., Feely, R. A., Fransson, A., Goyet, C., Greenwood, N., Gregor, L., Hankin, S., Hardman-Mountford, N. J., Harlay, J., Hauck, J., Hoppema, M., Humphreys, M. P., Hunt, C. W., Huss, B., Ibánhez, J. S. P., Johannessen, T., Keeling, R., Kitidis, V., Körtzinger, A., Kozyr, A., Krasakopoulou, E., Kuwata, A., Land-schützer, P., Lauvset, S. K., Lefèvre, N., Lo Monaco, C., Manke, A., Mathis, J. T., Merlivat, L., Millero, F. J., Monteiro, P. M. S., Munro, D. R., Murata, A., Newberger, T., Omar, A. M., Ono, T., Paterson, K., Pearce, D., Pierrot, D., Robbins, L. L., Saito, S., Salisbury, J., Schlitzer, R., Schneider, B., Schweitzer, R., Sieger, R., Skjelvan, I., Sullivan, K. F., Sutherland, S. C., Sutton, A. J., Tadokoro, K., Telszewski, M., Tuma, M., van Heuven, S. M. A. C., Vandemark, D., Ward, B., Watson, A. J., and Xu, S.: A multi-decade record of high-qualityfCO2data in version 3 of the Sur-face Ocean CO2Atlas (SOCAT), Earth Syst. Sci. Data, 8, 383– 413, https://doi.org/10.5194/essd-8-383-2016, 2016.
Bates, N., Astor, Y., Church, M., Currie, K., Dore, J., Gonaález-Dávila, M., Lorenzoni, L., Muller-Karger, F., Olafsson, J., and Santa-Casiano, M.: A Time-Series View of Changing Ocean Chemistry Due to Ocean Uptake of Anthropogenic CO2 and Ocean Acidification, Oceanography, 27, 126–141, 2014. Bégovic, M. and Copin-Montegut, C.: Processes controlling annual
variations in the partial pressure offCO2 in surface waters of the central northwestern Mediterranean sea (Dyfamed site), Deep-Sea Res. Pt. II, 49, 2031–2047, 2002.
Chen, G. T. and Millero, F. J.: Gradual increase of oceanic CO2, Nature, 277, 205–206, 1979.
Copin-Montegut, C. and Bégovic, M.: Distributions of carbonate properties and oxygen along the water column (0–2000 m) in the central part of the NW Mediterranean Sea (Dyfamed site): influ-ence of winter vertical mixing on air–sea CO2and O2exchanges, Deep-Sea Res. Pt. II 49, 2049–2066, 2002.
Copin-Montégut, C., Bégovic, M., and Merlivat, L.: Variability of the partial pressure of CO2 on diel to annual time scales in the Northwestern Mediterranean Sea, Mar. Chem., 85, 169–189, 2004.
Coppola, L., Diamond Riquier, E., and Carval, T.: Dyfamed obser-vatory data, SEANOE, https://doi.org/10.17882/43749, 2016. Dickson, A. G. and Millero, F. J.: A comparison of the equilibrium
constants for the dissociation of carbonic acid in seawater media, Deep-Sea Res., 34, 1733–1743, 1987.
Dickson, A. G., Sabine, C. L., and Christian, J. R. (Eds.): Guide to Best Practices for Ocean CO2Measurements, PICES Special Publication 3, 191 pp., 2007.
5662 L. Merlivat et al.: Increase of dissolved inorganic carbon and decrease in pH
Flecha, S., Pérez, F. F., Navarro, G., Ruiz, J., Olivé, I., Rodríguez-Gálvez, S., Costas, E., and Huertas, I. E.: Anthropogenic carbon inventory in the Gulf of Cádiz, J. Marine Syst., 92, 67–75, 2012. Gattuso, J.-P. and Hansson, L.: Ocean Acidification, Oxford
Uni-versity Press, Oxford, UK, 352 pp., 2011.
Gemayel, E., Hassoun, A. E. R., Benallal, M. A., Goyet, C., Ri-varo, P., Abboud-Abi Saab, M., Krasakopoulou, E., Touratier, F., and Ziveri, P.: Climatological variations of total alka-linity and total dissolved inorganic carbon in the Mediter-ranean Sea surface waters, Earth Syst. Dynam., 6, 789–800, https://doi.org/10.5194/esd-6-789-2015, 2015.
Gruber, N., Sarmiento, J. L., and Stocker, T. F.: An improved method for detecting anthropogenic CO2in the oceans, Global Biogeochem. Cy., 10, 809–837, 1996.
Heimbürger, L.-E., Lavigne, H., Migon, C., D’Ortenzio, F., Es-tournel, C., Coppola, L., and Miquel, J.-C.: Temporal variabil-ity of vertical export flux at the DYFAMED time-series station (Northwestern Mediterranean Sea), Progr. Oceanogr., 119, 59– 67, 2013.
Hood, E. M. and Merlivat, L.: Annual and interannual variations offCO2 in the northwestern Mediterranean Sea: Results from hourly measurements made by CARIOCA buoys, 1995–1997, J. Mar. Res., 59, 113–131, 2001.
Huertas, I. E., Ríos, A. F., García-Lafuente, J., Makaoui, A., Rodríguez-Gálvez, S., Sánchez-Román, A., Orbi, A., Ruíz, J., and Pérez, F. F.: Anthropogenic and natural CO2 exchange through the Strait of Gibraltar, Biogeosciences, 6, 647–662, https://doi.org/10.5194/bg-6-647-2009, 2009.
Kapsenberg, L., Alliouane, S., Gazeau, F., Mousseau, L., and Gat-tuso, J.-P.: Coastal ocean acidification and increasing total al-kalinity in the northwestern Mediterranean Sea, Ocean Sci., 13, 411–426, https://doi.org/10.5194/os-13-411-2017, 2017. Lauvset, S. K., Gruber, N., Landschützer, P., Olsen, A., and
Tjiputra, J.: Trends and drivers in global surface ocean pH over the past 3 decades, Biogeosciences, 12, 1285–1298, https://doi.org/10.5194/bg-12-1285-2015, 2015.
Marcellin Yao, K., Marcou, O., Goyet, C., Guglielmi, V., Touratier, F., and Savy, J.-P.: Time variability of the north-western Mediter-ranean Sea pH over 1995–2011, Mar. Environ. Res., 116, 51–60, 2016.
Marty, J. C. and Chiavérini, J.: Hydrological changes in the Ligurian Sea (NW Mediterranean, DYFAMED site) during 1995–2007 and biogeochemical consequences, Biogeosciences, 7, 2117– 2128, https://doi.org/10.5194/bg-7-2117-2010, 2010.
Marty, J. C., Chiaverini, J., Pizay, M., D., and Avril, B.: Seasonal and interannual dynamics of nutrients and phytoplankton pig-ments in the western Mediterranean Sea at the DYFAMED time-series station (1991–1999), Deep-Sea Res. Pt. II, 49, 1965–1985, 2002.
McKinley, G. A., Fay, A. R., Takahashi, T., and Metzl, N.: Conver-gence of atmospheric and North Atlantic carbon dioxide trends on multidecadal timescales, Nat. Geosci., 4, 606–610, 2011. Mehrbach, C., Culberson, C. H., Hawley, J. E., and
Pytkow-icx, R. M.: Measurement of the apparent dissociation constants of carbonic acid in seawater at atmospheric pressure, Limnol. Oceanogr., 18, 897–907, 1973.
Merlivat, L. and Boutin, J.: Mediterranean Sea surface CO2 partial pressure and temperature data, SEANOE, https://doi.org/10.17882/56709, 2018.
Merlivat, L. and Brault, P.: CARIOCA BUOY, Carbon Dioxide Monitor, Sea Technol., 23–30, 1995.
Millero, F. J.: The marine inorganic carbon cycle, Chem. Rev., 107, 308–341, 2007.
Millot, C.: Circulation in the Western Mediterranean Sea, J. Marine Syst., 20, 423–442, 1999.
Olafsson, J., Olafsdottir, S. R., Benoit-Cattin, A., and Takahashi, T.: The Irminger Sea and the Iceland Sea time series measure-ments of sea water carbon and nutrient chemistry 1983–2008, Earth Syst. Sci. Data, 2, 99–104, https://doi.org/10.5194/essd-2-99-2010, 2010.
Palmiéri, J., Orr, J. C., Dutay, J.-C., Béranger, K., Schneider, A., Beuvier, J., and Somot, S.: Simulated anthropogenic CO2storage and acidification of the Mediterranean Sea, Biogeosciences, 12, 781–802, https://doi.org/10.5194/bg-12-781-2015, 2015. Pasqueron de Fommervault, O., Migon, C., D’Ortenzio, F., Ribera
d’Alcalà, M., and Coppola, L.: Temporal variability of nutri-ent concnutri-entrations in the northwestern Mediterranean sea (DY-FAMED time-series station), Deep-Sea Res. Pt. I, 100, 1–12, 2015.
Pierrot, D. E. L. and Wallace, D. W. R.: MS Excel Program Devel-oped for CO2 System Calculations, ORNL/CDIAC-105a, Car-bon Dioxide Information Analysis Center, Oak Ridge National Laboratory, U.S. Department of Energy, Oak Ridge, Tennessee, https://doi.org/10.3334/CDIAC/otg.CO2SYS_XLS_CDIAC105a, 2006.
Rolland, J. and Bouin, M. N.: Thermosalinograph, azur buoy [data set], CMM/CNRM (Météo-France), https://doi.org/10.6096/hymex.azurbuoy.thermosalinograph.20100308 (last access: 19 September 2018), 2010.
Sabine, C. L., Feely, R. A., Millero, F. J., Dickson, A. G., Langdon, C., Mecking, S., and Greeley, D.: Decadal changes in Pacific carbon, J. Geophys. Res., 113, C07021, https://doi.org/10.1029/2007JC004577, 2008.
Schneider, A., Tanhua, T., Körtzinger, A., and Wallace, D. W. R.: High anthropogenic carbon content in the eastern Mediterranean, J. Geophys. Res., 115, C12050, https://doi.org/10.1029/2010JC006171, 2010.
Takahashi, T., Olafson, J., Goddard, J. G., Chipman, D. W., and Sutherland, G.: Seasonal variations of CO2and nutrients in the high-latitude surface oceans:a comparative study, Global Bio-geochem. Cy., 7, 843–878, 1993.
Touratier, F. and Goyet, C.: Applying the new TrOCA approach to assess the distribution of anthropogenic CO2in the Atlantic Ocean, J. Marine Syst., 46, 181–197, 2004.
Touratier, F. and Goyet, C.: Decadal evolution of anthropogenic CO2in the northwestern Mediterranean Sea from the mid-1990s to the mid-2000s, Deep-Sea Res. Pt. I, 56, 1708–1716, 2009. Touratier, F., Azouzi, L., and Goyet, C.: CFC-11, 14C and 3H
trac-ers as a means to assess anthropogenic CO2concentrations in the ocean, Tellus B, 59, 318–325, 2007.
Vázquez-Rodríguez, M., Padin, X. A., Ríos, A. F., Bellerby, R. G. J., and Pérez, F. F.: An upgraded carbon-based method to estimate the anthropogenic fraction of dissolved CO2 in the Atlantic Ocean, Biogeosciences Discuss., 6, 4527–4571, https://doi.org/10.5194/bgd-6-4527-2009, 2009.