International Journal of Innovative Technology and Exploring Engineering (IJITEE) ISSN: 2278-3075, Volume-8 Issue-7, May, 2019
Candle Stick Pattern RecognitionUsing
Convolutional Neural Network (ResNet)
Ms.Rajyashree,Vishvak.S.Athreiya,Pavan Balaji K,Siddharth.S
Abstract: Financial Markets is depicted as a place where you can make money easily. So, the analysis of the stock market is one of the most happening and interesting analysis Lot of top investment banking company HNI’s (High net worth individuals) who are Active in financial markets use a leading indicator called candle sticks for finding the direction of the movement of a stock and act accordingly to yield maximum profit. Many researchers have come up with a lot of modelling to find these movements. In this research we are going to use Data Analysis and Convolutional Neural Network to find the patterns and movement of the stock prices.
Index terms: Candle Stick Analysis, Data Analysis, Convolutional Neural Networks, Residual Neural Network.
I. INTRODUCTION
The stock markets are considered one of the biggest opportunities to invest and earn money. Since the return on invest percentage is considered comparatively high than other field of business. Hence a lot of people from small investors to big investors all try to make use of the stock markets. Unfortunately, most of the people lose money instead of earning. The main reason people lose money is that they do not know how the stock markets work. People try to understand how using a lot of statistical modeling or indicators etc.The learning and understanding of stock are basically divided into two major topics. Fundamental Analysis and Technical Analysis.Fundamental Analysis is used for long term investment in which people invest and wait for a long time i.e. at least few years. This basically includes elements such as money flow statement, profit percentage, assets, debt, fund management etc.Technical Analysis can be used for both long and short-term investments. Technical analysis includes a lot of statistical indicators such as Bollinger bands, Moving Average Convergence Divergence (MACD), Relative Strength Index (RSI), Moving averages and a lot more. Every individual use different combinations of their desired technical indicators to filter the stocks that they want to invest. In most of existing system the analysis is based on data processing alone and Artificial neural networks which in turn again use the data.The most commonly used leading technical indicator is the Candle stick indicator. Most of the indicators use statistics to give information about the stock. The candle stick indicator gives the view on psychology of the large investors and Investment banks about that particular stock.In this research we are going to use a set of technical indicators to analysis.
Revised Manuscript Received on May 06, 2019
Ms.Rajyashree, Assistant professor, Computer science and engineering, Srm institute of science and technology, Tamilnadu, India
Pavan Balaji K, Student, Computer science and engineering, Srm institute of science and technology, Tamilnadu, India
Siddharth.S, Student, Computer science and engineering, Srm institute of science and technology,Tamilnadu , India
Vishvak.S.Athreiya, Student, Computer science and engineering, Srm institute of science and TechnologyTamilnadu , India
These technical Indicators are used to select the stocks in which the candle stick will be searched. Convolutional Neural Network will be used for image processing to find the candle stick pattern present in the select stocks.
II. RELATEDWORKS
In the past years, machine learning algorithms when applied to neural networks have given great results. The learning ability of these neural networks model has laid path to the success pattern recognition. Since late 1950s the Gradient-Based back propagation system is being used by many scientists but it was only used for linear models. It was an amazing discovery that these methods are of great use in complexmodels such Neural Networks. A practical pattern recognition system will be always composed of several modules. A Document recognition system which is composed of filed locator, used to extract regions of interest, a field segmenter which crops the images into images of characters and a post processor can be taken as an example. [1]
The Convolutional Neural Networks (CNN) is a type of Neural Network which that has given extraordinary performance on machine learning models. Vectors and Matrices are a well-known concept to everyone. Vectors are represented by X R D
where D is the column. Matrices are represented by X R M*N
where M is the no. of rows and N is the number of columns.
Tensors are higher order matrices of order three. It is represented by X R M*N*D
where M and N are rows and columns respectively. D represents the number of channels with matrices of order M*N. It is better to represent an image as a tensor. In archaic pattern recognition systems, the colored images will be converted into black and white images to store it in a matric format and the color information will be lost. The tensor is useful retain that information. For a Convolutional Neural Network, a tensor is an important thing since all the input, processing and resultant data will be in the form of tensors. [2]
The Convolutional Neural Networks learn the similarities between given input and training sets output. Nonlinear operations are needed in Convolutional Neural Networks because if nonlinearity is removed from consecutive two layers, then the resultant combination of those two layers will be equivalent to one linear layer which results in an additional layer of no use. In Convolutional Neural Networks the most commonly used three activation functions are sigmoid function, the rectified linear unit and the parameterized ReLU (PRelu). [3]
Parametric Rectified Linear Unit (PReLU) learns the important parameters of the rectifiers and improves the performance at an insignificant additional computing cost. This can be trained using back propagation method. [4]
The main aim of the Pooling Layers in Convolution Neural Networks is to achieve invariance in the feature Maps produced. [5]
The origin of the candle stick pattern dates back to 17th century Japan where is was used in Dojima rice exchange in Osaka under the feudal military dictatorship of Tokugawa Shogunate for 300 years. The Dojima rice exchange which started as a simple place to buy and sell rice soon became a regulated warehouse and started to handout receipts and established a market and this is where the first Future commodity contracts for born. Munehisa Homma, a merchant of that period believed that human emotions played an important role in the price fluctuations of the commodity and devised the candlesticks and tried to make use of the patterns and predict the future prices. [7]
III. TECHNICALINDICATORSUSED The technical indicators which are going to be used are Relative strength Index (RSI), Simple Moving Average (SMA), Moving Average Convergence Divergence (MACD), Volume Indicator.
A. Relative strength Index (RSI)
RSI is basically a momentum which indicate the overbought and oversold zone.it indicates the speed and change in the price movements of the stocks. this is used to find out the correct time to invest. It is measured in a scale of 0 to 100. Generally, above 70 is considered as overbought and below 30 is used as oversold. In this research we will be using above 60 as overbought and below 40 as oversold.
RSI = 100 - 100 / (1 + RS) (1)
Where RS = Average gain of up periods during the specified time frame / Average loss of down periods during the specified timeframe.
B. Simple Moving Average (SMA)
The simple moving averages are considered as support or resistances in which the stocks will / may reverse when they are in a particular trend. We will be using the following moving averages 50,100,200.
The stocks with prices within the + / - 5 % price range of these moving averages
The Moving average value will be calculated by taking the prices averages of a Particular time period.
If It is a fifty-day moving average (50 SMA) the average closing price of last fifty days is used to determine the value of the moving average. The Formula to calculate SMA is as follows.
SMA= (A1+A2+…+An)/n (2)
Where A= The price of an asset at period n and n= The number of total periods.
C. Moving Average Convergence Divergence (MACD) MACD is a trend following indicator which is used to decide whether the is going up or down. The MACD has three parameters Signal Line, MACD Line and A histogram.
The MACD line and the Signal Line is used to find the correct time to invest.
MACD Line = (12-day EMA - 26-day EMA)
Signal Line = 9-day EMA of MACD Line (3)
D. Volume
The volume is used to find if there is a significant change in volume which is a major factor for the change in price of the stock.
IV. SYSTEMARCHITECTURE
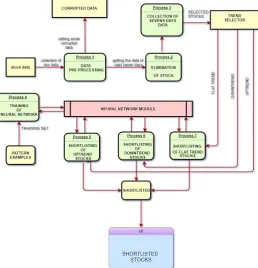
The Fig (4.1) shows the system architecture of our project.
As our project solely focuses on finding the pattern occurrences in the equity stocks listed in Financial Markets. We will collect the required data first. The data will be collected from yahoo finance using the quantmod function in R. The usage of this function will be discussed below in the aspects of the system. All the required data such as open, high, close, low, volume data will be collected using the quantmodfunction [9].
International Journal of Innovative Technology and Exploring Engineering (IJITEE) ISSN: 2278-3075, Volume-8 Issue-7, May, 2019
[image:3.595.34.293.136.405.2]Inthis project we use different convolutional neural networks which will be trained in different patterns. This reduces the computational time while searching for patterns.The stocks in which there is a presence of pattern is reviewed and then the stocks are listed in UI i.e. a webpage or similar entities.
Fig 4.1 System Architecture
V. ASPECTSOFTHESYSTEM A. DATA PREPROCESSING
The data that is required is collected using the Rpackages Quantmod(Quantitative Financial Modelling Framework)and Technical trading rules (TTR)
1) Quantmod:
Quantmod is a special package in R that is dedicated to Financial analysis of the stock market. There are lot of useful functions in this package such as getting the end-of-day of the stocks listed is almost every financial market around the world. It can also be used to add several indicators to the candlestick chart by the candleChart () function.We will be using the getsymbolfunction to get the end of day data of all the stocks. This data will contain the open, high, low, close, volume and adjusted volume values. The open, high, low, close price will be used to form the candlestick chart.
The close price of the stocks will be used to find the trend. This will be discussed below.
2) Technical trading rules (TTR):
The TTR package is a package which enhances the functionality of the quantmod package. This package was developed by the same team.
We will be using this package to get the values of RSI indicator, MACD indicator and Moving Averages 50,100,200.
Thedata that was obtained using these functions and packages is then passed to the elimination of the stocks phase where the stocks are eliminated on the basis of the indicators.
B. ELIMINATION OF STOCKS
The data which was collected in the previous phase is passed to this phase. In this phase the values of the technical indicator such as RSI, MACD and Moving Averages 50, 100, or 200 days.
The following are the constraints that has to be satisfied by the values of the indicators.
1) RSI constraint:
In this project, the ideal value of the RSI that is optimum for investing is when it is crossing 60 from.
In stock markets the Future and option contracts can be shorted.The ideal RSI value for shorting is when it crosses 40 from above.
The value of the RSI should be + or – 2 % from the ideal levels.
The investing should not be done when the stock is hovering between these two levels.
2) MACD Constraint:
In Moving average Convergence Divergence, the ideal time to invest i.e. buy the stock, is when the signal line crosses the MACD line from below and vice versa for shorting. This can be found out by taking the value of the MACD line and the signal line and compare the difference between these two values.
If the value of the signalline > MACD line and is within 2% range of the MACD line then it indicates that the signal line has crossed the MACD line and if this is done in the opposite way then it can used to short.
3) Moving Averages Constraint:
IF CLOSE [-1] < VALUE OF SMA
IF CLOSE [0] > VALUE OF SMA
The above algorithm indicates that the price was Below the moving average price and it was breached the next day.
4) Volume constraint:
The present day volume should be significant greater than the previous day.All these constraints must be satisfied in order for the stock symbol to move to the next phase.
C. COLLECTION OF DATA OF LAST SEVEN DAYS
The data of the last seven open market days will be subset from the original data. This data is passed to the trend selector module in order to assign the trends for the particular stock.
D. TREND SELECTION
This is the part of the system where the trend of each stock is decided. The trend is assigned to the stock symbols because it makes it to search the pattern.
There are three different types in trend
Uptrend
Downtrend
Sideways (Flat trend)
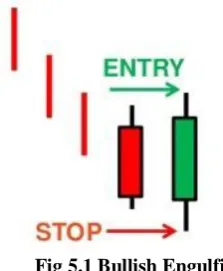
[image:4.595.341.546.458.586.2]There are a lot of types of patterns. Not all the patterns will have a big impact when they occur. There are different types of patterns which arise in a particular trend and is only useful is that trend. For example,
Fig 5.1 Bullish Engulfing
The fig (5.1) mentioned is a bullish engulfing pattern. This pattern is effective only when it occurs in a downtrend. This is because this is a trend reversal pattern. The above pattern indicates that the downtrend has stopped and the stock price is going to go up.
If the stock is already in uptrend this has no significance and hence we will avoid searching for unnecessary patterns in unwanted trends.So,we only search for the patterns that matter in that particular trend. The algorithm for the trend selections in given below.
FOR DOWNTREND THE ALOGORITHM IS
IF CLOSE [0] < CLOSE [-1] AND CLOSE [-1] < CLOSE [-2] AND CLOSE [-2] < CLOSE [-3]
FOR UPTREND THE ALGORITHM IS
IF CLOSE [0] > CLOSE [-1] AND CLOSE [-1] > CLOSE [-2] AND CLOSE [-2] > CLOSE [-3]
The above algorithm is shown for only three values for understanding. The stocks that doesn’t belong to these both trends are classified as sideways (Flat Trend).
The stocks with their trends are separated and stored in different datasets for further processing.
E. Convolutional Neural Networks (Pattern recognition)
The Convolutional Neural Networks are nothing but Artificial Neural Networks (ANN) with the convolution process applied before the ANNis introduced. The Convolutional Neural Networks are one of the best complex models present for Image recognition.
We are going to use the Convolutional Neural Networks for pattern recognition.
The working of the Convolutional Neural Networks consists of five steps.
1) Convolution:
A convolution is basically combined integration of two functions and it how how one function modifies other or shapes other. The convolution function is
Fig 5.2 Convolution Theorem
The fig (5.2) shows the mathematical function of the Convolution theorem.
[image:4.595.98.210.462.598.2]International Journal of Innovative Technology and Exploring Engineering (IJITEE) ISSN: 2278-3075, Volume-8 Issue-7, May, 2019
Fig 5.3 Convolution Process
The fig (5.3) shows the process of convolution applied to an input image. The image is basically stored in matrices or tensor based on whether its B/W image or color. In the above process the value in the feature detector will be directly multiplied with the input image and the total value will be stored. The process will be continued by striding through the input image and a feature Map will be produced. The process will be repeated for all the possible features detectors. All the feature maps will be stored.
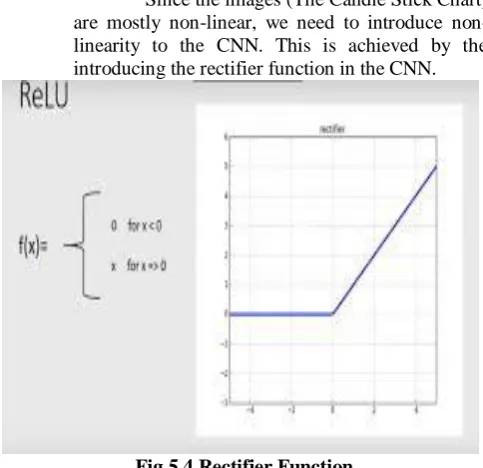
2) Rectified Linear Unit (ReLU):
[image:5.595.60.279.59.155.2]Since the images (The Candle Stick Chart) are mostly linear, we need to introduce non-linearity to the CNN. This is achieved by the introducing the rectifier function in the CNN.
Fig 5.4 Rectifier Function
The fig (5.4) shows the graphical representation of the Rectifier function. The introduction of non-linearity will increase the efficiency of image processing.
3) Pooling:
[image:5.595.46.288.323.557.2]Different images of the same pattern can have different features. The CNN should be able find out the pattern in the image. The Pooling operation will enable this in a CNN. There are different types of pooling MAX Pooling, Sum Pooling and Mean Pooling. We will be using MAX pooling function in this project.
Fig 5.5 Pooling Process
The pooling function is applied to the feature map. Usually when we use a pooling function we take a 2x2 matrix and stride through the feature map. In max pooling the maximum value in the striding matrix is used to construct the pooled features map.
In the pooling process the important feature are retained however the features are placed. Dimension reduction is also a important purpose of pooling function. The pooling function will be applied to all such feature maps and the pooled feature maps will be formed. These feature maps will be sent for further processing in the next level.
4) Flattening:
Since the Neural network module accepts the input in form of vectors, the pooled feature maps which are in the form of matrices are transformed into vectors. This is process is known as flattening.
Fig 5.6 Flattening Process
The rows of the matrices are taken one by one and stored in a vector.
This vector is then inputted to the Neural Network. 5) Full connection:
[image:5.595.307.545.429.596.2]Fig 5.7 Fully Connected Neural Network
The fig (5.7) shows a fully connected neural network with two outputs.
Once the image is inputted, it will undergo all these processes Before it reaches a conclusion. The candlestick charts will be plotted using the candleChart () function in quantmod. These images are then sent into the neural network modules.
The Python language is used to implement the Neural Networks. The packages Theano,Keras and Tensorflow is used to implement the CNN. These packages have dedicated functions for image processing and initializing neural networks.
The functions such as sequential() in Keras is used to start a neural network. Adding models to the CNN is as simple as usinthe .add ( ) function. The ReLU are added through this function. The convolution layer can be implemented using the Convolution2D layer. It also contains MaxPooling2D ,Dense and Flatten layers which are used to implement the CNN.
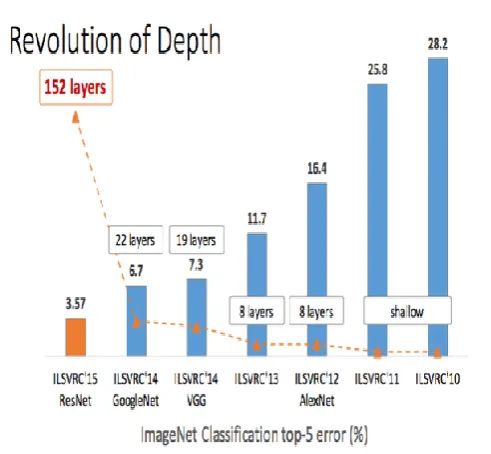
F. Residual Neural Networks
A Residual neural network (ResNet) is an artificial neural network (ANN) which basically consists of multiple subsequent residual modules, which are the basic building block of ResNet architecture. A residual module can perform either of two operations, it can perform a set of functions on the input or it will skip this step altogether. these residual modules are stacked or placed one on top of the other to form a complete end-to-end network.A residual neural network (ResNet) is a synthetic neural networkof a
sort that builds on
constructs noted from pyramidical cells within the cerebral cortex. Residual neural networks do that by utilizing skip connections, or short-cuts to leap over some layers. Typical ResNet models are enforced with single-layer skips. a further weight matrix is also wont to learn the skip weights; these models are called HighwayNets.Models with many parallel skips are cited as DenseNets. within the context of residual neural networks, a non-residual network is also delineate as a comprehensiblenetwork. One motivation for skipping over layers is to avoid the matter of vanishing gradients, by reusing activations from a previous layer till the adjacent layer learns its weights. throughout coaching, the weights adapt to mute the upstream layer, and amplify the previously-skipped layer. within the simplest case, solely the weights for the
[image:6.595.304.550.131.358.2]adjacent layer's affiliation are custom-made, with no express weights for the upstream layer. This works best once one non-linear layer is stepped over, or once the intermediate layers are all linear. If not, then an exact weight matrix ought to be learned for the skipped affiliation(a HighwayNet should be used).
Fig 5.8 Comparison Of Deep Networks
VI. CONCLUSION
The above project is primarily created for normal people who want to earn big in the stock markets. The candle stick patterns will be found automatically in all the scripts in which they are present and only in the right trend where they are useful. This will eliminate the most important and tedious process in stock market investing and trading i.e. scanning through different scripts and charts in order to find the right script to invest.If this is manually done by a human it is not possible to scan through all the scripts. Since we are eliminating the scripts based on technical indicators such as RSI, MACD, Moving Averages and volume unwanted and penny stocks will be avoided.Since it is image processing which is similar to humans seeing and recognizing something it will be more efficient than just data processing.
Since CNNs use feature maps which is a technological replication of the ones present in the neuroscience.Thusthis project makes lives easier for someone who want to invest and make profits ins financial markets. In future this can also be modified to trade on its own calculating the risk of that particular.
REFERENCES
1. Gradient-Based Learning Applied to Document Recognition by Yann LeCun et al. (1998)
2. Introduction to Convolutional Neural Networks byJianxin Wu (2017). 3. Understanding Convolutional Neural Networks with A Mathematical
International Journal of Innovative Technology and Exploring Engineering (IJITEE) ISSN: 2278-3075, Volume-8 Issue-7, May, 2019
4. Delvin Deep Into Rectifiers: Surpassing Human-Level Performance on ImageNet Classification By Kaiming He et al. (2015)
5. Evaluation Of Pooling Operations in Convolutional Architecture for Object Recognition By Dominik Scherer et al. (2010)
6. The 9 Deep Learning Papers You Need To Know About (Understanding CNNs Part 3) by Adit Deshpande (2016)
7. Information Conveyed By Japanese Candlestick Chart Patterns.: An Apparent Anomaly In The Weak Form Of The Efficient Market Hypothesis By Pan G. Yatrakis And Albert A. Williams
8. Understanding Price Behavior By Using Candlestick Charts - A Study On Select Equities
9. Quantmod (Quantitative Financial Modelling Framework) packagedocumentation by CRANA Authors Jeffrey A. Ryan , Joshua M. Ulrich, WouterThielen, Paul Teetor, Steve Bronder
10. https://cran.rproject.org/web/packages/quantmod/quantmod.pdf
11. TTR(Technical Trading Rules) package documentation by CRAN Author Joshua Ulrich
12. https://cran.r-project.org/web/packages/TTR/TTR.pdf 13. “Japanese Candlestick Charting Techniques” by Steve Nison
14. Deep Learning with PythonBook by François Chollet
15. Keras Documentation. 16. https://keras.io/
17. Tensorflow documentation
18. https://www.tensorflow.org/api_docs/python/
AUTHORSPROFILE
Ms.Rajyashree Assistant professor
Computer science and engineering Srm institute of science and technology
Tamilnadu, India
Pavan Balaji K Student
Computer science and engineering Srm institute of science and technology
Tamilnadu, India
Siddharth.S Student
Computer science and engineering Srm institute of science and technology
Tamilnadu , India
Vishvak.S.Athreiya Student