International Journal of Innovative Technology and Exploring Engineering (IJITEE) ISSN: 2278-3075, Volume-8 Issue-6S, April 2019
ABSTRACT Management of anesthesia is significant for both surgery and intensive care. The intravenous anesthetics are widely used to provide steady maintenance and speed recovery compared with inhaled anesthetics. The current work analyses the technique to describe the effects of anesthetic drug Propofol in the introduction of hypnosis on a patient during surgery procedure. The model is developed by considering the regular three-compartmental pharmacokinetics/pharmacodynamics Wiener model and conventional controller for adjustment of Depth of hypnosis through Bispectral Index scale (BIS) value. It provides a reliable and safe methodology for infusing anesthesia using closed loop control technology and analysis of human electroencephalogram (EEG) to measure the depth of anesthesia in patients. Two patient sets of datasets are considered during this procedure. The outcomes obtained for different patients show that the standard model fits the data with the developed Simulink based model. The paper designs the plasma concentration 3-compartmental model using PID controller to control the depth of hypnosis and infusion rate during surgery through the reference value BIS of patient. Because of simplicity and robustness of PID controller, it is widely used for industrial plants. The developed model is compared with sliding mode controller. The results shows the transient control system characteristics of delay time, rise time, peak time, maximum overshoot and settling time.
Keywords: Bispectral Index scale(BIS),
Pharmacokinetics/pharmacodynamics (PK-PD), Depth of Hypnosis (DOH), PID Controller, Total Intravenous Anesthesia, Sliding Mode Control(SMC),Target Controlled Infusion(TCI).
I. INTRODUCTION
Anesthesia is a reversible (Ioana Nascu et al., 2015) unconsciousness level of a patient, it guarantees patient’s hypnosis, and muscle relaxation. It is often plays role in surgery and in the intensive care unit (ICU). It blocks the pain of surgery; hypnotics produce unconsciousness, while muscle relaxants prevent unwanted movement of muscle tone. Maintaining safe and protective surgery for patients while monitoring the vital signs of a patient is very complex task for anesthetist. As part of anesthetist he\she could estimate the drug outcome in the patient’s body and measure the corresponding drug infusion rates, based on vital parameters during surgery period. The approaches may not always be harmless for the patient since they will not include any measured variable feedback control scheme and even the desired level of sedation is reached. The consequences will result the adverse events to patients. Even for more stress situations, the surgeon has to deal with routine assessments and simultaneously solve complex problems immediately. The automation of some routine actions of the anesthetist can reduce the workload and consequently increase the safety of the patient. The current
Revised Manuscript Received on April 15, 2019.
Usharani Shola, VIT, Chennai Campus, Tamil Nadu, India
clinical study was designed to evaluate our Propofol–BIS closed-loop system during induction, maintenance, and emergence from anesthesia and to compare it with manual control. In particular, we expected that our closed-loop system would reduce time spent with BIS values outside predetermined limits and would enable faster recovery times without increasing the incidence of adverse events. (Ngai Liu et al, 2006).
II. BACKGROUND
Sometimes physician will sit through the entire surgery to control the analgesia level of the drug. In some scenarios automatic delivery system of drugs will be used to control the drug rates into the patients. Based on these strategies there are two ways to infuse drug level to the patients.
• Manual control
• Target controlled infusions
Manual Control
In general the delivery of anesthetic drugs is controlled by anesthetists during surgery. This is known as manual control of drug delivery. First based on the patient weight, age and the surgical operation the appropriate drug, dosage levels are selected and started the procedure. Next the patient vital parameters are monitored through equipment in the operating room. These parameters warn the anesthesiologist about patient safety in unexpected situations. Lastly the anesthesiologist handles the patient’s abnormality based on his/her experience. But in anesthetic delivery are not appropriate, cause severe consequences during and after a surgery. If enough drug level is delivered the patient remain unconsciousness during surgery and supports smooth surgery procedures. If too much drug or overdose is given causes breath problems can result in Respiratory depression and then to cardiac block. Both the under dosing and overdosing delivery of medicine is not acceptable throughout the surgery towards patient, safety and health. A review was revealed that human factors contributing 82% incidents for 359 incidents of reports (Rajkumar C., & Kalindi A D., 2014),Human errors in anesthesia]. So, human error may cause excess drug or dangerous events of life threatening to the patients.
In Manual delivery control may cause many problems like, overdosing, underdoing and several clinical problems like equipment malfunctioning. In under-dosing level of anesthetic drug causes to some patient conscious ness and vomiting, while overdosing causes cardiovascular collapse.
Control of Anesthesia Concentration Using PID
Controller
These complications in anesthesia administration create a big room for control engineering community to introduce automation in anesthesia. This paper proposes a complete review of clinical evaluation of Propofol anesthesia administration employing modern control strategies.
The Depth of hypnosis measures the brain activity, the BIS is always considered for this. Normally in manual regulation of Propofol infusion the anesthesiologist uses this index and based on his/her experience recommends the doses of drug levels. This level of experience is automated by adding control system to the drug management system. The next part will discuss about the automatic drug delivery system through infusion pumps.
Target Controlled Infusion (TCI)
The main goal of anesthesia infusion pump is to infuse painless surgery by maintaining the unconsciousness level to the required hypnosis. This even should avoid the complications to consider while infusing. The goal can be met by bringing new surgical procedures of modern medicine. Propofol is very frequently considered drug for surgeries due to its less side effects.( Ilyas M et al, 2017)
In order to increase the safety of patient, automatic or semi-automatic drug infusion could be developed. Generally TCI is used for drug administration to control the drug appropriate drug levels to the patient. This is an open-loop control system (Merigo L et.al, 2017), it controls the level of drug based on patient’s demographics’ data. But TCI has issues of robustness. Thus from literature survey (UshaRani ., & Neelanarayana V, 2017) suggests closed loop control system can be used, that includes BIS level as a feedback parameter , BIS value is used to automatically regulate the Propofol infusion and improves the control of Depth of Hypnosis and clinical practices. TCI uses patient model to automatically adjusting the drug profile to the patient. While closed loop control system is used to integrate the depth of hypnosis control through controller.
The patient model traditionally used for automatic drug delivery system is PK-PD model that describes the relationship between Propofol infusion and drug effect for brain activity. From PK-PD, PK calculates the infusion, distribution and elimination (Khanday M.A & Nazir K, 2016) of drugs in the human body and target pharmacodynamics part. The PD relates the plasma concentration from body to the target site concentration. Basically, it is a nonlinear function which is represented by Hill function ( Merigo L et.al, 2017) and provides the relationship between the concertation level at effect site level and to the clinically measured BIS value. The PK-PD three compartmental models from different set [Usha rani shola, 2018] is proposed by Schinder is considered. Since this model relates all mass transfer rates, clearances, volume rates based on patient age, weight and height which is nearer to the realistic data.
III. LITERATURE SURVEY
In Intensive care unit (ICU) to avoid the awareness of the patient pain anesthesiologists will provide analgesic during surgery. There are three different stages of anesthesia: Induction, Maintenance and emergence phase
• Induction phase: it is the introduction phase of the surgery. In this stage the patient goes from conscious state to anesthetic state. This stage will be maintained from 20 to 30 seconds but the anesthetic takes few more seconds until to reach the desired level of unconsciousness. Here the anesthesiologist injects the painkiller continuously to reach the desired levels. • Maintenance phase: once the first phase is done, now
the patient is ready for surgical procedure. So surgery will be performed on patients during this phase. During this surgical procedure some patient’s DOH level may change and brings awareness. The level can be bringing back by using healthy controllers in an automatic system of drug delivery. The controller is very robust in such a way that it can consider inter patient variance i.e. among different patients.
• Emergency Phase: Once surgery is very close to over i.e. at the skin closure this phase starts. During this phase no need to maintain the level of unconsciousness. After some hours or few minutes of surgery the patient back from unconsciousness. So no need to maintain the drug levels during this procedure to control the consciousness of patient. So basically here the automation of DOH level is required to maintain during maintain phase. The induction phase is take care by anesthetist. The induction phase needs to be controlled automatically through robust control. Finally the emergency phase does not need to any anesthetic drug. So we chose the controller in such that it awakes the patient to recover from the emergency phase as early as possible. In clinical practices usually the drug administration involves bolus of Propofol followed by constant infusion rate. The bolus is the initial administration of drug to introduce induction phase to the patient then followed to maintain phase to automatically adjusting the drug level to constant concentrations based on the BIS level for surgical procedures.
Closed Loop Controlled Anesthesia & Existing System
Automatic control of drug delivery needs to be established to provide significant control of drug delivery of anesthesiology biomedical field. This model uses different closed loop controller design with variance of patient characteristics like in patient variability and intra patient variability. The model consists of PK-PD model that shows the drug distribution in the body based on metabolism of patient. The main part of anesthesia is maintaining depth of hypnosis (DOH) at brain. It is an activity of consciousness and monitored through Bispectral Index scale (BIS). The normal consciousness state of BIS is 100 or near to it. Standard range for BIS is 40 to 60 for general surgery. The PK-PD provides the concentration level at target organ for example, Brain. This concentration can be used to get the BIS value by using nonlinear sigmoid model (Ilyas M et al., 2017)
International Journal of Innovative Technology and Exploring Engineering (IJITEE) ISSN: 2278-3075, Volume-8 Issue-6S, April 2019
During surgery the patient need to be administrated to drugs to maintain the adequate hypnotic state. Then the patient will not feel pain sensitivity and cooperates in the entire surgical procedure. As Propofol is less side effects than others, Propofol is generally considered for anesthetic drugs during surgery. The hypnotic state is the cortical activity of the brain. This cortical activity is represented as Electroencephalograph (EEG) of the patient. Different algorithms can be used to extract the information from EEG. One of the methods used to analyze this one using Bispectral Index scale. The BIS values for different activities during surgery are given in table 1(Ilyas M et al, 2017). The BIS parameter varies from 0 to 100. During awake state or very active the patient carries the BIS value as 100. BIS=0 is no action in cerebral cortex or as no consciousness.
Table 1. BIS Scale ranges
BIS State BIS Signal range
Awake State 100-90
Light hypnotic state 60-below 80
Moderate hypnotic
state(surgical procedure state)
40-below 60
Start of deep hypnotic state 20-below 40 Breathe suppression state Below 20
So during induction procedure, the physician injects the drug to patient to bring down it from 100 to 40. In maintenance phase (having hypnotic levels from 40-60), the patient need to maintain this level through automatically adjusting the controller of the drug delivery pump or equipment.
IV. PROPOSED MODEL PK-PD compartmental model description
The depth of hypnosis during Propofol infusion is generally demonstrated by means of PK-PD Wiener model. In this model a static nonlinear function (BIS function) is cascaded with a linear (PK) three compartmental model. The 3-ompartmental model is inter-connected with three different compartments as organs of the body. Compartmental model is considered for analyzing the target site compartments and other compartments characteristics of the patient. This model involves mass flux exchange of drug between three compartments and it roots the following equations (UshaRani S., & Neela Narayan V, 2018).
Where Xi(t) [mg] is the amount of the drug w.r.t the time
for each compartment. X1(t) states to main blood
compartment, X2(t), X3(t) states to the peripheral fast
compartment like muscles, slow dynamics compartment like fat respectively. Is is the infusion rate of the drug of the
model in [mg/min]. Kij parameter for i != j represents the
drug constant rate from compartment i to compartment j. the drug constant rates, clearance and elimination rates of three
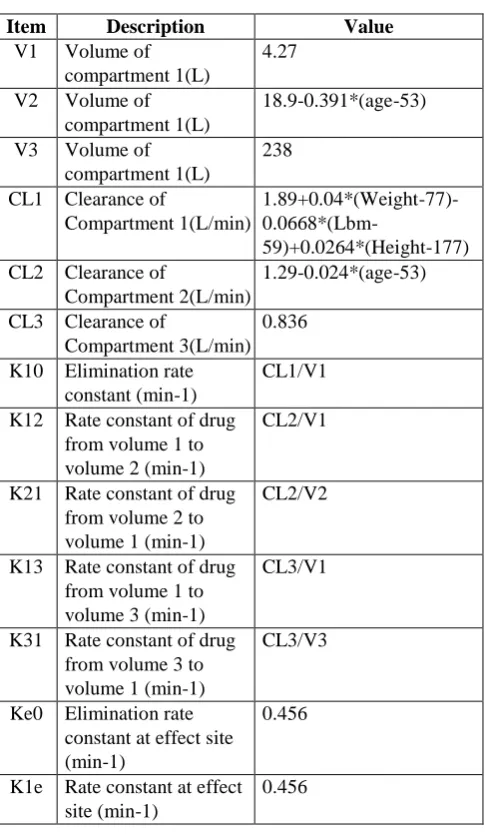
[image:3.595.307.550.102.520.2]compartmental model are related with the following equations from (Thomas Schinder, et al., 1988; Ilyas M et al., 2017; Merigo L et.al, 2017;D Naidoo 2011):
Table 2. Parameters for PK-PD
Item Description Value
V1 Volume of compartment 1(L)
4.27
V2 Volume of compartment 1(L)
18.9-0.391*(age-53)
V3 Volume of compartment 1(L)
238
CL1 Clearance of
Compartment 1(L/min)
1.89+0.04*(Weight-77)-
0.0668*(Lbm-59)+0.0264*(Height-177) CL2 Clearance of
Compartment 2(L/min)
1.29-0.024*(age-53)
CL3 Clearance of
Compartment 3(L/min) 0.836
K10 Elimination rate constant (min-1)
CL1/V1
K12 Rate constant of drug from volume 1 to volume 2 (min-1)
CL2/V1
K21 Rate constant of drug from volume 2 to volume 1 (min-1)
CL2/V2
K13 Rate constant of drug from volume 1 to volume 3 (min-1)
CL3/V1
K31 Rate constant of drug from volume 3 to volume 1 (min-1)
CL3/V3
Ke0 Elimination rate constant at effect site (min-1)
0.456
K1e Rate constant at effect site (min-1)
0.456
The lbm is the lean body mass which is given by the following relations:
(4)
(5)
From the above the Wt, Ht and age are the weight, height and age of a patient. Based on the Gender the corresponding LBM will be computed and is substituted in the above equations.
The plasma concentration of the primary or main compartment is given as
C1(t) = X1(t)/V1. (6)
This output of primary plasma concentration is used to calculate the effective site concertation represented as first order differential equation
(7)
Ce(t) = 0.1068X1(t)-0.456Ce(t) (8)
Finally the nonlinear Hill function (Yoshitomo Sakuma et al., 2008, D.J Eleveld., 2018) the effect drug concentration Ce(t) related to BIS as
(9)
Where, E0 represents the initial BIS value of patient
without or before the drug infusion i.e. at Ce(t) =0
Ce50 is the effective site concentration when the drug
effect is 50%.
f is the steepness of BIS with respect to effective site concentration.
Emax Maximum effective site concentration.
The 3-compartmental model of patient represents the dynamic behavior of plasma concentration of body. PID controllers are used for this model to regulate the dynamic behavior of plasma and they provide good closed-response response characteristics (Aditya et al , 2013). The Simulink PID controlled Propofol Anesthesia model is shown in the Figure 1. As shown here the referenced BIS value given as a step input with initial value as 60 and final value should be maintained as 45 (BIS value to be considered during surgery) after 30 seconds of time.
Figure 1. Proposed PID Controller Model for PK-PD. The error between the referenced BIS value (BISref ) and
the value actually measured ( BISact ) from the PKPD model
is calculated. The output of error (e (t)) is given as input to PID controller. The error is controlled through PID controller and the resultant (u (t)) value is given as the input to the patient model. The PID equation evaluated based on the error e(t) is given below.
(10)
Where e(t) = BISref-BISact. (11)
Based on this error the adjusted value of drug input will be given as required drug rate to the patient model. From the plant model by using PK and PD equations discussed above calculates the BIS actually measured. This actually measured BIS value acts as closed loop feedback to the control system.
V. RESULTS & DISCUSSION
The 3-compartmental PK model for plasma
characteristics and effective site compartment for BIS is given in Figure 2. From the model the concentration at each compartment is calculated using Schinder model is discussed above .The characteristics of the model is verified for two patients data (Mohamed, 2017). The patient data their PK values and PD parameters are calculated by substituting the patient details into the above discussed equations. The resultant flow rate constants are obtained and shown in Table3 and table 4.
Figure 2. PK-PD Model Table 3. Patient Details Table
Details Patient-I Patient-II
Age 28 40
Height 164 163
Weight 60 54
Gender Male Female
E0 94.7 98.8
Emax 85.3 94.1
F 2.46 2.24
Ce50 4.96 6.33
Table 4. Kinetics of each patient based on Table 3 Details of Kinetics Patient-I Patient-II
K10 0.476 0.423
K12 0.375 0.443
K21 0.066 0.066
K13 0.196 0.196
K31 0.004 0.004
These values are used during the simulation plant models and both the results are shown at Figure 3 and Figure 4. For both the patients same step input with 2ml/sec is considered and both the results show the same characteristics.
Figure 3. Each Compartment Characteristics for Patient-I
Figure 4. Each compartment characteristics for patient-II
Tuning PID Parameters
International Journal of Innovative Technology and Exploring Engineering (IJITEE) ISSN: 2278-3075, Volume-8 Issue-6S, April 2019
between reference BIS value and measured base value. As it is getting increased the steady state error slowly reduced. But it never settled down, and then integral constant is added it reduces the error almost zero, but the PI effects overshoots and damping to the controlled BIS variable. Then last constant of PID, Kd is added , this reduces the
damping and introduces the smooth operation in controlling the BIS values through drug infusion rate . Final values are taken for the system as Kp = 1; Ki = 1; Kd =1.
The transient response of characteristics of a control system (A Nagoor Kani, chapter 3)of any input system is specified with the following specifications
• Delay time: it is time taken by the response to reach 50% of the final value during first time.
• Rise time: the time taken to reach 100% of the final or reference value of the response for the first time. • Peak time: it is time taken to reach the first peak
value of the response for the first time.
• Maximum overshoot: the ratio of maximum peak to the final value of the response. It is equivalent to the maximum value minus the reference value divided by the reference value.
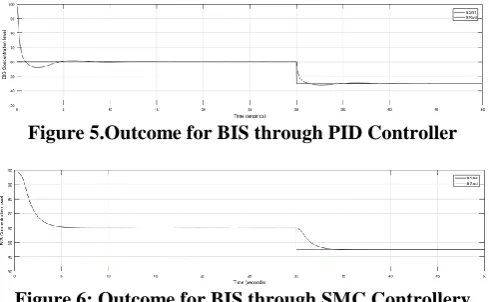
[image:5.595.47.292.484.635.2]• Settling time : it is the time taken by the response to reach the error within the specified limit value i.e allowable tolerance of error is in between 2% or 5% The designed conventional PID model for 3- compartmental PK and with PD model characteristics is checked against with the Sliding mode controller mode. Figure 5 and Figure 6 represented the Simulink model outcomes of PK-PD with respect to conventional PID controller and SMC controller respectively. From the figure the controller characteristics are analyzed and listed in Table 6. From the table it is given that conventional controller will reduces the delay time and rise time where no effect of peaks for the SMC based controller system.
Figure 5.Outcome for BIS through PID Controller
[image:5.595.47.292.676.765.2]Figure 6: Outcome for BIS through SMC Controllery Table 6: Comparison of PID controller with SMC
controller Controller Delay
Time(Sec) Rise Time(Sec)
Peak time (Sec)
Maximum Overshoot
Setting Time (Sec)
PID 0.25 0.5 2.5 0.083 4
SMC 1.5 5 --- ---- 4
VI. CONCLUSION
In previous work the patient model is checked with
based on patient parameters. From the set Schinder data parameter set produces the drug flow constants through calculations based on patient parameters. Finally the anesthesia drug controller for BIS is designed with PID and is compared with SMC. Even though few characteristics improve the performance of SMC, due to the simplicity the PID controller is also suggestable for achieving the required goal of controlling the BIS for Anesthetic drugs during surgery.
This research received no specific grant from any funding agency in the public, commercial, or not-for-profit sectors.
REFERENCES
1. A Nagoor Kani, Control Systems Engineering, RBA Pulblications, third edition.
2. Aditya Pratap Singh., Udit Narayan., & Akash Verma (2013). Speed Control of DC Motor using PID Controller Based on Matlab. Innovative Systems Design and Engineering,4(6);22-28.
3. Ngai Liu, M.D., Thierry Chazot., Antoine Genty., Alain Landais., Aymeric Restoux., Kathleen McGee., Pierre-Antoine Laloe., Bernard Trillat., Luc Barvais., Marc Fischler(2006). Maintenance Guided by the Bispectral Index: Closed-loop versus Manual Control, American Society of Anesthesiology 2006; 104:686–95
4. Ilyas, M., Butt M. F. U., Bilal M., Mahmood K., Khaqan A., & Riaz, R. A. (2017). A Review of Modern Control Strategies for Clinical Evaluation of Propofol Anesthesia Administration Employing Hypnosis Level Regulation. Biomed Research International, 2017, Article ID 7432310, 12 Pages, Hindawi.
5. Ioana Nascu., Alexandra Krieger., Clara Mihaela Ionescu., and Efstratios N. Pistikopoulos (2015). Advanced Model-Based Control Studies for the Induction and Maintenance of Intravenous Anaesthesia, IEEE transactions on biomedical engineering, VOL. 62, NO. 3,(832-841).
6. Khanday, M. A., Rafiq, A., & Nazir, K. (2016). Mathematical models for drug diffusion through the compartments of blood and tissue. Alexandria Journal of Medicine, 53(3): 245-249.
7. Merigo, L., Padula, F., Latronico, L., Mendonca, T., Paltenghi, M., Rocha, P., & Visioli, A. (2017). On the Identification of the Propofol PK/PD Model Using BIS Measurements. IFAC-PapersOnLine, 50(1):868-873.
8. Rajkumar C., & Kalindi A D (2014). Human factors in anesthetic crisis, World Journal of Anesthesiology 27; 3(3): 203-212
9. Thomas W.Schinder., Charles F.Minto., L.Gambus., Cornia Andersen., David B.Goodale, Steven L Shafer., & Elizabeth J. Youngs (1988). The Influence of Method of administration and Covariates on the Pharmacokinetics of Propofol in Adult Volunteers., American Society of Anesthesiologist,88:1170-82.
10.UshaRani, S., & Neela Narayanan, V., . (2017). A review on patient-controlled analgesia infusion system. Asian Journal of Pharmaceutical and Clinical Research, 117-121.
11.UshaRani, S., & Neela Narayanan, V., . (2018)., Comparative Study of 4-Compartmental PK-PD Model with Effective Site Compartment for Different Parameter Set. IJRQEH,Volume 8,Issue 1 Article 5. 12.Yoshitomo Sakuma., Keiko Sameshima., and Ryuji Kohno(2017). An