White Rose Research Online URL for this paper:
http://eprints.whiterose.ac.uk/141545/
Version: Published Version
Article:
Fogg, Paul Christopher Michael orcid.org/0000-0001-5324-4293 (2019) Identification and
characterization of a direct activator of a gene transfer agent. Nature Communications.
595. p. 595. ISSN 2041-1723
https://doi.org/10.1038/s41467-019-08526-1
[email protected]
https://eprints.whiterose.ac.uk/
Reuse
This article is distributed under the terms of the Creative Commons Attribution (CC BY) licence. This licence
allows you to distribute, remix, tweak, and build upon the work, even commercially, as long as you credit the
authors for the original work. More information and the full terms of the licence here:
https://creativecommons.org/licenses/
Takedown
If you consider content in White Rose Research Online to be in breach of UK law, please notify us by
ARTICLE
Identi
fi
cation and characterization of a direct
activator of a gene transfer agent
Paul C.M. Fogg
1
Gene transfer agents (GTAs) are thought to be ancient bacteriophages that have been
co-opted into serving their host and can now transfer any gene between bacteria.
Production of GTAs is controlled by several global regulators through unclear mechanisms.
In
Rhodobacter capsulatus
, gene
rcc01865
encodes a putative regulatory protein that is
essential for GTA production. Here, I show that
rcc01865
(hereafter
gafA
) encodes a
transcriptional regulator that binds to the GTA promoter to initiate production of structural
and DNA packaging components. Expression of
gafA
is in turn controlled by the pleiotropic
regulator protein CtrA and the quorum-sensing regulator GtaR. GafA and CtrA work
together to promote GTA maturation and eventual release through cell lysis. Identi
fi
cation
of GafA as a direct GTA regulator allows the
fi
rst integrated regulatory model to be proposed
and paves the way for discovery of GTAs in other species that possess
gafA
homologues.
https://doi.org/10.1038/s41467-019-08526-1
OPEN
1Biology Department, University of York, Wentworth Way, York YO10 5DD, UK. Correspondence and requests for materials should be addressed to
P.C.M.F. (email:[email protected])
123456789
R
apid bacterial evolution is a fundamental process that
allows bacteria to adapt to changes in their environment
and to explore new environmental niches. The primary
mechanisms for the rapid spread of genes are known collectively
as Horizontal Gene Transfer (HGT). In contrast to hereditary
transfer, HGT allows genes to be passed directly between
indi-vidual bacteria at a much faster rate
1,2. The genes being
trans-ferred may improve
fi
tness or resilience but can also lead to
antimicrobial resistance (AMR) or increased virulence.
Traditionally, bacterial HGT consists of three broad
mechan-isms of genetic exchange
–
conjugation, transformation and
transduction. Transduction by bacteriophages is generally
accepted to be the most in
fl
uential mechanism for the exchange
of genes between bacteria, in particular, the generalized
trans-ducing (GT) phages and the recently described lateral transtrans-ducing
(LT) phages play a crucial role
3. During phage replication, host
bacterial DNA is packaged into a signi
fi
cant proportion of phage
particles instead of the phage genome; the host DNA can be
randomly selected (GT phages) or it can be from a large
hyper-mobile region (LT phages). The packaged host DNA is then
protected by the phage capsid and delivered to a new host cell,
where it can be integrated into the target genome by homologous
recombination.
Gene transfer agents (GTAs) are an unusual method of HGT,
which appears to be a hybrid of bacteriophage transduction and
natural transformation
4. First discovered in the 1970s, GTAs are
small virus-like particles that transfer random fragments of the
entire genome of their bacterial host between cells
5. Unlike the
transducing phages, whose primary aim is still self-preservation,
GTAs have no preference for the spread of their own genes and
their survival is entirely dependent upon their hosts
’
wellbeing
6,7.
It is the complete lack of DNA selectivity that makes GTAs
particularly intriguing and raises important questions about their
impact on HGT, bacterial evolution and the selective pressures
that allow them to persist
8.
A rough estimate of the number of viruses in the oceans alone
is 4 × 10
30ref.
9. Metagenomic analyses of the marine virome
typically reveal that >60% of the sequences are unrelated to any
known viruses, and there has been speculation that GTAs are
a signi
fi
cant contributor to this cloud genome
10,11. A seminal
study of antibiotic gene transfer by GTAs in in situ marine
microcosms, observed frequencies that were orders of magnitude
greater than any known mechanism
12. In the model host,
Rhodobacter capsulatus
, RcGTAs are under the control of a
number of conserved global regulatory systems such as the cell
cycle
regulator
CtrA
13–15,
the
quorum-sensing
regulator
GtaR
16,17and various phosphorelay components such as DivL
and CckA
15,18, however, all of these regulators affect RcGTA
production indirectly and thus the mechanism of activation is
unclear.
In this study, I identify and characterize a transcription factor
(Rcc01865, renamed GafA here) that binds directly to the RcGTA
promoter. The
gafA
promoter is in turn bound by both the
pleiotropic regulators CtrA and GtaR near the transcription
start site. CtrA and GafA are both required for optimal RcGTA
expression, packaging of DNA and release of infective particles.
The data presented here indicates that GafA is the missing link
that connects RcGTA production with host regulatory systems
and allows construction of the most comprehensive model of
RcGTA regulation to date.
Results and Discussion
All RcGTA genes are upregulated in an RcGTA hyperproducer
.
RcGTAs are usually produced from a small sub-population,
making in-depth analysis of RcGTA producers problematic
6,19.
Here we compared the transcriptome of an RcGTA
hyperpro-ducer,
R. capsulatus
DE442, to the wild-type by RNAseq
19. 152
upregulated and 37 down regulated genes were identi
fi
ed
(Sup-plementary Tables 1 & 2). The top 29 upregulated genes had a
beta value (
b
) of 4.0 or greater (Supplementary Table 3),
equivalent to a 16-fold increase in transcript abundance, and
contained all of the genes from the core RcGTA structural gene
cluster
14, head spikes
20, tail
fi
bre
21, lysis genes
18and a putative
RcGTA maturation protein
22. One further gene,
rcc01865
, was
previously shown to be essential for RcGTA production but its
precise role is unknown
22.
Rcc01865
encodes a protein with a
predicted helix-turn-helix (HTH) DNA binding motif in the
N-terminal domain that structurally resembles the DNA binding
domain (DBD) of the genome replication initiator protein DnaA
(e.g.
Mycobacterium tuberculosis
DnaA-DBD, 3PVV;
Supple-mentary Figure 1), which led to the assumption that it is a
reg-ulator protein
22. The C-terminus contains a region that has
similarity to various sigma factors, including a high HHPRED
probability match to
Rhodobacter sphaeroides
RpoE
(Supple-mentary Figure 1). Given that
rcc01865
is essential for RcGTA
production
22and encodes the only putative transcription factor
in the top 29 upregulated genes in the RNAseq data
(Supple-mentary Table 3), it is a strong candidate to be a speci
fi
c initiator
of RcGTA production.
Rcc001865
will hereafter be referred to as
GTA Activation Factor A (
gafA
).
GafA activates production of RcGTA particles
. Deletion of
gafA
completely prevents RcGTA gene transfer
22, even in the
hyper-producer strain
R. capsulatus
DE442 (Fig.
1
a) where RcGTA gene
expression, gene transfer frequencies and the proportion of the
producing RcGTAs are normally substantially increased
6,19.
Furthermore, in DE442, packaged GTA DNA can be seen as a
distinct 4 kb band in a total DNA puri
fi
cation. Deletion of
gafA
prevents any detectable GTA DNA in this assay (Fig.
1
b),
indi-cating that RcGTA production is fundamentally undermined at
or before the DNA packaging stage. Overexpression of
gafA
in
wild-type
R. capsulatus
SB1003 increased antibiotic gene transfer
frequencies 57-fold (SD
=
7,
n
=
8), compared to 94-fold for the
stable hyperproducer phenotype (SD
=
19,
n
=
8) (Fig.
1
a)
19. In
addition, total DNA from the
gafA
overexpressor contained large
quantities of 4 kb GTA DNA after 6 h (Fig.
1
b). After 24 h, the
cells partially dampened RcGTA production, although the levels
observed were still far greater than WT (Fig.
1
b). Dampening of
RcGTA production is not unexpected as uniform expression in all
cells is likely to be highly deleterious
6,18,19,23.
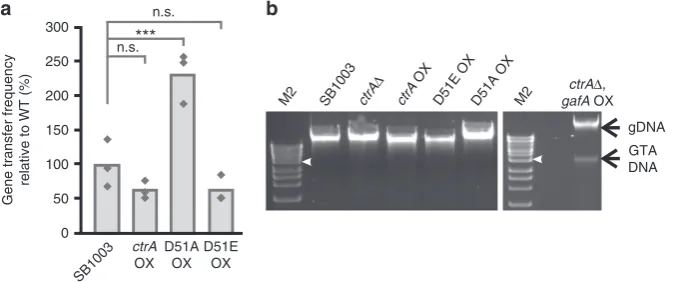
CtrA overexpression does not lead to RcGTA overproduction
.
Previous work showed that the global regulator protein CtrA is
also essential for RcGTA production
14, however, the mechanism
has never been discovered. Similar to
gafA
, deletion of
ctrA
prevents any detectable RcGTA gene transfer or production of the
RcGTA capsid protein
14. Activity of CtrA is modulated by
phosphorylation of an aspartic acid residue (D51), and its
phosphorylation state is important for RcGTA production
15,24.
The RNAseq data showed that CtrA is upregulated (2.5-fold) in
DE442 (Supplementary Tables 1 & 3) along with known CtrA
regulon genes for chemotaxis and motility (Supplementary
Table 1). If
gafA
is a simple constituent of the CtrA regulon then
increasing the abundance CtrA should lead to RcGTA
over-production. Overexpression of WT
ctrA
or phosphomimetic
ctrA
D51Eled to a slight reduction in RcGTA gene transfer,
whereas non-phosphorylatable
ctrA
D51Aincreased gene transfer
2-fold (Fig.
2
a)
25. No GTA DNA bands were detected in total
production. Similar to the
gafA
deletion,
ctrA
knockouts were not
able to produce any detectable RcGTAs in WT
13,14or
hyper-producer strains (Fig.
2
).
CtrA controls GafA activity, RcGTA maturation and lysis
.
Overexpression of
gafA
in cells lacking
ctrA
still led to substantial
intracellular GTA DNA accumulation (Fig.
2
b), albeit at a lower
level than in
ctrA
replete cells (Fig.
1
b), indicating that the
essential role of CtrA in expression of the GTA structural gene
cluster is upstream of GafA. Overexpression of
gafA
, however,
did not rescue RcGTA gene transfer ability in the
ctrA
knockout,
DNaseI insensitive DNA was not detectable in the culture
supernatant and manual lysis of the cells did not release any
detectable infective RcGTA particles. Taken together, these data
show that GafA activates synthesis of the RcGTA structural genes
and packaging of host DNA, whilst, CtrA is required for
maturation and release of infective RcGTA particles.
To further investigate the relationship between CtrA, GafA and
RcGTA production, transcription of various GTA-related genes
was measured. As expected from the phenotypic pro
fi
les, deletion
of
ctrA
or
gafA
in DE442 eliminated the hyperproducer
expression pro
fi
le. Expression of the RcGTA terminase, capsid
and endolysin genes all reduced to basal levels (Fig.
3
a). Deletion
of
ctrA
also reduced
gafA
expression but deletion of
gafA
did not
affect
ctrA
expression, which was consistent with the hypothesis
that
gafA
is part of the CtrA regulon.
Overexpression of
ctrA
did not lead to a substantial increase
in transcription of the RcGTA structural genes, lysis cassette or
gafA
(Fig.
3
b), but did increase the abundance of native
ctrA
transcripts indicating positive autoregulation (Fig.
3
c).
Over-expression of
gafA
in WT cells led to a large increase in RcGTA
gene expression (Fig.
3
d). After 6 hours,
gafA
was overexpressed
34-fold leading to a large increase in terminase (78-fold), capsid
(6-fold) and endolysin (6-fold) transcripts, supporting the
hypothesis that GafA is an activator of core RcGTA gene
expression and is also involved in the endgame of RcGTA release.
In the
ctrA
knockout, overexpression of
gafA
was even greater
(198-fold) with an associated increase in terminase (126-fold) and
capsid (22-fold) transcription but endolysin upregulation was
diminished (Fig.
3
d). Lack of lysis in the absence of
ctrA
is a likely
explanation for increased transcript abundance for
gafA
and the
050 100 150 200 250 300
SB1003 ctrA
OX D51A
OX D51E
OX
Gene transfer frequency
relative to W
T (%)
***
a
n.s.
n.s.
b
SB1003 ctrA
∆
ctrA
OX D51E OX
ctrA∆, gafA OX
D51A OX
gDNA
GTA DNA
M2 M2
Fig. 2The role of CtrA in RcGTA production.aGTA gene transfer assays forR. capsulatusSB1003,ctrAoverexpressor (ctrAOX), non-phosphorylatable ctrAoverexpressor (D51A) and phosphomimeticctrAoverexpressor (D51E OX). Individual replicates are shown as diamonds (n=3), One Way ANOVA significance versus the control (SB1003) is indicated above the chart (n.s. not significant i.e. p > 0.05, ***p< 0.001).b, Agarose gels of total DNA isolated fromR. capsulatusSB1003 and the annotated derivatives–wild-typeR. capsulatusSB1003,ctrAknockout (ctrAΔ),ctrAoverexpressor (ctrAOX), phosphomimeticctrAoverexpressor (D51E OX), non-phosphorylatablectrAoverexpressor (D51A OX) and agafAoverexpressor in actrAknockout background (ctrAΔ,gafAOX). GTA and genomic DNA (gDNA) are indicated by labelled arrows. Bioline HyperLadder 1 kb DNA ladder was used (M2); the 4 kb band is annotated with a white arrow head. Source data are provided as a Source Datafile
a
0 2000 4000 6000 8000 10,000 12,000 14,000
SB1003 gafA OX
Gene transfer frequency
relative to W
T (%)
DE442DE442 gafA∆
***
SB1003
gafA OX
6 h 24 h 48 h
b
ctrA
∆
gafA
∆ DE442
gDNA GTA DNA
M1 M2
Fig. 1Confirmation of the RcGTA Activator, GafA.aGTA gene transfer assays forR. capsulatusSB1003 (WT), SB1003gafAoverxpressor (gafAOX), RcGTA hyperproducer strainR. capsulatusDE442 (DE442) and DE442 withgafAdeleted (DE442gafAΔ). Individual replicates are shown as diamonds. All conditions were significantly different; One Way ANOVA significance is indicated above the bars (n=8, ***=p< 0.001).bAgarose gels of total DNA isolated from the annotatedR.capsulatusstrains - RcGTA hyperproducer strainR.capsulatusDE442,ctrA(ctrAΔ) andgafA(gafAΔ) knockouts in DE442, wild-typeR.capsulatusSB1003 compared togafAoverexpressor (OX) derivatives of SB1003. Time post induction ofgafAis noted in hours, GTA and genomic DNA (gDNA) are indicated by labelled arrows. NEB 1 kb Extend DNA Ladder (M1) or Bioline HyperLadder 1 kb DNA ladder were used (M2); the 4 kb band is annotated with a white arrow head. Source data are provided as a Source Datafile
[image:4.595.118.481.51.179.2] [image:4.595.131.472.282.423.2]RcGTA genes. The requirement of CtrA for endolysin production
is presumably to allow temporal control of the different stages of
RcGTA production, e.g. lysis must not occur before RcGTA
particles are fully mature and infective. Transcription of
gafA
from the native promoter also increased 31-fold in response to
ectopic
gafA
expression (Fig.
3
e). Strong positive
gafA
auto-regulation could represent a hair trigger that, once initiated, locks
the cell into a lytic fate. In contrast, only a 1.5-fold increase in
native
gafA
transcripts was detected in the absence of
ctrA
(Fig.
3
e). These data clearly indicate that GafA induces expression
of the core RcGTA genes independent of CtrA, however, positive
autoregulation of its own transcription is CtrA dependent,
providing further evidence that CtrA is required for activation
of GafA. Meanwhile, given that deletion of either
ctrA
or
gafA
in
DE442 downregulates endolysin expression and GafA only
induces endolysin expression in
ctrA
replete cells, both CtrA
and GafA must act in concert to promote lytic release of RcGTAs.
LexA and DivL are upregulated in RcGTA overproducers
. In
other species such as
Caulobacter crescentus
,
ctrA
is an essential
cell cycle regulator
25,26and in
Rhodobacter
, although not
essen-tial, it must control the timing of distinct phases of RcGTA
production. Recent work identi
fi
ed a phosphorelay (ChpT/CckA/
DivL) that modulates CtrA phosphorylation
15,18and
dysregula-tion of the PAS/PAC domain protein DivL led to increased
RcGTA production
15.
DivL
transcript abundance was 4 to 7-fold
upregulated in DE442 (Fig.
3
a and Supplementary Table 3) but
unaffected by
gafA
overexpression and mildly increased by
ctrA
overexpression (Supplementary Figure 2A).
DivL
was, however,
signi
fi
cantly down regulated in
ctrA
knockouts (Supplementary
Figure 2A). The SOS repressor,
lexA
, is also required for ef
fi
cient
RcGTA production by regulating the production of CckA
27.
GafA
and
ctrA
overexpression both led to a marginal increase (1.5 to
2-fold) in
lexA
transcription and, in DE442,
lexA
transcripts were
2 to 8-fold higher than WT (Fig.
3
a, Supplementary Figure 2B
and Supplementary Table 3). It is likely that a moderate increase
in LexA represses CckA, which in turn shifts the CtrA
equili-brium toward the unphosphorylated state and thus boosts
RcGTA production
27.
CtrA binds near the
gafA
transcription start site
. Clearly, CtrA
and GafA work together to control RcGTA production. There is
an obvious CtrA binding site in its own promoter
(GTAAC-N
6-TTAAC, Fig.
4
a) and the GafA promoter contains an almost
identical sequence (TTAAC-N
6-GTAAC, Fig.
4
a)
13,28. Alignment
of the
R. capsulatus gafA
promoter with
gafA
promoters from 14
different species (Supplementary Figure 3), revealed remarkable
conservation of the CtrA binding site and its distance to the start
codon (usually 65
–
71 bases) despite otherwise divergent
fl
anking
sequences. In an electrophoretic motility shift assay (EMSA),
DE442 DE442 ctrA∆ DE442 gafA∆
0.1 1.0 10.0 100.0 1000.0
lexA Terminase
Capsid gafA
Endolysin
ctrA divL
*
*
#
Fold expression change (
∆∆
Ct)
a
*
*
*
**
**
# n.s.
*
n.s.n.s.
*
0.1 1.0 10.0 100.0
SB1003 ctrA OX D51E OX ctrA
Capsid Terminase
Endolysin gafA
Fold expression change (
∆∆
Ct)
b
**
***
n.s.
**
***
**
***
n.s.*** ***
Fold expression change (
∆∆
Ct)
d
gafACapsid Terminase
Endolysin ctrA
0 5 10
SB1003ctrA
OX
D51E OX
Fold expression change
(
∆∆
Ct)
c
*
*
Fold expression change
(
∆∆
Ct)
e
0 10 20 30 40 50
SB1003 gafA OX ctrA∆
,
gafA
OX
**
*
0.1 1.0 10.0 100.0 1000.0
SB1003 gafA OX ctrA∆ gafA
OX
*
*
*
***
*
*
**
**
n.s.
#
[image:5.595.100.492.51.378.2]puri
fi
ed CtrA had no detectable binding af
fi
nity for its own
promoter (
≤
8000 nM Protein, Supplementary Figure 4A),
how-ever, CtrA
D51Ewas able to bind to the promoter at low af
fi
nity
(Supplementary Figure 4B). In contrast, CtrA bound to the
gafA
promoter with much greater af
fi
nity than the
ctrA
promoter (Kd
54.91 nM, SD 6.12, Fig.
4
b, c), in agreement with the observations
that CtrA is essential for
gafA
transcription. Furthermore, the
hypothesis that CtrA regulates
gafA
transcription was
strength-ened by mapping raw RNAseq transcript reads onto the
gafA
promoter sequence, which revealed that the transcription start
site is likely to be ~87 bp upstream of the start codon and
coin-cides with the CtrA binding site (Fig.
4
a). To test whether CtrA
binding to the
gafA
promoter is required for RcGTA production,
SB1003
gafA
Δ
was complemented
in trans
with plasmids
con-taining either
gafA
expressed from its unaltered native promoter
(pCMF180) or with either of the two CtrA binding half-sites
mutated by site directed mutagenesis (pCMF214 and pCMF215)
(Supplementary Figure 5). Complementation with the
wild-type promoter construct increased gene transfer frequency
to 337% of WT (SD
=
2%,
n
=
3, ANOVA
p
value
=
<0.001),
presumably due to increased copy number of the plasmid
borne
gafA
, whereas both mutated promoter constructs were
signi
fi
cantly impaired for gene transfer (10
–
22% of WT,
n
=
3,
ANOVA
p
value
=
< 0.001).
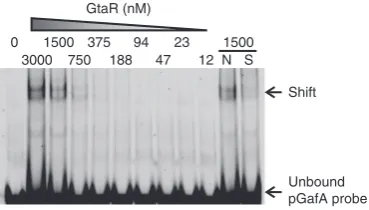
The quorum-sensing regulator GtaR binds the
gafA
promoter
.
CtrA is evidently important for GafA production, however, it is
unlikely to be the only regulator acting on
gafA
. CtrA is expressed
throughout all growth stages, whereas RcGTA are only produced
in stationary phase
5,29, and its expression is homogenous in
wild-type cells
30, whereas RcGTA are only produced by <1% of the
population
6,19. Moreover, overexpression of
ctrA
does not lead to
a substantial increase in
gafA
transcription or RcGTA production
(Figs.
2
and
3
). The GtaI/R quorum-sensing system is also
essential for RcGTA production
16,17,31. Regulation by
quorum-sensing would certainly allow
gafA
and RcGTA expression to be
limited to stationary phase and heterogeneity of the response to
homoserine lactone inducer signal could also be responsible for
RcGTA phase variation
32–34. Band shifts were carried out using
the same
gafA
promoter region that contains the CtrA binding
site (Fig.
4
a) and puri
fi
ed GtaR. GtaR binding was detected at
concentrations of 375 nM or above (Fig.
5
). The only known
binding site for GtaR is within its own promoter
16and no
ana-logous sequence was detected in the 50 bp promoter fragment
used here, which is not unexpected. Binding sites for
quorum-sensing proteins are thought to be highly degenerate and thus
dif
fi
cult to predict; indeed Leung et al. (2013) reported that the
best matches to the model GtaR binding site in
R. capsulatus
were
not bound in vitro
16. It is notable that GtaR binds to its own
promoter at a location spanning the predicted -10 Shine Delgarno
element and the transcription start site
16, and the
gafA
promoter
region bound by GtaR here contains the same promoter features
(Fig.
4
a).
GafA, but not CtrA, binds to the RcGTA promoter
. The data
presented so far suggest that GafA acts as a direct regulator of
RcGTA expression and it is likely to bind to the promoter region
of the structural gene cluster, hereafter referred to as the RcGTA
50 bp promoter probe sequence
gafA promoter
ctrA promoter
CtrA binding site
a
–10 mRNA
Coverage
2000 500 125 31
Unbound pGafA probe Shift CtrA (nM)
1000 250 63 16 1000 0
0 20 40 60 80 100
0 500 1000 1500 2000
Probe bound
(percentage maxim
a)
Protein concentration (nM) CtrA-binding affinity for pGafA
c
b
8 N S
Fig. 4CtrA binding to thegafApromoter.aAlignment of the DNA probe sequences containing CtrA-binding sites that were used for EMSAs (double headed arrow). CtrA binding sites are annotated with half sites represented by solid lines and the spacer sequence as a dashed line. The predicted Shine Delgarno−10 site is annotated. mRNA transcript coverage for thegafApromoter, obtained from RNAseq data, is shown as a histogram above the alignment.bEMSA band shift of Cy5-labelledgafApromoter DNA incubated with the protein concentrations specified. The lane labelled N contained 500-fold excess of an unlabelled non-specific competitor and S contained 500-fold excess of an unlabelled specific competitor.cQuantification of two independent band shifts of CtrA vs. thegafApromoter. Error bars are standard deviation,n=2. Source data are provided as a Source Datafile
GtaR (nM)
3000 1500
750 375
188 94
47
23 1500
Unbound pGafA probe Shift 0
12 N S
Fig. 5Binding of the GtaR quorum-sensing protein to thegafApromoter. EMSA band shift of Cy5-labelledgafApromoter DNA (see Fig.4a) incubated with the protein concentrations specified. The lane labelled N contained 500-fold excess of an unlabelled non-specific competitor and S contained 500-fold excess of an unlabelled specific competitor. Source data are provided as a Source Datafile
[image:6.595.124.472.53.238.2] [image:6.595.336.521.337.442.2]promoter. The RcGTA promoter is not well characterized and no
transcription factors have been identi
fi
ed that bind in this region.
An EMSA was carried out with
fi
ve overlapping 50 bp probes that
were designed to cover the 174 bp region immediately upstream
of RcGTA
g1
(Fig.
6
a, b). GafA binding was only detected with
one of the
fi
ve probes (pGTA2, Fig.
6
c) spanning the region
76
–
125 bp upstream of the RcGTA
g1
start codon (Fig.
6
a).
Titration of the GafA protein revealed detectable binding to
pGTA2 with as low as 16 nM protein (Fig.
6
d). Accurate
esti-mation of the Kd was not possible because there were insuf
fi
cient
data points at full saturation, however, it is likely to be in the high
nanomolar range. The pGTA2 promoter region contains the
predicted -10 element and the transcription start site, which was
con
fi
rmed by analysis of the raw RNAseq mRNA coverage
(Fig.
6
a). Binding of GafA to the region containing the
−
10 and
TSS, together with phenotypic and qPCR data described above,
strongly supports the hypothesis that GafA is a direct regulator of
RcGTA at the transcriptional level, possibly as an alternative
sigma factor. Mercer et al. (2014) reported a putative partner
switching signalling pathway, comprising RbaV, RbaW and
RbaY, that when disrupted had a moderate but signi
fi
cant effect
on RcGTA production (<3-fold)
24. RbaW was predicted to be an
anti-sigma factor and extensive attempts were made to identify
the cognate sigma factor, including deletion of all known sigma
factors except RpoN and RpoD, none of which were found to
interact with RbaW or affect expression of RcGTA. GafA had not
been linked to RcGTA at that time and thus was not considered,
but it is possible that GafA is the target of RbaW.
Meanwhile, no CtrA binding was detected to the full length
RcGTA promoter (Fig.
6
e), con
fi
rming that CtrA regulation is
indirect. The data presented are the
fi
rst evidence of a
transcription factor activating a GTA promoter and for the
fi
rst
time a direct link has been established with core host regulatory
pathways via CtrA and GtaR. Furthermore, GafA binds to its own
promoter region (Supplementary Figure 6A) to positively
auto-regulate its own expression (Fig.
3
e) and to the lysis cassette
promoter (Supplementary Figure 6B) to induce endolysin
expression (Fig.
3
d), indicating that GafA plays a critical role in
both RcGTA production and subsequent release.
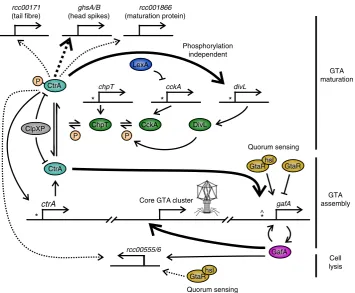
GafA is a core component of an RcGTA-regulation model
. The
results presented here allow a model of RcGTA regulation to be
constructed (Fig.
7
).
Rhodobacter
RcGTA production begins in
stationary growth phase, controlled by the quorum-sensing
pro-tein
16. Once RcGTA production begins, unphosphorylated CtrA
activates
gafA
expression; GafA then enhances its own expression,
activates expression of the core GTA structural cluster and
packaging of DNA into capsids. GTAs are normally produced in
a small proportion of any given population
6,19,35, however, in
wild-type cells CtrA expression is more or less homogenous
30and
simple overexpression of
ctrA
does not lead to high level
expression of
gafA
(Fig.
2
), which suggests that there are other
unknown factors in play. There is no evidence that epigenetic
factors, such methylation or DNA inversions, in
fl
uence RcGTA
production but heterogeneity in the quorum-sensing response is a
possible explanation for RcGTA phase variation. Relative
fi
tness
has been implicated as a factor that induces Bartonella GTA
(BaGTA)
35, i.e. the
fi
ttest subpopulation spontaneously produce
BaGTAs presumably to spread the most bene
fi
cial genes, but
contradictory data has been reported for RcGTA suggesting that
it is starvation that leads to production
18,27,36. Subsequent to
induction of the RcGTA structural genes, CtrA is phosphorylated
by the DivL/CckA/ChpT phosphorelay
15. CtrA-P activates
expression of maturation and secondary structural proteins
required for infectivity
15. Finally, GafA binds to the endolysin
1 2 3 4 5
pGTA
TSS
M
RBS –10
–35
–174 –125 –97 –75 –47 –25 +3
–18 –13 –109 –101
–129 –124 –88 –1
pGTA1
pGTA2
pGTA3
pGTA4 pGTA5
a
b
c
GafA (nM)0 4000
2000 1000
500 250
125 63
31
Shift 16
2000 N S
Unbound pGTA2 probe
d
Protein concentration
CtrA
GafA probe
Unbound pGTA
mRNA coverage
e
[image:7.595.111.479.53.283.2]promoter and induces CtrA-dependent cell lysis and RcGTA
release.
Hynes et al.
22reported that GafA homologues are present
throughout the Rhodobacterales, including in each of the
con
fi
rmed GTA producers, and local synteny of GafA is broadly
conserved i.e. it is usually
fl
anked by lipoyl synthase (
lipA
) and
GMP synthase (
gua1
) genes
22. Overexpression of
gafA
homo-logues from two known GTA producers (
Ruegeria mobilis
&
Roseovarius nubinhibens
, Supplementary Figure 7) also led to
increased GTA production (Supplementary Figure 8),
demon-strating that activation of GTAs by GafA is not unique to
R.
capsulatus
. Although GafA is present in various different species,
its rate of evolution was reported to be faster than most
components of the RcGTA genome, albeit only marginally so
22.
In general, all RcGTA genes tend to be evolving faster than core
host genes and slower than comparable phage genes
22. Beyond
the Rhodobacterales,
gafA
homologues can be found in the
Rhizobiales
37, a bacterial order that includes plant and animal
pathogens such as
Agrobacterium tumafaciens
and
Brucella
abortus
. Rhizobiales
gafA
genes are usually share less than 25%
homology with their Rhodobacterales counterparts
37or are split
into two separate ORFs, for example in
A. tumafaciens
(NZ_ASXY01000077) each ORF product is homologous to the
either the N-terminal DnaA DBD-like domain or C-terminal
sigma factor-like domains.
GTAs are thought to be derived from ancient bacteriophage
that have been hijacked by their host
22, although the lack of
signi
fi
cant matches to GTA genes in
α
-proteobacterial CRISPR
spacer regions suggest that the hypothetical progenitor phage is
extinct
37. Several marine Roseophages, such as RDJL
Φ
1, contain
several GTA-like structural genes as well as both GafA and its
neighbour, rcc01866
22,38, but they are separated by a single
intervening gene with clear homology to CtrA
7. The phage
version of CtrA lacks the N-terminus, which contains the
response regulator domain, but retains the transcriptional
activator domain. The presence of homologues of essential
RcGTA regulator and structural genes in a phage suggests that the
relationship between these regulators and GTA production is
ancient.
GTAs have the potential to drive bacterial evolution and
genome plasticity, including the spread of virulence and AMR
genes. Here, GafA is identi
fi
ed as the
fi
rst direct activator of GTA
expression to be reported for any species. The data allow the
construction of a comprehensive model of RcGTA regulation that
brings together the roles of the pleiotropic regulator CtrA,
quorum sensing, the SOS response and a conserved phosphorelay
chain. Furthermore, many aspects of GTA biology make them
intractable for high throughput studies, but identi
fi
cation of
direct activators of GTAs in widespread species could open up a
new frontier in GTA research.
Methods
Bacterial strains. Two wild-typeRhodobacterstrains were used–rifampicin resistant SB1003 (ATCC BAA-309) and rifampicin sensitive B1039. The RcGTA
overproducer strain DE442 is of uncertain provenance but has been used in a number of RcGTA publications19,40. TheE. coliS17-1 strain, which contains
chromosomally integratedtragenes, was used as a donor for all conjugations. NEB 10-beta CompetentE. coli(New England Biolabs, NEB) were used for standard cloning and plasmid maintenance; T7 Express CompetentE. coli(NEB) were used for overexpression of proteins for purification.Ruegeria mobilis(DSM 23403),
Roseovarius nubinhibens(DSM 15170) andRuegeria pomeroyi(DSM 15171) are reported GTA producers that were all obtained from DSMZ. All bacterial strains or genetic constructs are securely stored locally and are available on request.
divL
rcc00555/6 GafA
CtrA
ctrA Core GTA cluster gafA
Cell lysis GTA maturation
ChpT CckA
GTA assembly DivL
CtrA P
P P
cckA chpT
*
*
*
*
*
Phosphorylation independent
ClpXP rcc00171 (tail fibre)
ghsA/B (head spikes)
rcc001866 (maturation protein)
GtaRhsl GtaR
GtaRhsl LexA
Quorum sensing
Quorum sensing ^
Fig. 7Model of RcGTA regulation. The interactions depicted are inferred from the data in this study, raw microarray data16and published results18,19,25,30. Bent, perpendicular arrows represent promoters and are annotated with the proceeding gene name. CtrA (*) or GtaR (^) binding sites are labelled where known. Proteins are depicted as coloured ellipses with phosphate groups (P) in orange circles. Solid arrows indicate direct regulation, dashed arrows indicate indirect or unknown route of regulation and emboldened arrows indicate that the regulator is essential for target expression
[image:8.595.121.477.47.340.2]Cloning. All oligonucleotides were obtained from IDT (Supplementary Table 4) and designed with an optimal annealing temperature of 60 °C when used with Q5 DNA Polymerase (NEB). All cloning reactions were carried out with either the In-Fusion Cloning Kit (CloneTech) or NEBuilder (NEB) to produce the constructs listed in Supplementary Table 5. In summary, destination plasmids were linearized using a single restriction enzyme (pCM66T (BamHI), pEHisTEV (NcoI) and pSRKBB (NdeI)) or by PCR (pETFPP_2 using primers CleF and CleR). Inserts were amplified using primers with 15 bp 5′overhangs that have complementary sequence to the DNA with which it is to be recombined.
Transformation. Plasmids were introduced into all species exceptRhodobacterby transformation.E. coliwas transformed by standard heat shock transformation41.
ForRuegeriaandRoseovarius, 200 ml cultures were washed three times in ice cold 10% glycerol (100 ml then 50 ml then 5 ml). 100 µl aliquots were mixed with 100 ng plasmid DNA and incubated on ice for 30 min. Electroporation was carried out in 2 mm electroporation cuvettes (Scientific Laboratory Supplies) at 2.5 kV, 25 µF and 100Ω. 1 ml of marine broth was added and cells incubated at 30 °C for 4 h, then plated onto MB agar+50 µg ml−1kanamycin.
Conjugation. One millilitre aliquots of overnight cultures of theE. coliS17-1 donor andRhodobacterrecipient strains were centrifuged at 5000 ×gfor 1 min, washed with 1 ml SM buffer, centrifuged again and resuspended in 100 µl SM buffer. Ten microlitres of concentrated donor and recipient cells were mixed and spotted onto YPS agar or spotted individually as negative controls. Plates were incubated o/n at 30 °C. Spots were scraped, suspended in 100 µl YPS broth and plated on YPS+
100 µg ml−1rifampicin (counter-selection againstE. coli)+10 µg ml−1kanamycin
(plasmid selection). Plates were incubated o/n at 30 °C then restreaked onto fresh agar to obtain single colonies.
Nucleic acid purification. One millilitre samples of relevant bacterial cultures were taken for each nucleic acid purification replicate. Generally, sampling occurred during stationary phase but for overexpression experiments samples were taken 6 h and 24 h after transition to anaerobic growth. Total DNA was purified according to the Purification of Nucleic Acids by Extraction with Phenol:Chloroform protocol41. In brief, cell pellets were resuspended in 567 µl TE
buffer then 30 µl of 10% SDS and 3 µl of 10 mg ml−1proteinase K were added.
Cells were incubated at 37 °C for 1 h to allow complete lysis. 100 µl of 5 M NaCl was added to each tube and mixed thoroughly, before addition of 80 µl of 1% CTAB in 100 mM NaCl. The cell lysates were incubated at 65 °C for 10 min. Nucleic acids were purified by addition of an equal volume of Phenol:Chloroform: Isoamyl Alcohol (25:24:1, pH 8.0), vigorous mixing by inversion and centrifugation for 5 min at 14,000 ×g. The upper aqueous layer containing DNA was carefully pipetted into a fresh tube and the phenol:chloroform:isoamyl alcohol step was repeated a further two times. Traces of phenol were removed by addition of an equal volume of chloroform, vigorous mixing by inversion and centrifugation for 5 min at 14,000 ×g. The aqueous fraction was transferred to a fresh tube and nucleic acids were precipitated by addition of 0.6 volume of ice cold isopropanol, incubation at−20 °C for 1 h and centrifugation at 14,000 ×gfor 20 min. DNA
pellets were washed with 70% ethanol, air dried for ~10 min and resuspended in 50–100 µl of TE buffer. RNA was removed by addition of 1 µl of 10 mg ml−1
RNase and incubation at 37 °C for 1 h. Total RNA was purified using the NucleoSpin RNA Kit (Macherey-Nagel) and DNAseI treated on column according to the recommended protocol. RNA was quantified using a Nanodrop spectro-photometer. 1 µg of total RNA was converted to cDNA using the LunaScript RT SuperMix Kit (NEB).
RNAseq. Production of GTAs is thought to lead to cell death through packaging of host cell’s entire genome followed by lysis from within18,19,42. To
inhibit lysis, cultures were grown in a high phosphate medium, RCV, to stationary phase where total RNA was isolated18. RNA yield was quantified and quality
checked using a Nanodrop spectrophotometer and Aglient bioanalyser. Ribosomal RNA was removed from 1 µg good quality total RNA using the Ribo-Zero rRNA Removal Kit (Bacteria; Illumina). Libraries were then prepared from rRNA-depleted samples using the NEBNext RNA Ultra II Directional Library preparation kit for Illumina, with single 6 bp indices, according to the manufac-turer’s guidelines for insert sizes of approximately 200–350 bp. Libraries were pooled at equimolar ratios, and the pool was sent for 2 × 150 base paired end sequencing on a HiSeq 3000 at the University of Leeds Next Generation Sequen-cing Facility.
Abundance of transcripts were compared between the wild-typeR. capsulatus
strain SB1003 (n=4), a GTA hyperproducer DE442 (n=4) and a DE442 culture that had been passaged three times (n=4). Reads were quality checked and
trimmed using FastQC version 11.0.543and Cutadapt version 1.8.344, respectively.
Kallisto version 0.43.145was used to pseudo-align reads to theR. capsulatusSB1003
reference transcriptome, and to quantify gene expression. Differential expression analysis was performed using Sleuth version 0.29.046. A full linear model
containing strain, passage and sequencing batch wasfit to the data. In order to look at the effect of strain, the full model was compared to a reduced model based only on passage and batch. The effect size of the test variable, i.e. strain DE442 vs
SB1003, was calculated using the Wald test to give the beta value (b), based on
fitting a linear model to the data, in log2 units. The se_b value is the standard error. The q-value (qval) is the p-value adjusted by false discovery rate, where the p-value was calculated using the likelihood ratio test (LRT) in Sleuth. RNAseq data was submitted to the GEO database with the record ID GSE118116 - Comparison of the expression profiles of wild-typeRhodobacter capsulatusand a GTA hyperproducer (DE442) by RNAseq.
Gene knockouts. Knockouts were created by RcGTA transfer. pCM66T plasmid constructs were created with a gentamicin resistance cassetteflanked by 500–1000 bp of DNA from either side of the target gene. Assembly was achieved by a one-step, four component NEBuilder (NEB) reaction and transformation into NEB 10-beta cells. Deletion constructs were introduced into the RcGTA hyperproducer strain by conjugation and a standard GTA bio-assay was carried out to replace the intact chromosomal gene with the deleted version.
GafA Overexpression inRhodobacter. Gene overexpression inRhodobacterwas achieved by a transcriptional fusion of the genes of interest to thepuf photo-synthesis promoter19. Growth and general strain maintenance ofRhodobacter
strains containing overexpression plasmids was carried out at 30 °C under aerobic, chemotrophic growth conditions where transcription from thepufpromoter is strongly repressed. To produce overexpression conditions 12 ml cultures were grown to stationary phase aerobically, mixed 1:1 with fresh media and immediately transferred to 23 ml sealed tubes. Cultures were then incubated at 30 °C with illumination to inducepufpromoter activity.
Rhodobactergene transfer assays. InRhodobacter, the assays were carried out essentially as defined by Leung and Beatty (2013)47. RcGTA donor cultures were
grown anaerobically with illumination in YPS for ~72 h and recipient cultures were grown aerobically in RCV for ~24 h. For overexpression experiments, donor cultures werefirst grown aerobically to stationary phase then anaerobically for 6 h or 24 h. Cells were cleared from donor cultures by centrifugation and the supernatantfiltered through a 0.45 µm syringefilter. Recipient cells were concentrated 3-fold by cen-trifugation at 5000 ×gfor 5 min and resuspension in 1/3 volume G-Buffer (10 mM Tris-HCl (pH 7.8), 1 mM MgCl2, 1 mM CaCl2, 1 mM NaCl, 0.5 mg ml−1BSA).
Reactions were carried out in polystyrene culture tubes (Starlab) containing 400 µl G-Buffer, 100 µl recipient cells and 100 µlfilter donor supernatant, then incubated at 30 °C for 1 h. A 900 µl volume of YPS was added to each tube and incubated for a further 3 h. Cells were harvested by centrifugation at 5000 ×gand plated on YPS+
100 µg ml−1rifampicin (for standard GTA assays) or 3 µg ml−1gentamicin (for gene
knockouts).
Quantitative reverse transcriptase PCR. For each cDNA template, a 50-fold dilution was prepared in distilled water and 1 µl of diluted template was used per reaction. Reactions contained Fast Sybr Green Mastermix (Applied Biosys-tems), cDNA and primers (500 nM). Standard conditions were used with an annealing temperature of 60 °C. All primer efficiencies were calculated as between 90 and 110%. Relative gene expression was determined using theΔΔCt
method48. For each sample, variance was calculated for three independent
biolo-gical replicates, which were each the mean of three technical replicates. Quant-Studio 3 Real-Time PCR System was used for all experiments (Applied Biosystems).
Protein purification. For His6-tagged proteins, 500 ml cultures ofE. coli con-taining the relevant expression plasmid were induced at mid-exponential growth phase with 0.2 mM IPTG overnight at 20 °C. Concentrated cells were lysed in 20 ml binding buffer (1 M NaCl, 75 mM Tris; pH 7.75) plus 0.2 mg ml−1lysozyme and
500 U Basemuncher Endonuclease (Expedeon Ltd.) for 30 min on ice and then sonicated. Cleared supernatant was applied to a 5 ml HisTrap FF crude column (GE Healthcare) and the bound, his-tagged protein was eluted with 125 mM imidazole. Eluted protein was desalted on a HiPrep 26/10 desalting column (GE Healthcare) and then further separated by size exclusion chromatography on a HiLoad 16/60 Superdex 200 preparative grade gelfiltration column. All chroma-tography steps were carried out on an AKTA Prime instrument (GE Healthcare). Purified proteins were concentrated in a Spin-X UF Centrifugal Concentrator (Corning) and quantified by the nanodrop extinction co-efficient method (Thermo Scientific). Samples were stored at−80 °C in binding buffer plus 50% glycerol.
MBP-tagged proteins were purified as above except the cells were induced with 1 mM IPTG, MBP binding buffer was used (200 mM NaCl, 20 mM Tris, 1 mM EDTA; pH 7.4), the lysate was applied to a 5 ml MBPTrap FF column (GE Healthcare) and purified protein was eluted with 10 mM maltose in MBP binding buffer.
80 nM annealed Cy5-dsDNA, GntR DNA binding buffer (25 mM HEPES, 50 mM K-glutamate, 50 mM MgSO4, 1 mM dithiothreitol, 0.1 mM EDTA, 0.05% Triton
X-100; pH 8.0)49for all assays except those testing GtaR for which a modification
of the published GtaR binding buffer was used (10 mM HEPES, 40 mM NaCl; pH 8)16, 1 µg poly dI:dC, 4% glycerol and the specified concentrations of purified
protein50. 500-fold excess of competitor DNA was added to control mixtures–
specific competitor was unlabelled but otherwise identical to the binding substrate and the non-specific competitor was an unlabelled 50 bp annealed oligo matching an arbitrary location elsewhere in theR. capsulatusgenome. All assays except GtaR were incubated for 15 min at 30 °C then immediately loaded onto a 5% Acrylamide gel (1× TBE) without loading dye. GtaR assays were incubated at 37 °C for 30 minutes16. Gels were run at 100 V for 1 h at room temperature in 1× TBE.
Fluorescence was imaged using a Typhoon Biomolecular Imager (Amersham) and analysed using ImageQuant (Amersham) and FIJI51software. For the full
length RcGTA promoter (pGTA), a 5′Cy5-labelled oligo was used to create a 633 bp PCR product. The pGTA DNA was used under the same conditions as the annealed oligos, except the concentration was 2 ng µl−1, reactions were run at 100
V for 4 h at 4 °C. Non-fluorescent reactions used 100 ng of unlabelled PCR pro-ducts as binding substrates and were run on 1% high resolution MicroSieve 3:1 Agarose (Cambridge Reagents) in 1× TBE at 100 V for 2 h. Gels were stained with Sybr Safe (Invitrogen) and imaged on a GelDoc transilluminator (BioRad).
Ruegeria/Roseovariusgene transfer assays. Assays were carried out as originally reported in Biers et al.52. In brief, spontaneous rifampicin or
strepto-mycin resistant colonies were isolated by plating onto selective MB agar. Cultures were grown in ½YTSS medium for 5 days, static and without illumination. For co-culture experiments, a rifampicin resistant strain was grown together with a streptomycin resistant strain then plated on marine broth agar with both anti-biotics to assess transfer of resistance. For in vitro assays, resistant strains were grown separately for 5 days andfiltered through a 0.45 µm syringefilter. The
filtered supernatant was then added to antibiotic sensitive cells, shaken at 200 rpm for 1 h in the dark and plated on marine broth agar containing the relevant antibiotics. ThegafAhomologues were cloned into pSRKBB to produce pCMF195 & 6 (Supplementary Table 5);gafAexpression was induced from the lac’promoter by addition of 1 mM IPTG when growth had reached late logarithmic phase (OD600: ~0.8–1.0).
Bioinformatics. Helix turn helix predictions were carried out using NPS@53,54and
Gym2.055using the default settings. HHPRED56,57analysis of GafA was carried out
using the pdb_mmcif70_5_oct database and the default parameters i.e. HHBlits uniprot20_2016_02 MSA generation method, maximal generation steps=3 and an E-value threshold of 1e-3. Minimum coverage was 20%, minimum sequence identity was 0%. Secondary structure scoring was done during alignment (local). Initial full length protein query was refined and resubmitted according to the automatic suggestions provided by the software for the two respective domains. The NCBI BlastP search for GafA homologues was performed with the default parameters - expect threshold=10, word size=6, blosum62 similarity matrix, gap costs of existence=11 and extension=1. No taxonomic constraints were applied but sequences from uncultured/environmental samples were excluded. The top ten hits belonging to different species were arbitrarily selected for analysis irrespective of alignment score, the most distant match used (Sulfitobacter spp.) produced a score of 377 and anEvalue of 6e-126 from 100% coverage and 55% sequence identity. Promoter sequences for each protein were then identified in the nucleotide database for each sequence. Promoter−10/−35 elements were predicted with
BPROM58. FIJI software51was used to measure band intensities in EMSA
experiments with the Gel Analyzer plug in, ClustalW259and ClustalΩ60were used
for DNA/protein alignments as indicated in thefigure legends, Jalview61was used
to visualize alignments. Transcript abundance was visualised using the Broad Institute’s IGV viewer62. Statistical analysis was carried out using Sigmaplot
soft-ware version 13 (Systat Softsoft-ware Inc.,www.systatsoftware.com.) and, for each use, the test parameters are indicated in the text and/orfigure legends. The Sigmaplot Ligand Binding macro was also used to calculate dissociation constants (kD) from EMSA band intensities.
Reporting Summary. Further information on experimental design is available in the Nature Research Reporting Summary linked to this article.
Data availability
All the data needed to evaluate the conclusions of the paper are present in the paper and the Supplementary Informationfiles. Source data for all graphs and gel images are provided as a Source Datafile. The complete RNAseq data was submitted to the NCBI Gene Expression Omnibus (GEO) Database, accession number GSE118116 [https:// www.ncbi.nlm.nih.gov/geo/query/acc.cgi?acc=GSE118116].
Received: 14 August 2018 Accepted: 15 January 2019
References
1. Soucy, S. M., Huang, J. & Gogarten, J. P. Horizontal gene transfer: building the web of life.Nat. Rev. Genet.16, 472–482 (2015).
2. Koonin, E. V. & Wolf, Y. I. Genomics of bacteria and archaea: the emerging dynamic view of the prokaryotic world.Nucleic Acids Res.36, 6688–6719 (2008).
3. Chen, J. et al. Genome hypermobility by lateral transduction.Science362, 207–212 (2018).
4. Lang, A. S., Zhaxybayeva, O. & Beatty, J. T. Gene transfer agents: phage-like elements of genetic exchange.Nat. Rev. Microbiol.10, 472–482
(2012).
5. Solioz, M. & Marrs, B. The gene transfer agent of Rhodopseudomonas capsulata. Purification and characterization of its nucleic acid.Arch. Biochem. Biophys.181, 300–307 (1977).
6. Hynes, A. P., Mercer, R. G., Watton, D. E., Buckley, C. B. & Lang, A. S. DNA packaging bias and differential expression of gene transfer agent genes within a population during production and release of the Rhodobacter capsulatus gene transfer agent, RcGTA.Mol. Microbiol.85, 314–325 (2012). 7. Lang, A. S., Westbye, A. B. & Beatty, J. T. The distribution, evolution, and
roles of gene transfer agents in prokaryotic genetic exchange.Annu. Rev. Virol. 4, 87–104 (2017).
8. Redfield, R. J. & Soucy, S. M. Evolution of bacterial gene transfer agents.Front. Microbiol.9, 2527 (2018).
9. Suttle, C. A. Viruses in the sea.Nature437, 356–361 (2005).
10. Kristensen, D. M., Mushegian, A. R., Dolja, V. V. & Koonin, E. V. New dimensions of the virus world discovered through metagenomics.Trends Microbiol.18, 11–19 (2010).
11. Angly, F. E. et al. The marine viromes of four oceanic regions.PLoS Biol.4, e368 (2006).
12. McDaniel, L. D. et al. High frequency of horizontal gene transfer in the oceans.Science330, 50 (2010).
13. Mercer, R. G. et al. Loss of the response regulator CtrA causes pleiotropic effects on gene expression but does not affect growth phase regulation in Rhodobacter capsulatus.J. Bacteriol.192, 2701–2710 (2010).
14. Lang, A. S. & Beatty, J. T. Genetic analysis of a bacterial genetic exchange element: the gene transfer agent of Rhodobacter capsulatus.Proc. Natl Acad. Sci. USA97, 859–864 (2000).
15. Westbye, A. B. et al. The protease ClpXP and the PAS-domain protein DivL regulate CtrA and gene transfer agent production in Rhodobacter capsulatus.
Appl. Environ. Microbiol.https://doi.org/10.1128/AEM.00275-18(2018). 16. Leung, M. M., Brimacombe, C. A., Spiegelman, G. B. & Beatty, J. T. The GtaR
protein negatively regulates transcription of the gtaRI operon and modulates gene transfer agent (RcGTA) expression in Rhodobacter capsulatus.Mol. Microbiol.83, 759–774 (2012).
17. Brimacombe, C. A. et al. Quorum-sensing regulation of a capsular polysaccharide receptor for the Rhodobacter capsulatus gene transfer agent (RcGTA).Mol. Microbiol.87, 802–817 (2013).
18. Westbye, A. B. et al. Phosphate concentration and the putative sensor kinase protein CckA modulate cell lysis and release of the Rhodobacter capsulatus gene transfer agent.J. Bacteriol.195, 5025–5040 (2013).
19. Fogg, P. C. M., Westbye, A. B. & Beatty, J. T. One for all or all for one: heterogeneous expression and host cell lysis are key to gene transfer agent activity in Rhodobacter capsulatus.PLoS ONE7, e43772 (2012). 20. Westbye, A. B., Kuchinski, K., Yip, C. K. & Beatty, J. T. The gene transfer
agent rcgta contains head spikes needed for binding to the rhodobacter capsulatus polysaccharide cell capsule.J. Mol. Biol.428, 477–491 (2016). 21. Chen, F. et al. Proteomic analysis and identification of the structural and
regulatory proteins of the Rhodobacter capsulatus gene transfer agent.
J. Proteome Res.8, 967–973 (2009).
22. Hynes, A. P. et al. Functional and evolutionary characterization of a gene transfer agent’s multilocus“genome”.Mol. Biol. Evol.33, 2530–2543 (2016). 23. Matson, E. G., Thompson, M. G., Humphrey, S. B., Zuerner, R. L. & Stanton, T. B. Identification of genes of VSH-1, a prophage-like gene transfer agent of Brachyspira hyodysenteriae.J. Bacteriol.187, 5885–5892 (2005). 24. Mercer, R. G. & Lang, A. S. Identification of a predicted partner-switching
system that affects production of the gene transfer agent RcGTA and stationary phase viability in Rhodobacter capsulatus.BMC Microbiol.14, 71 (2014).
25. Reisenauer, A., Quon, K. & Shapiro, L. The CtrA response regulator mediates temporal control of gene expression during the Caulobacter cell cycle.J. Bacteriol.181, 2430–2439 (1999).
26. Pini, F. et al. Cell cycle control by the master regulator CtrA in Sinorhizobium meliloti.PLoS Genet.11, e1005232 (2015).
27. Kuchinski, K. S., Brimacombe, C. A., Westbye, A. B., Ding, H. & Beatty, J. T. The SOS response master regulator lexa regulates the gene transfer agent of rhodobacter capsulatus and represses transcription of the signal transduction protein CckA.J. Bacteriol.198, 1137–1148 (2016).
28. Laub, M. T., Chen, S. L., Shapiro, L. & McAdams, H. H. Genes directly controlled by CtrA, a master regulator of the Caulobacter cell cycle.Proc. Nat Acad. Sci. USA99, 4632–4637 (2002).
29. Marrs, B. Genetic recombination in Rhodopseudomonas capsulata.Proc. Natl Acad. Sci. USA71, 971–973 (1974).
30. Brimacombe, C. A., Ding, H., Johnson, J. A. & Beatty, J. T. Homologues of genetic transformation dna import genes are required for rhodobacter capsulatus gene transfer agent recipient capability regulated by the response regulator CtrA.J. Bacteriol.197, 2653–2663 (2015).
31. Schaefer, A. L., Taylor, T. A., Beatty, J. T. & Greenberg, E. P. Long-chain acyl-homoserine lactone quorum-sensing regulation of Rhodobacter capsulatus gene transfer agent production.J. Bacteriol.184, 6515–6521 (2002). 32. Grote, J., Krysciak, D. & Streit, W. R. Phenotypic heterogeneity, a
phenomenon that may explain why quorum sensing does not always result in truly homogenous cell behavior.Appl. Environ. Microbiol.81, 5280–5289 (2015).
33. Pérez, P. D. & Hagen, S. J. Heterogeneous response to a quorum-sensing signal in the luminescence of individual Vibriofischeri.PLoS ONE5, e15473 (2010).
34. Anetzberger, C., Pirch, T. & Jung, K. Heterogeneity in quorum sensing-regulated bioluminescence of Vibrio harveyi.Mol. Microbiol.73, 267–277 (2009). 35. Québatte, M. et al. Gene transfer agent promotes evolvability within thefittest
subpopulation of a bacterial pathogen.Cell Syst.4, 611–621.e6 (2017). 36. Westbye, A. B., O’Neill, Z., Schellenberg-Beaver, T. & Beatty, J. T. The
Rhodobacter capsulatus gene transfer agent is induced by nutrient depletion and the RNAP omega subunit.Microbiology163, 1355–1363 (2017). 37. Shakya, M., Soucy, S. M. & Zhaxybayeva, O. Insights into origin and evolution
ofα-proteobacterial gene transfer agents.Virus Evol.3, vex036 (2017). 38. Huang, S., Zhang, Y., Chen, F. & Jiao, N. Complete genome sequence of a
marine roseophage provides evidence into the evolution of gene transfer agents in alphaproteobacteria.Virol. J.8, 124 (2011).
39. Wall, J. D., Weaver, P. F. & Gest, H. Gene transfer agents, bacteriophages, and bacteriocins of Rhodopseudomonas capsulata.Arch. Microbiol.105, 217–224 (1975).
40. Ding, H., Moksa, M. M., Hirst, M. & Beatty, J. T. Draft genome sequences of six rhodobacter capsulatus strains, YW1, YW2, B6, Y262, R121, and DE442.
Genome Announc.2, e00050 (2014).
41. Maniatis, T., Fritsch, E. F. & Sambrook, J.Molecular Cloning: A Laboratory Manual931–957 (Cold Spring Harbor Laboratory press, New York, 1982). 42. Matson, E. G., Zuerner, R. L. & Stanton, T. B. Induction and transcription of
VSH-1, a prophage-like gene transfer agent of Brachyspira hyodysenteriae.
Anaerobe13, 89–97 (2007).
43. Babraham Bioinformatics.FastQC A Quality Control Tool For High Throughput Sequence Datahttp://www.bioinformatics.babraham.ac.uk/ projects/fastqc/.
44. Martin, M. Cutadapt removes adapter sequences from high-throughput sequencing reads.EMBnet. J.17, 10 (2011).
45. Bray, N. L., Pimentel, H., Melsted, P. & Pachter, L. Near-optimal probabilistic RNA-seq quantification.Nat. Biotechnol.34, 525–527 (2016).
46. Pimentel, H., Bray, N. L., Puente, S., Melsted, P. & Pachter, L. Differential analysis of RNA-seq incorporating quantification uncertainty.Nat. Methods 14, 687–690 (2017).
47. Leung, M. & Beatty, J. Rhodobacter capsulatus gene transfer agent transduction assay.Bio-protocol3, e334 (2013).
48. Livak, K. J. & Schmittgen, T. D. Analysis of relative gene expression data using real-time quantitative PCR and the 2(-Delta Delta C(T)) Method.Methods25, 402–408 (2001).
49. Wiethaus, J., Schubert, B., Pfänder, Y., Narberhaus, F. & Masepohl, B. The GntR-like regulator TauR activates expression of taurine utilization genes in Rhodobacter capsulatus.J. Bacteriol.190, 487–493 (2008).
50. Wiethaus, J., Wirsing, A., Narberhaus, F. & Masepohl, B. Overlapping and specialized functions of the molybdenum-dependent regulators MopA and MopB in Rhodobacter capsulatus.J. Bacteriol.188, 8441–8451 (2006). 51. Schindelin, J. et al. Fiji: an open-source platform for biological-image analysis.
Nat. Methods9, 676–682 (2012).
52. Biers, E. J. et al. Occurrence and expression of gene transfer agent genes in marine bacterioplankton.Appl. Environ. Microbiol.74, 2933–2939 (2008). 53. Dodd, I. B. & Egan, J. B. Improved detection of helix-turn-helix DNA-binding
motifs in protein sequences.Nucleic Acids Res.18, 5019–5026 (1990).
54. Combet, C., Blanchet, C., Geourjon, C. & Deléage, G. NPS@: network protein sequence analysis.Trends Biochem. Sci.25, 147–150 (2000).
55. Narasimhan, G. et al. Mining protein sequences for motifs.J. Comput. Biol.9, 707–720 (2002).
56. Hildebrand, A., Remmert, M., Biegert, A. & Söding, J. Fast and accurate automatic structure prediction with HHpred.Proteins77(Suppl 9), 128–132 (2009).
57. Zimmermann, L. et al. A completely reimplemented mpi bioinformatics toolkit with a new hhpred server at its core.J. Mol. Biol.430, 2237–2243 (2018).
58. Solovyev, V. & Salamov, A. Automatic Annotation of Microbial Genomes and Metagenomic Sequences.Metagenomics And Its Applications In Agriculture, Biomedicine and Environmental Studies(Nova Science Publishers, New York, 2011).
59. Larkin, M. A. et al. Clustal W and Clustal X version 2.0.Bioinformatics23, 2947–2948 (2007).
60. Sievers, F. et al. Fast, scalable generation of high-quality protein multiple sequence alignments using Clustal Omega.Mol. Syst. Biol.7, 539 (2011).
61. Waterhouse, A. M., Procter, J. B., Martin, D. M. A., Clamp, M. & Barton, G. J. Jalview Version 2--a multiple sequence alignment editor and analysis workbench.Bioinformatics25, 1189–1191 (2009).
62. Robinson, J. T. et al. Integrative genomics viewer.Nat. Biotechnol.29, 24–26 (2011).
Acknowledgements
The author thanks the University of York Technology Facility for providing access to equipment and expert technical assistance when required, with particular acknowl-edgement to Dr. Katherine Newling for RNAseq quality control and statistical analysis. The author also thanks Dr. Jelena Kusakina for critical reading of the manuscript. This work was wholly supported by a Wellcome Trust/Royal Society Sir Henry Dale Fel-lowship Grant (109363/Z/15/Z).
Author contributions
P.C.M.F. conceived, designed and implemented this study and prepared the manuscript.
Additional information
Supplementary Informationaccompanies this paper at https://doi.org/10.1038/s41467-019-08526-1.
Competing interests:The author declares no competing interests.
Reprints and permissioninformation is available online athttp://npg.nature.com/ reprintsandpermissions/
Journal peer review information:Nature Communicationsthanks Keith Shearwin and the other anonymous reviewers for their contribution to the peer review of this work. Peer reviewer reports are available.
Publisher’s note:Springer Nature remains neutral with regard to jurisdictional claims in published maps and institutional affiliations.
Open Access This article is licensed under a Creative Commons Attribution 4.0 International License, which permits use, sharing, adaptation, distribution and reproduction in any medium or format, as long as you give appropriate credit to the original author(s) and the source, provide a link to the Creative Commons license, and indicate if changes were made. The images or other third party material in this article are included in the article’s Creative Commons license, unless indicated otherwise in a credit line to the material. If material is not included in the article’s Creative Commons license and your intended use is not permitted by statutory regulation or exceeds the permitted use, you will need to obtain permission directly from the copyright holder. To view a copy of this license, visithttp://creativecommons.org/ licenses/by/4.0/.