This is a repository copy of
Deformation-induced microstructural banding in TRIP steels
.
White Rose Research Online URL for this paper:
http://eprints.whiterose.ac.uk/131234/
Version: Published Version
Article:
Celotto, S., Ghadbeigi, H. orcid.org/0000-0001-6507-2353, Pinna, C.
orcid.org/0000-0002-9079-1381 et al. (2 more authors) (2018) Deformation-induced
microstructural banding in TRIP steels. Metallurgical and Materials Transactions A. ISSN
1073-5623
https://doi.org/10.1007/s11661-018-4650-z
© The Author(s) 2018. This article is distributed under the terms of the Creative Commons
Attribution 4.0 International License (http://creativecommons.org/licenses/by/4.0/), which
permits unrestricted use, distribution, and reproduction in any medium, provided you give
appropriate credit to the original author(s) and the source, provide a link to the Creative
Commons license, and indicate if changes were made.
[email protected] https://eprints.whiterose.ac.uk/
Reuse
This article is distributed under the terms of the Creative Commons Attribution (CC BY) licence. This licence allows you to distribute, remix, tweak, and build upon the work, even commercially, as long as you credit the authors for the original work. More information and the full terms of the licence here:
https://creativecommons.org/licenses/
Takedown
If you consider content in White Rose Research Online to be in breach of UK law, please notify us by
Deformation-Induced Microstructural Banding
in TRIP Steels
S. CELOTTO, H. GHADBEIGI, C. PINNA, B.A. SHOLLOCK, and P. EFTHYMIADIS
Microstructure inhomogeneities can strongly influence the mechanical properties of advanced high-strength steels in a detrimental manner. This study of a transformation-induced plasticity (TRIP) steel investigates the effect of pre-existing contiguous grain boundary networks (CGBNs) of hard second-phases and shows how these develop into bands during tensile testing usingin situobservations in conjunction with digital image correlation (DIC). The bands form by the lateral contraction of the soft ferrite matrix, which rotates and displaces the CGBNs of second-phases and the individual features within them to become aligned with the loading direction. The more extensive pre-existing CGBNs that were before the deformation already aligned with the loading direction are the most critical microstructural feature for damage initiation and propagation. They induce micro-void formation between the hard second-phases along them, which coalesce and develop into long macroscopic fissures. The hard phases, retained austenite and martensite, were not differentiated as it was found that the individual phases do not play a role in the formation of these bands. It is suggested that minimizing the presence of CGBNs of hard second-phases in the initial microstructure will increase the formability.
https://doi.org/10.1007/s11661-018-4650-z ÓThe Author(s) 2018
I. INTRODUCTION
T
RANSFORMATION-
INDUCED plasticity(TRIP) steels are one class of advanced high-strength steels (AHSS) that have been developed for applications
in the automotive industry in recent years.[1,2] Their
combination of high strength and increased uniform and total elongation, even compared to dual-phase (DP) steels, enables the forming of complex-shaped compo-nents where stretchability is a key formability charac-teristic. Additionally, this combination of properties can enhance the energy absorption capacity, giving better crashworthiness and thus, improved passenger safety. However, this new class of material exhibits microstruc-tural banding, a common detrimental microstrucmicrostruc-tural feature found in many steel types. These bands in
general consist of alloying addition (e.g., C, Mn)
enriched microstructural constituents, usually pearlite or martensite, as layers parallel to the rolling plane.
They form as a consequence of the processing at both casting and rolling deformation stages.[3]This study, like others, shows that these bands have an important effect on mechanical properties.[4–6]
There have been previous studies to investigate and control the formation of microstructural bands during
processing.[7,8]It has been reported that the
thermome-chanical processing required to avoid the formation of microstructural bands can be sometimes economically
impractical[7] or physically impossible due to the
ther-modynamics and kinetics governing the formation of
such bands.[8] Nevertheless, a better understanding of
the effects of such bands on the microstructural behav-ior of TRIP steels can lead to the development of new processing routes aimed at improving the mechanical properties of these materials by optimizing the geomet-ric characteristics of these bands.[3,9]Furthermore, some optimizations can be realized through economically feasible thermomechanical processes.[3,9]For example, it has been suggested that increasing the cooling rate during the hot rolling process leads to a significant decrease of martensite banding in the microstructure of dual-phase steels for sheets used in the automotive industry.[9]
The influence of microstructural bands on the global material behavior of banded and un-banded microstruc-tures has been widely investigated in the literature with differing conclusions. The effect of such bands on local deformation and damage has been reported to be both S. CELOTTO is with Tata Steel R&D, IJmuiden, 1970 CA, The
Netherlands. H. GHADBEIGI and C. PINNA are with the Department of Mechanical Engineering, University of Sheffield, Mappin Street, Sheffield, S1 3JD, UK. B.A. SHOLLOCK and P. EFTHYMIADIS are with the WMG, University of Warwick, Coventry CV4 7AL, UK. Contact e-mail: P.Efthymiadis@warwick. ac.uk
detrimental and beneficial.[4,5,10–13]A comparative study of two TRIP steels concluded that microstructure banding was in fact beneficial in that it resulted in ductile fracture, although it did not improve the tensile
elongation.[6] A direct comparison, however, is not
straightforward as several parameters differ between the respective materials investigated, such as grain size and distribution, phase content, and inclusion
morphol-ogy.[10,11] There is therefore a need for better
under-standing of the effect of banding on local deformation and damage mechanisms that affect the overall mechan-ical performance of AHSSs.
Digital image correlation (DIC) is a technique that has been widely used as a tool to quantify the deforma-tion at the microstructural level in advanced
high-strength steels and its effect on damage.[14–17] Several
studies have been reported where in situ mechanical
testing was conducted in a scanning electron microscope
(SEM) for DP600 and DP1000 steel series.[14–17]
Inter-rupted tensile testing at small displacement intervals enabled the capture of SEM micrographs to measure strain distributions at the scale of the individual grains and phases by correlating the various images. In a recent study, the DIC technique was employed to study the
effect of microstructural banding in DP600 steels.[18]The
study showed that certain limitations of the
conven-tionally used experimental techniques, such as
post-mortem metallographic studies, can be overcome by an
in situ approach where the mechanisms that lead to damage in such bands can be captured during tensile testing. This study revealed the detrimental effect of such bands on the micromechanical behavior of DP600 steel. In contrast to DP steels, there is limited information and understanding of the micromechanical behavior of TRIP steels. This is partly due to there being no direct observations on the effect of microstructural bands on the micromechanical behavior of these materials. In this
study, in situ micromechanical testing combined with
DIC and fracture surface analysis is carried out to
provide new insights into the influence of
microstructural bands on the local deformation and damage mechanisms in the microstructure of TRIP steels. Unlike other studies which are usually focused on evaluating the influence of the major strain component, the minor strain distribution and evolution are also analyzed in this work in order to identify the effect of lateral contraction on the formation of microstructural bands. One of the key findings is that banding of the second-phases in the microstructure, even if it is not initially present, may be inevitable due to the inhomo-geneous deformation of these steels.
II. EXPERIMENTAL PROCEDURE
A TRIP800 steel with an ultimate tensile strength (UTS) of 800 MPa was studied in this work. The
specimens were mechanically polished to 1lm and
etched in 0.5 pct Nital solution to reveal the microstruc-ture for SEM analysis. For EBSD analysis, to identify the distribution of retained austenite in the matrix, the
specimens were mechanically polished down to 0.01lm
and then electropolished with A2 electrolyte (42 V,
20 seconds and a temperature of 8°C).[19]The
face-cen-tered cubic (FCC) retained austenite was differentiated from the body-centered cubic (BCC) crystal structure of ferrite, bainite, and martensite (note that the tetragonal BC structure of the latter was indistinguishable from the BCC).
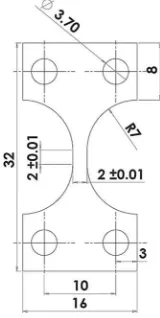
Tensile specimens were machined, from as-received 1-mm-thick sheets, using electro-discharge wire erosion machining to minimize the effects of conventional machining on the original microstructure. The sample
geometry, shown in Figure1, has a nominal gauge area
of 2 mm92 mm.
Micro-tensile testing was performed using a 5 kN Deben testing stage inside a CamScan SEM with a
crosshead speed of 1.6lm/sec. The tensile tests were
interrupted after every 0.04 mm displacement increment and after the elastic stress relaxation, micrographs of the deformed microstructure were recorded. Local displace-ment and strain values were computed by means of DIC
as explained in Reference14. Relatively low
magnifica-tion analysis (1700 times) was used in order to evaluate the effect of large microstructural defects such as microstructural bands. The micrographs were analyzed using the commercial image analysis software, DaVis 7.2
by LaVision,[20]to determine the in-plane displacement
field from which the plastic strain values were calcu-lated. The microstructural features of the material have been directly used as patterns to perform image corre-lation between two successive loading steps.
Micro-graphs of 62lm947lm areas were used for the DIC
analysis. Based on a sensitivity analysis of the grid size, a
subset size of 16916 pixels was selected for all the
experimental results presented in this study. A
mul-ti-pass algorithm[20]leading to a 1.8lm91.8lm final
[image:3.594.106.186.37.196.2]A displacement accuracy of 0.01 pixels was obtained with a strain resolution of about 0.1 pct.[20]
III. RESULTS
A. Chemical Composition and Microstructural Analysis
The chemical composition of the Si-alloyed TRIP800
is shown in TableI and the as-received microstructure
and BCC-FCC phase distribution are shown in
Figures2(a) and (b), respectively. The retained austenite
and martensite are further referred to as hard phases and are not differentiated in this study as the formation of the microstructural bands was independent of their individual micromechanical behavior. Similarly, the ferrite is not distinguished from any bainite that was present, but this may need to be investigated in a future study. Both micrographs show that there is a homoge-neous distribution of hard phases in the as-received material, when viewed from the normal direction (ND). The banded microstructure of this material that was inherited from processing is not visible in this cross section, but is more apparent when viewed from either the transverse (TD) or rolling direction (RD). Note also
in Figure2(a), the mixed morphology of the hard phases
ranges from blocks to laths.
B. Stress–Strain Curve
Figure3 shows the stress–strain curve derived from
the load-displacement measurements recorded during
in situtensile testing. It shows the macroscopic mechan-ical behavior of the specimen, with the drops in the curve being due to the elastic stress relaxation when the interruptions were made to take micrographs. The stress–strain response is typical for a TRIP800 with
continuous yielding beginning at approximately
500 MPa and work hardening through to the macro-scopic stress magnitude of about 800 MPa. Thereafter, necking starts, but due to the relatively slow strain rate and relatively small gauge length, there is a relatively extensive post-uniform elongation region present. While the strength values correspond to a TRIP800, the strains at which necking began and the total elongation do not. The behavior up to maximum load should not be interpreted as uniform strain as in a conventional tensile test. This is because of the non-standard sample geometry that was designed to localize the deformation, such that necking and fracture would occur at a specific position to enable a series of observations at high magnifications. The observations in the text refer to the
major strains (eyy) calculated from the crosshead
exten-sion (corrected for instrument compliance) and a gauge length of 2 mm.
C. Digital Image Correlation Results
In most published studies on micromechanical testing,
the major strains are quantified and analyzed.[14–17] In
this study, the minor strain (exx) component is first
evaluated in order to assess the lateral contraction of the soft ferrite phase and its effect on the formation of microstructural bands during tensile loading. The major
strains (eyy) are then analyzed to investigate the
[image:4.594.61.567.51.85.2]distri-bution of major strains along the hard second-phase bands. The mechanical behavior of the individual hard microstructural constituents is not analyzed in this
Table I. Chemical Composition (Weight Percent) of the TRIP800 Steel Studied
C Mn Si Al P S Ti Cu Cr Mo
0.199 1.700 1.560 0.038 0.010 0.004 0.003 0.015 0.028 0.002
[image:4.594.330.564.96.515.2]work, as the focus of this study is to understand the mechanisms that influence the formation of microstruc-tural bands.
1. Minor strains (exx)
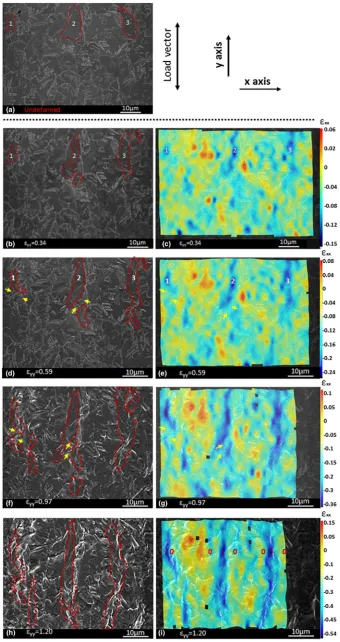
Figure4a shows the selected region for the
unde-formed sample prior to tensile testing. The loading
direction, x- and y-axis are also indicated. Three large
ferritic regions are highlighted with red broken lines in
Figure 4(a). Figure4(b) shows the same region after an
applied strain of 0.34, which corresponds to the early
stage of plastic deformation, Figure 3. Figure4(c)
shows the corresponding DIC-measured minor strain (exx) distribution over the area of Figure4(b). The strain
map shows that the ferritic regions have experienced
significant compressive strains along the horizontal (x-)
axis. The deformation of the ferrite grains along the
loading y-axis is accompanied by extensive lateral
contraction corresponding to an exx strain magnitude
on the order of 0.11. It has also been shown in other studies[14–17] that plastic deformation initiates at ferrite grains in multi-phase advanced high-strength steels.
The ferritic regions are adjacent to small islands of hard microstructural constituents. The neighboring hard second-phase islands locally diminish the minor com-pressive strains. The minor strains are between |0.1| and |0.12| (negative in sign) within the ferritic regions, while in the neighboring hard microstructural constituents, they are between 0 and |0.02| (positive in sign). The hard phases, therefore, exhibit minor strain magnitudes 6 times lower than the ferrite matrix. The highest major strains are expected to occur where the lowest lateral
contraction is observed in Figure4c.
At a higher applied strain (eyy= 0.59), the
compres-sive strains in the horizontal direction, resulting from the lateral contraction normal to the tensile axis,
increase in the ferrite matrix from |0.15| in Figure4(c)
to |0.24| in Figure4(e). The three ferrite regions of
Figure 4(b) continued to elongate parallel to the loading
direction in Figures4(d), (f) and (h).
Figures4(d) through (g) show that the strain patterns
in region 1 and 2 are being disrupted by the presence of small hard phases at the yellow-arrowed regions. The presence of hard second-phases terminates and/or diverts the minor strain fields. In these two cases, the hard phases lie at a location and orientation that restricts plastic deformation along the loading axis and therefore, locally reduce the minor compressive strains
in Figures4(d) through (g).
Upon the initial stages of necking (eyy= 0.97;
Figures4(f) and (g)) and more evidently, just before
final failure, in Figures4(h) and (i), three laterally
contracted regions highlighted in red appear as bands aligned next to networks of hard second-phases and almost parallel to the loading direction. The bright
features in Figure4(h) correspond (in most cases) to the
interfaces of the ferrite matrix with the hard sec-ond-phases and indicate large out-of-plane deforma-tions. It can also be observed that the ferrite matrix has re-aligned the hard phases, creating aligned bands of second-phase islands adjacent to the ferritic regions and parallel to the loading direction. High strain gradients for the minor strain component occur in the neighbor-hood of these bands along the horizontal direction
(minor strain axis) in Figure4(i). Figure 4(i) shows that
the zones of soft ferritic matrix experience high lateral contraction ( ) in between regions with near-zero compressive strains. The variation in the local strain magnitudes in the horizontal direction indicates local-ized and banded material flow with the highly com-pressed soft ferritic regions aligned next to near-zero compression bands of hard second-phases.
2. Major strains (eyy)
Figure5 shows the major strain map corresponding
to the micrograph of Figure4(h) at an applied strain of
eyy= 1.2 just before final fracture. Based on a simple
measurement of the elongation of ferrite region in region
2 between Figures4(a) and (h), the tensile strain value is
about 150 pct and therefore, local strain values up to
220 pct seen in Figure5are not surprising. Similarly, for
the transverse compressive strain, the wider part of
region 2 gives 38 pct while the strain map using DIC
shows about 40 pct at that particular location (light
blue color on the scale of Figure4(i)).
The same regions highlighted in red in Figure4(h) are
outlined in Figure 5. A comparison between Figures4(i)
and5shows that the evolution of mechanisms involved
in the formation of microstructural bands during tensile loading is better revealed by evaluating the minor strain component. The major strain distribution map does not show any indications of banded material flow.
The highest major strains were measured within or adjacent to the microstructural bands highlighted in
Figure5. Such high strains cannot be accommodated by
the hard second-phases. The two magnified insets show micro-void nucleation at the neighborhood of the hard phases, accompanied by slip band formation in the neighboring ferrite matrix (indicated by yellow arrow). Local softening occurs upon the formation of micro-voids at the red-arrowed locations within the two enlarged areas in the insets. It should be noted that
0 100 200 300 400 500 600 700 800 900
0 0.2 0.4 0.6 0.8 1 1.2 1.4
Str e ss (M P a ) Strain Stress strain curve
yy=0.34
0.59 0.97
1.2
Interrupted test ConƟnuous curve
Fig. 4—Micrograph of the selected region: (a) before testing (1700 times magnification); (b), (d), (f), and (h) after specific applied strains (eyy)
given in the sub-figures; and (c), (e), (g), (i) are the correspondingexxminor strain maps. This shows the developing elongation in the loading
strain values calculated through DIC in regions of the microstructure where damage appears during deforma-tion are inaccurate and can only be considered qualita-tively due to a local loss of correlation, associated with a sudden change of contrast in the interrogation window at the damage location. The algorithm used by the DaVis software to return a strain value at these locations is unknown. There are, however, regions of very high strains where voids nucleated, separated by low-strained, undamaged regions along the red-outlined
areas. Figure 5 reveals that the gradients for the major
strain component are larger along the contiguous bands of hard second-phases. These large (major) strain gradients suggest that the alignment of the soft ferrite matrix adjacent to the contiguous bands of hard second-phases leads to localized damage at specific sites in between the hard phases along these bands.
D. Mid-plane Analysis
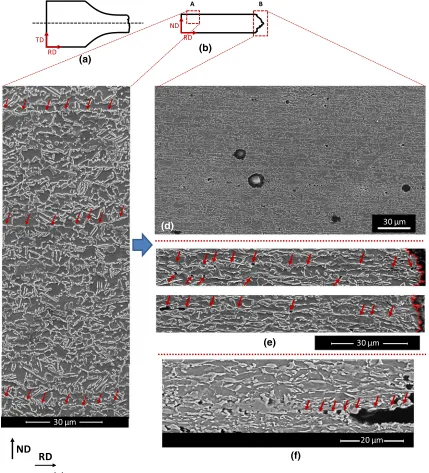
The fractured specimens, shown schematically in
Figure6(a), were sectioned along the mid-plane
(black-dotted line) relative to the specimen width. The ND-RD plane of the cut samples was metallographically polished and etched with 0.5 pct Nital solution. An undeformed and a heavily deformed region of the
sample (region A and B, respectively, in Figure6(b))
were selected and analyzed using SEM imaging to evaluate the effect of tensile loading on the formation of
microstructural bands in a conventional post-mortem
approach.
In the as-received microstructure (Region A) shown in
Figure6(c), the hard second-phases decorate the ferrite
grain boundaries and in many cases form contiguous networks, as highlighted by the red arrows. These features become even more apparent with deformation
as shown in Figures6(d) and (e). In this type of
microstructural band, it is not simply the hard sec-ond-phases that are aligned, but the ferrite grain boundaries that they lie upon are as well.
The undeformed microstructure also exhibits
equiaxed ferrite grains (delineated by the grain bound-ary networks), but near the fracture surface they become
significantly elongated along the loading direction (i.e.,
RD) and compressed in the normal direction. In the heavily deformed region near the fracture surface
(region B) shown in Figures6(d), (e) and (f), many of
the grain boundary networks have become aligned with the load axis, along with the individual lath-shaped (possibly plates in cross section) hard second-phases, to
form bands with an interspacing of 2 to 5lm.
Large voids ranging 5 to 15lm in size are clearly
visible in Figure6(d). They are all associated with oxide
inclusions that will be described further in the next section on the fractography. Otherwise, it is remarkable how damage tolerant the majority of the contiguous grain boundary networks (CGBNs) are on the basis of the lack of visible voids, especially with the obvious high levels of ferrite deformation that have occurred. Some voids are present in the constrained ferrite between the hard phases, but the majority are along certain grain boundary networks. These voids are indicated by arrows
in Figures6(e) and (f), which show the CGBN in the
deformed microstructure at higher magnification.
Figure6(c) shows that in the as-received
microstruc-ture (Region A) there are pre-existing horizontal CGBNs that extend over the whole width of the micrograph, indicated by red arrows. The initial spacing between these microstructural bands is approximately
40 to 70lm, but in the heavily deformed part of the
specimen these features become approximately 10lm
apart, as shown in Figure6(d). These CGBNs lie
parallel to the loading direction and develop a large number of voids along them, even up to 100
microm-eters away from to the fracture surface. Figure6f shows
that these CGBNs correspond to the fissures extending from the fracture surface, where the crack appears to propagate along the hard second-phases and the adja-cent ferrite matrix.
Fig. 5—The corresponding major strain map (eyy) for an applied
strain of eyy= 1.2. The insets show enlargements of regions where
E. Fracture Surface Analysis
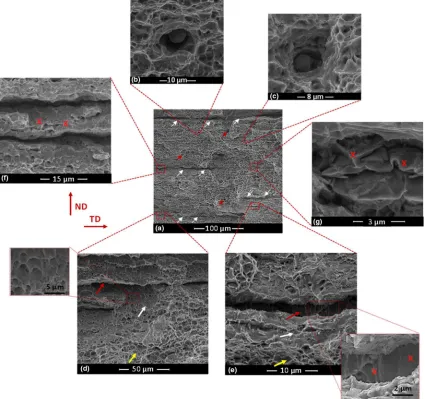
SEM micrographs of the fracture surface of the
sample are shown in Figure7. The most obvious
features seen in the lower magnification image
(Figure7(a)) are the fissures aligned with the transverse
direction. Some of these appear quite deep (indicated by white arrows) and several of them extend over the whole sample width (2 mm). The spacing in the thickness
direction between them varies from 40 to 100 lm. In
between the larger fissures, there is also a parallel
arrangement in surface topography giving the
impres-sion of layers aligned to the rolling plane (Figures7(d)
through (f)). These have a spacing of about 5lm, which
notably corresponds approximately to that of the microstructural bands of hard phases in region of
fracture shown in Figure6. Some of these linear features
are smaller fissures that are visible at higher
magnifications.
At the higher magnification (Figures7(b) through
(e)), it is clear that the fracture surface consists of 30 μm
RD
ND
(a)
(c)
(b)
A B
RD
TD RD
ND
(f)
20 μm 30 μm
(e)
(d)
30 μm
[image:8.594.103.532.36.509.2]dimples indicative of ductile rupture. The majority of
the dimples in the matrix are less than 5 lm in diameter
and relatively symmetrical. Even within the large fis-sures, there are small (<5 lm) dimples (Figure7(d) and
enlarged region) that are asymmetric, which is sugges-tive of shear. There are some larger dimples ranging in
size from 5 to 10 lm, many of which contain inclusions.
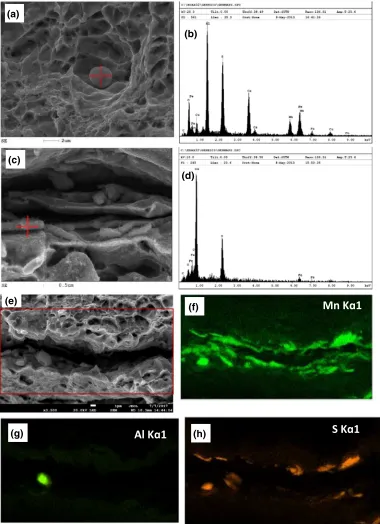
Most of these inclusions are spherical (Figures 7(b) and
(c)) and EDX analyses showed to contain significant
amounts of O, Al, and Ca (see Figures 8(a) through (b))
as well as Cu, Mn, and S, indicative of oxides and sulfides that are ubiquitous in steels.
It is not possible to identify or distinguish on the fracture surface the ferrite matrix and the hard phase islands. It can be reasonably assumed that all of the austenite in this TRIP near the rupture has transformed into high-carbon martensite. One might expect that this microstructure constituent would be recognizable on the surface as regions of classical transgranular brittle
fracture with the characteristic flat facets exhibiting river-lines. However, no such regions could be found in this fracture surface.
It is shown in Figures7(d) and (e) that there are
regions of the surface that are relatively smooth and free of dimples within (red arrows) and adjacent (white arrows) to the large fissures. Some studies have inter-preted such regions as brittle or cleavage failure.[21–23] However, the non-planar topography of these regions is more indicative of shear-band failure or ductile tearing at a crack tip. Such regions are indicated by X in the
enlarged region of Figure7(e).
The only obviously brittle topographic features were observed in some smaller fissures like that shown in
Figure7(g). Some of these are also visible lying on the
dimple-free regions in Figure7(e), but they are present
[image:9.594.67.492.39.438.2]Mn, and/or Cu K-alpha peaks (see Figures 8(c) through (d) for a Cu-S example), showing them to be sulfide inclusions (MnS/CuS). Such features are also ubiquitous in steels, especially those with relatively high Mn-levels and are thin (Mn,Cu)S stringers. EDX maps were made of some regions at the fissures such as that shown in
Figures8(e) through (g). These showed that while the
presence of S always correlated to presence of Mn, there were some regions where only Mn was measured. This
may be a consequence of the rough topography of the fracture surface interfering with the detection of a light element such as S.
In summary, there are three main features: ductile dimples within the matrix, micro-voids containing
inclusions (Figures7(b), (c), and (g)), and fissures at
the white-arrowed locations, extending into the sample from the fracture surface.
Mn K 1
(a)
(b)
(c)
(d)
(f)
(g)
Al K 1
(e)
S K 1
[image:10.594.126.506.36.560.2](h)
IV. DISCUSSION
While microstructure banding is a common feature of steels, the TRIP800 material studied here had initially a relatively homogeneous distribution of second-phase, albeit along the ferrite grain boundaries. The only feature resembling the classical type of banding was a more subtle structure described here as horizontal continuous grain boundary networks (CGBNs),
high-lighted in Figure6(c). CGBNs are probably like
con-ventional microstructure bands; in that, they are a consequence of chemical segregation in combination with the elongated austenitic grain morphology pro-duced in hot-rolling and annealing stages. In both the
in situ andpost-mortemobservations taken from differ-ent directions, the distribution of hard second-phases became so inhomogeneous with deformation that it could be described as banding. The importance of the horizontal CGBNs that were originally present is made
apparent by their correlation to the fracture surface
topography, which is apost-mortemaspect of this study.
However, it is the in situexperiments that give insights
to how and why these features have developed during the deformation and these results will be discussed first.
A. Strain Evolution at the Microstructural Level
The Digital Image Correlation results shown in
Figure4 reveal that the material forms macroscopic
bands of hard second-phases during tensile loading. This
is in agreement with the observations made in Figure6,
where the spacing between microstructural bands decreases due to the contraction of the sample in the thickness direction (i.e., ND).
Evaluation of the distribution and evolution for the minor strain component reveals that the mechanism of formation of these hard phase zones is primarily the
[image:11.594.86.468.39.455.2]lateral contraction of the soft ferrite phase (Figure4).
High compressive strains for the minor strain compo-nent are initially distributed within the ferritic regions
(Figures4(b) and (c)). This is also found in other studies
where the highest major strains are measured within the soft ferrite matrix.[14–17]These regions of high compres-sive straining spread to neighboring regions along the loading direction by rotating and aligning the hard phases adjacent to the large ferrite grains as shown in
Figures4(b) through (i). More specifically, the strain
patterns in regions 1 and 2 of Figure4(c) are interrupted
at the arrowed locations due to the presence of relatively large hard phase islands in line with the large ferrite regions. In order to accommodate plastic deformation and circumvent the hard phases impeding the further deformation of the ferrite matrix, the compressive strains divert towards different directions. This is favored by the formation of slip bands in the soft ferrite matrix at angles close to 45 deg with respect to the loading axis. Just before final failure, the soft ferrite matrix has displaced the hard phases and the minor strain fields have become aligned almost parallel to the
loading direction in Figure4(i). It is suggested here that
diverting the local strain fields is beneficial for the alloy, as more energy would be required to align the hard islands parallel to the loading direction, delaying further the onset of damage nucleation. Distributing the hard second-phases evenly within the matrix, not just along grain boundaries, but also within the interior of the ferrite grains, can increase the deformability of the alloy in tension.
At the last stage of the test, the regions of high
compressive strains in Figure4(i) extend throughout the
whole microstructural region in the loading direction. A ‘banded material flow’ can thus be transferred to much larger distances with respect to the local scale of the
micrograph (50 lm length) of Figure4(i). This is in
agreement with the findings from the mid-plane analysis
of Figure6(d), where it is shown that the hard phase
bands have voids as far as 100lm from the fracture
surface. It was observed (Figure 4(i)) that along the
horizontal axis, the strains were near-zero (0) along the hard second-phase bands, highly negative ( ) along the soft ferrite matrix and again near-zero (0). The obser-vations suggest the occurrence of localized plastic flow along the soft ferrite bands in contrast to the restricted deformation of the hard phase bands. Comparing the
two strain maps of Figures4(c) and (i), at the first stages
of plastic deformation the strain patterns appear more evenly distributed over the microstructure, while just before failure there is a well-defined strain distribution of compression-tension-compression alterations parallel to the loading axis.
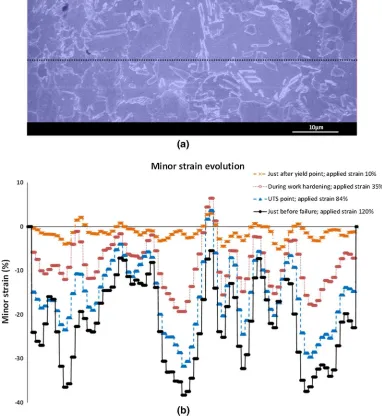
This is better illustrated in Figure9, where the
evolution of the minor strains along a line on the DIC
strain map in Figure 9(a) was obtained at four different
stages of the test. The evolution of the minor strains is
shown at four stages during the test in Figure9(b); just
after yielding (0.1), during work hardening (0.35), at UTS point (0.84) and just before failure (1.25). Even at the first stages of plastic deformation, the material has started forming microstructural bands. Most of the microstructural rearrangements occur during plastic
deformation up to the UTS point. Consequently, it is during work hardening that the material forms these bands by redistributing the phases in the matrix. This can be seen by the considerable increase of the com-pressive strains between the yield point and UTS point. It is suggested here that an optimization of the distri-bution of the hard phases in the matrix could potentially increase the deformation capability of the alloy. The tendency to form microstructural bands of hard sec-ond-phases could, in turn, be reduced, even from the first stages of plastic deformation.
Further plastic deformation of the soft ferritic regions leads to damage nucleation in between the hard phases and at the adjacent second-phase bands. The voids that formed in between these hard sec-ond-phases have an average spacing of 5 to 15 microns
between them along each band (Figure6(d)). There is a
sequence of damaged and undamaged regions along each band. This is in agreement with the major strain
distributions measured in Figure5. Alternating regions
of high and low major strains can be seen along and
adjacent to the hard phase bands (Figure5). This is
due to the fact that regions of high strain localizations and micro-void nucleation are interrupted by relatively low-strained undamaged regions. It is noted here the much higher maximum tensile strain values recorded
on the strain map (220 pct) in Figure5 in comparison
to maximum values up to 130 pct in DP steels recorded in other studies.[16,24] The higher local major strains of this TRIP steel can be related to the formation of the microstructural bands and the extensive shape changes
that take place within the soft ferritic regions
(Figures4(b), (d), (f), and (h)).
Comparing Figures4 and5for the minor and major
strain maps, it can be concluded that the latter does not reveal the banded material flow. The major strain distribution is similar to the strain maps shown in other studies on DP steels,[14–17]where the high major strains are oriented at an angle (close to 45 deg) with respect to the loading direction due to localized slip and shear bands.
In summary, the sequence of deformation and dam-age nucleation mechanisms, with reference to the macroscopic stress–strain curve, is as follows:
1. During the first stages of macroscopic plastic deformation, the ferrite matrix deforms and in particular elongates in a way that aligns the grain boundary networks of second-phases to the loading direction.
2. At the latter stages of work-hardening, the ferrite regions rotate along with the hard phases adjacent to them, in order to achieve further plastic defor-mation, which results in alternating bands of ferrite and hard second-phase. The DIC observations in Figure4 suggest that the alignment of the hard phases adjacent to the large ferrite grains facilitates plastic deformation in the ferritic matrix as there are no hard phases restricting plastic slip.
within the band, primarily occurring between co-joined hard second-phase islands.
B. Correlation to Mid-plane & Fracture Surface Analyses
The in situ experiments in conjunction with DIC measurements were all based on observations of the
rolling plane (TD-RD), but the post-mortem
observa-tions of the longitudinal cross section (ND-RD) also revealed microstructural banding. Some of this was already present before deformation, as seen in the
undeformed part of the sample (Figure 6(c)) as
hori-zontal CGBNs that probably formed during the
ther-momechanical processing of the material.[18] However,
by comparing the undeformed microstructure (region A)
with that of the heavily deformed (region B) in Figure 6,
the majority of this banding developed as a consequence of the deformation mechanisms described in the previ-ous section.
The CGBNs of hard second-phases play a critical role in damage nucleation and evolution. The voids shown in
Figure 6(d) suggest that damage can be transferred
along them, but it is the longer horizontal networks that were already exiting in the as-received material that are critical. These are already aligned with the loading axis and are the first to nucleate micro-voids as the adjacent ferrite matrix elongates. The early failure of these regions is revealed by voids observed along them as
far as 100lm from the fracture surface. This again is in
accordance with the observations from DIC, where the highly strained zones were found to extend over the
whole microstructural region in Figure 4(i), a length of
approximately 50 lm.
The low-magnification micrograph of the fracture surface shows that there was an array of features aligned
with TD with a spacing of about 5 lm. This corresponds
to the band interspacing of the re-aligned CGBNs at the deformation level near the fracture surface. On the basis of the width of the larger fissures that extend hundreds of micrometers to even almost the whole of the sample
(Figure 7(a)), it seems more likely that the pre-existing
horizontal CGBNs are responsible as opposed to inclusions. However, while the majority of inclusions were globular in shape, some were thin plates that would be good initiation sites and propagation paths. Thin-plate sulfide type inclusions were observed on some of the fissure surfaces, but since inclusions and CGBN’s are related to alloying micro-segregation, the co-location of both is expected. Nevertheless, the inclusions and the (spherical) voids that formed around them at and near
the fracture surface, were of the order of 5 to 15 lm and
thus, the length scale of the fissures and fracture surface topography (hundreds of micrometers) correlate better to pre-existing CGBNs.
Adjacent to and within the fissures, the matrix is sheared at a direction close to 45 deg with respect to the load direction. This can be seen from the increasing ductile dimple asymmetry toward the fissures, which is indicative that the direction for the local highest strains (and strain vectors) is different from the load vector and
is increasingly shear-like. This could be a result of the bands of hard phases changing the deformation mode of the intermediary ferritic matrix into localized plastic shear because of geometrical constrains.
The abovepost-mortem observations are taken from
the ND-RD cross section (SectionIII–D) and the
fracture surface (SectionIII–E), which is approximately
a ND-TD plane view. The shear process was also
observed in situ in the RD-ND plane view
(Sec-tionIII–C–1). In Figure5, it was found that next to the hard phase islands, slip bands formed at the yellow-arrowed location within the neighboring ferrite region, close to 45 deg with respect to the loading direction. The occurrence of damage nucleation is
shown more evidently in the top part of Figure5, which
shows micro-void nucleation in a network of small hard phases close to each other. Damage nucleation at the hard phase band is accompanied by deformation local-ization by slip band formation in the neighboring ferrite grain at an angle close to 45 deg with respect to the loading direction. It appears that damage nucleation within the network of hard phases is followed by shear deformation mechanisms within the neighboring ferrite matrix. This is due to the deformation mechanisms of the soft ferrite phase that occurs primarily by the formation of homogeneous plastic slip and inhomoge-neous plastic strain localization due to slip band formation. The latter occurs at angles close to 45 deg angle with respect to the loading direction which
decreases the size and number of dimples (Figure7(d)).
A key aspect of the mechanism described above is that it is predominantly the ferrite matrix that ultimately fails and propagates the final rupture and side fissures. This correlates to the absence of brittle features on the fracture surface, aside from inclusions, with the pre-dominance of ductile dimple rupture in tensile or shear mode and localized shear failure in the fissures. There have been other fractography investigations of DP and TRIP steels that have observed regions of cleavage facets,[25–29] but also studies[30–35] where the entire fracture surface consists of dimples. This study’s obser-vations correspond with those of the latter, such that either the ruptured martensite also exhibits ductile dimples or the fracture surface only results from the rupture of the ferrite matrix.
C. Summary
The damage initiation and evolution of the TRIP steel investigated are not fundamentally different to that of DP-steels. The first cracks and voids to form are associated with the hard phase in this TRIP steel, just as it is for DP-steels. Note that it is well established that in conventional TRIP steels, the majority of austenite transforms into martensite in the early stages of plastic deformation such that well before the UTS is reached, only a few volume percent remains. In the current study, aside from the initial microstructure, the microstructural
observations start a few percent before the UTS.[36–38]
No differential behavior was observed in different individual islands of hard phases and if austenite was
deformation behavior. Nevertheless, while a detailed characterization of microstructure constituents is not given here, it would be a useful separate study in itself, like that performed in related material.[39,40]
Despite the hard phase forming an almost contiguous network around the ferrite grains, the vast majority of the deformation occurred in the relatively soft ferrite matrix phase. The ferrite elongates in the direction of the loading direction while contracting laterally and in the thickness direction, due to plastic incompressibility. The lateral contraction of the soft ferrite phase leads to the formation of microstructure bands of soft ferrite phase adjacent to bands of hard second-phases. This results in strain localization and void formation along the CGBNs, particular those that were already present in the starting microstructure and aligned with the load axis. Voids formed in the ferrite between the hard phases and by fracture of the individual islands within the CGBNs. Void formation along the CGBNs is due to two mechanisms: the extensive elongation that occurs in the neighboring large ferrite grains and the strain localization in between the hard phases. Deformation during these stages propagates at an angle close to 45 deg with respect to the loading axis towards the neighboring ferrite matrix.
In the final stages leading to fracture, the voids along CGBNs coalescence to form fissures. The deformation mode becomes increasingly of shear-mode that leads to localized slip failure. It is likely that the fissures grow to the point that ductile rupture occurs between them.
The damage and final rupture mechanism described above may explain the observations in another investi-gation of two TRIP steel materials with and without banding. It was concluded that banding of martensite leads to the presence of massive ferrite regions that were thought to be more easily deformable with respect to geometrically constrained ferritic regions confined by hard martensite islands in the steel with non-banded
martensite morphology.[6]
V. CONCLUSIONS
In dual-phase microstructures consisting of a soft matrix and hard second-phases, banding may be inevitable due to the inhomogeneous deformation, even if it is not initially present. Only a subtle microstructural band of hard phases was observed in this as-received TRIP800, in the form of horizontal contiguous grain boundary networks, aligned with the rolling plane. Additional bands of hard phase and soft-phases aligned parallel to the loading direction developed during tensile deformation. This was a consequence of lateral con-traction of the soft ferrite phase. The pre-existing contiguous grain boundary networks of hard sec-ond-phases were of greater importance to final fracture than inclusions. These bands were where the first voids nucleated and grew along them at sufficient densities to coalesce and develop into fissures that eventually led to
final ductile rupture. It is suggested that minimizing the presence of CGBNs of hard second-phases in the initial microstructure will increase the formability.
ACKNOWLEDGMENTS
This research was carried out under Project Number M41.2.10398 in the framework of the Research Pro-gram of the Materials innovation institute—M2i (www.m2i.nl). The authors would also like to thank Tata Steel R&D, IJmuiden in the Netherlands for pro-viding the material of this study. PE and BAS would also like to thank funding from Engineering and Phys-ical Sciences Research Council (Grant EP/M014096/1).
OPEN ACCESS
This article is distributed under the terms of the Creative Commons Attribution 4.0 International License (http://creativecommons.org/licenses/by/4.0/), which permits unrestricted use, distribution, and reproduction in any medium, provided you give appropriate credit to the original author(s) and the source, provide a link to the Creative Commons license, and indicate if changes were made.
REFERENCES
1. G. Thomas and J.Y. Koo:Design of Duplex Low Carbon Steels for Improved Strength: Weight Applications, Lawrence Berkeley National Laboratory, Berkeley, 1977, p. 40.
2. M. Sarwar and R. Priestner: J. Mater. Sci., 1996, vol. 31, pp. 2091–95.
3. J.D. Verhoeven:J. Mater. Eng. Perform., 2000, vol. 9, pp. 286–96. 4. X.L. Cai, J. Feng, and W.S. Owen:Metall. Trans. A, 1985, vol. 16,
pp. 1405–15.
5. A.R. Marder:Metall. Trans. A, 1982, vol. 13, pp. 85–92. 6. A. Ramazani, H. Quade, M. Abbasi, and U. Prahl:Mater. Sci.
Eng. A, 2016, vol. 651, pp. 160–64.
7. J.H. Whitely:J. Iron. Steel. I., 1926, vol. 113, p. 213.
8. C.F. Jatczak, D.J. Girardi, and E.S. Rowland:Trans. ASM., 1956, vol. 48, pp. 279–305.
9. F.G. Caballero, A. Garcı´a-Junceda, C. Capdevila, and C.G. de Andre´s:Mater. Trans., 2006, vol. 47, pp. 2269–76.
10. A. Sakir Bor:ISIJ Int., 1991, vol. 31, pp. 1445–46. 11. R.A. Grange:Metall. Trans., 1971, vol. 2, pp. 417–26.
12. M. Mazinani and W.J. Poole: Metall. Mater. Trans. A, 2007, vol. 38A, pp. 328–39.
13. W.A. Spitzig:Metall. Trans. A, 1983, vol. 14, pp. 471–84. 14. H. Ghadbeigi, C. Pinna, and S. Celotto:Exp. Mech., 2012, vol. 52,
pp. 1483–92.
15. H. Ghadbeigi, C. Pinna, and S. Celotto:Mater. Sci. Eng. A, 2013, vol. 588, pp. 420–31.
16. H. Ghadbeigi, C. Pinna, S. Celotto, and J.R. Yates:Mater. Sci. Eng. A, 2010, vol. 527, pp. 5026–32.
17. J. Kang, Y. Ososkov, J.D. Embury, and D.S. Wilkinson: Scr. Mater., 2007, vol. 56, pp. 999–1002.
18. C.C. Tasan, J.P.M. Hoefnagels, and M.G.D. Geers:Scr. Mater., 2010, vol. 62, pp. 835–38.
19. S. Zaefferer, P. Romano, and F. Friedel: J. Microsc., 2008, vol. 230, pp. 499–508.
21. J.H. Kim, D. Kim, H.N. Han, F. Barlat, and M.G. Lee:Mater. Sci. Eng. A, 2013, vol. 559, pp. 222–31.
22. J. Samei, D.E. Green, J. Cheng, and M.S. de Carvalho Lima:
Mater. Des., 2016, vol. 92, pp. 1028–37.
23. J. Zhang, H. Di, Y. Deng, and R.D. Misra:Mater. Sci. Eng. A, 2015, vol. 627, pp. 230–40.
24. S. Hazra, P. Efthymiadis, D. Proprentner, B. Shollock, and R. Dashwood:Procedia Eng., 2017, vol. 207, pp. 1314–19.
25. Q. Lai, O. Bouaziz, M. Goune´, L. Brassart, M. Verdier, G. Parry, A. Perlade, Y. Bre´chet, and T. Pardoen:Mater. Sci. Eng. A, 2015, vol. 646, pp. 322–31.
26. H.S. Lee, B. Hwang, S. Lee, C.G. Lee, and S.J. Kim: Metall. Mater. Trans. A, 2004, vol. 35A, pp. 2371–82.
27. U. Donatus, K.K. Alanem, and M.I. Momoh:J. Phys. Sci., 2016, vol. 27, pp. 103–10.
28. S. Papaefthymiou, U. Prahl, W. Bleck, S. van der Zwaag, and J. Sietsma:Int. J. Mater. Res., 2006, vol. 97, pp. 1723–31.
29. U. Prahl, S. Papaefthymiou, V. Uthaisangsuk, W. Bleck, J. Sietsma, and S. van der Zwaag:Comput. Mater. Sci., 2007, vol. 39, pp. 17–22. 30. H. Ashrafi, M. Shamanian, R. Emadi, and N. Saeidi:Mater. Sci.
Eng. A, 2017, vol. 680, pp. 197–202.
31. B. Ravi Kumar, N.K. Patel, K. Mukherjee, M. Walunj, G.K. Mandal, and T. Venugopalan:Mater. Sci. Eng. A, 2017, vol. 685, pp. 187–93. 32. K.K. Chawla, P.R. Rios, and J.R.C. Guimara˜es: J. Mater. Sci.
Lett., 1983, vol. 2, pp. 94–98.
33. A. Das, M. Ghosh, S. Tarafder, S. Sivaprasad, and D. Chakrabarti:Mater. Sci. Eng. A, 2017, vol. 680, pp. 249–58. 34. A.G. Kalashami, A. Kermanpur, A. Najafizadeh, and Y.
Mazaheri:Mater. Sci. Eng. A, 2016, vol. 658, pp. 355–66. 35. A. Ramazani, A. Schwedt, A. Aretz, U. Prahl, and W. Bleck:
Comput. Mater. Sci., 2013, vol. 75, pp. 35–44.
36. B.L. Ennis, E. Jimenez-Melero, E.H. Atzema, M. Krugla, M.A. Azeem, D. Rowley, D. Daisenberger, D.N. Hanlon, and P.D. Lee:
Int. J. Plast., 2017, vol. 88, pp. 126–39.
37. H.N. Han, C.G. Lee, C.S. Oh, T.H. Lee, and S.J. Kim: Acta Mater., 2004, vol. 52, pp. 5203–14.
38. P. Jacques, Q. Furne´mont, A. Mertens, and F. Delannay:Philos. Mag. A, 2001, vol. 81, pp. 1789–1812.
39. R. Petrov, L. Kestens, A. Wasilkowska, and Y. Houbaert:Mater. Sci. Eng. A, 2007, vol. 447, pp. 285–97.
40. Y.F. Shen, L.N. Qiu, X. Sun, L. Zuo, P.K. Liaw, and D. Raabe: