Chapter 10
Measurements of Secondary Organic Aerosol (SOA) from
Oxidation of Cycloalkenes, Terpenes, and
m
-xylene using an
Aerodyne Aerosol Mass Spectrometer
*
* This chapter is reproduced with permission from “Measurements of Secondary Organic Aerosol (SOA)
10.1. Abstract
The Aerodyne Aerosol Mass Spectrometer (AMS) was used to characterize physical and chemical properties of secondary organic aerosol (SOA) formed during ozonolysis of cycloalkenes and biogenic hydrocarbons and photooxidation of m-xylene. Comparison of mass and volume distributions from the AMS and Differential Mobility Analyzers
yielded estimates of “effective” density of the SOA in the range of 0.64-1.45 g/cm3, depending on the particular system. Increased contribution of the fragment at m/z 44, CO2+ ion fragment of oxygenated organics, and higher “delta” values, based on ion series
analysis of the mass spectra, in nucleation experiments of cycloalkenes suggest greater contribution of more oxygenated molecules to the SOA compared to those formed under seeded experiments. Dominant negative “delta” values of SOA formed during ozonolysis of biogenics indicates presence of terpene derivative structures or cyclic or unsaturated oxygenated compounds in the SOA. Evidence of acid-catalyzed heterogeneous
chemistry, characterized by greater contribution of higher molecular weight fragments to the SOA and corresponding changes in “delta” patterns, is observed in the ozonolysis of
10.2. Introduction
Secondary organic aerosols (SOA) are a significant contributor to the total ambient organic aerosol loading in urban areas, as well as regionally and globally. Our
understanding of SOA formation processes and their chemical and physical properties is, however, limited. Better understanding of SOA is essential in order to accurately evaluate the impact of SOA on visibility, climate, and human health and to incorporate this
understanding in future regulations. Traditionally, controlled laboratory chamber experiments have been carried out to determine the SOA forming potential, i.e., organic yield, of volatile hydrocarbons that are, or have a chemical structure close to,
atmospherically relevant compounds (1-6).
Laboratory chamber experiments have been instrumental in identifying specific compounds formed as SOA. Recent studies have demonstrated the presence of polymeric structures in the SOA formed from both anthropogenic and biogenic hydrocarbon
precursors (7-11) . Formation of such polymeric structures has been suggested to occur by aerosol-phase reactions, possibly acid-catalyzed, such as aldol condensation, gem-diol reaction, and hemiacetal/acetal formation pathways (12). Oligomers have been identified in the SOA formed in both the presence and absence of inorganic acids (7,9) .
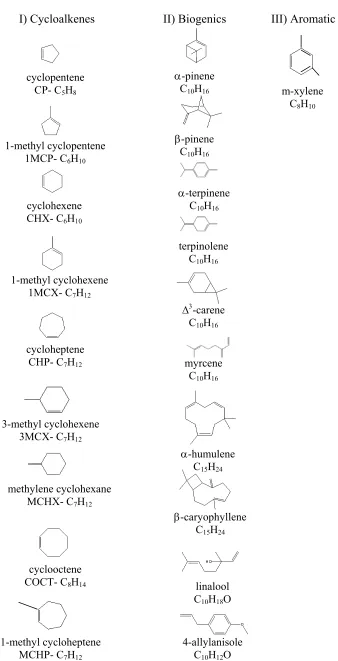
The current work summarizes studies of laboratory-chamber generated SOA using the AMS. A comprehensive series of experiments was conducted to study ozonolysis of cycloalkenes and biogenic precursors to investigate SOA physical and chemical characteristics and effect of heterogeneous reactions on SOA formation. In addition, photooxidation of m-xylene, a predominant SOA-forming anthropogenic hydrocarbon, was studied. Experiments were carried out in the absence or presence of seed particles of varying composition. Figure 10.1 gives the chemical structures of the precursors studied.
In order to compute a mass yield of SOA, it is necessary to know the SOA density since the volumetric yield is the quantity normally determined in chamber experiments. Estimates of the density of SOA have so far been based on the detailed chemical
speciation of the SOA. Because it has been traditionally difficult to identify the complete composition of SOA, the estimated density is uncertain because of the missing
10.3. Experimental
Experiments were conducted in Caltech’s indoor dual 28 m3 suspended FEP Teflon chambers (23). The AMS was used to measure size-resolved aerosol chemical
composition. A complete description of the AMS and its data analysis is given elsewhere
(13,14,24,25). In summary, sample (gas and particle phase) is introduced into the
differentially pumped chambers of the instrument through a 100 µm critical orifice. An aerodynamic lens system is used to collimate the particles into a narrow beam. A chopper wheel (~2% duty cycle) is used to chop the particle beam for “time of flight” mode measurements (i.e., P-TOF mass distribution measurements) or to block/clear the particle beam for “mass spectrum” mode measurements (MS). Upon impacting on the vaporizer (~650 °C), which is positioned at the end of the P-TOF chamber, the non-refractory components in/on the aerosols are vaporized, and the vapors are ionized under high vacuum by electron impact (70 eV). Positive ions are then extracted into the quadrupole mass spectrometer for determination of their mass-to-charge ratio (m/z).
The particle size calibration of the AMS was determined by sampling dry polystyrene latex (PSL) particles (Duke Scientific) and validated using DMA size-selected dry
ammonium nitrate and/or ammonium sulfate particles. Ionization efficiency calibration of the AMS, needed to determine the mass concentration of species from raw MS ion ignals, was performed on a regular basis by sampling DMA size-selected dry ammonium nitrate particles. Further details of these calibrations and the relevant calculations can be found elsewhere (14,24).
system includes a 85Kr neutralizer (TSI model 3077), a long cylindrical column differential mobility analyzer (DMA, TSI model 3081), and a condensation particle counter (CPC, TSI model 3760). The flow rates of the SEMS systems are controlled to 2.5 LPM for sheath and excess flows and 0.25 LPM for polydisperse and monodisperse aerosol flows. In addition, the total number concentration of particles in each chamber was measured by additional CPCs (TSI, models 3010 and 3025). A hygroscopic tandem differential mobility analyzer (HTDMA) was used in a number of experiments to determine the hygroscopic behavior of the SOA. Furthermore, bulk filter samples were collected for organic speciation analysis (9,11).
Gas-phase concentrations of parent hydrocarbons were measured by a gas
chromatograph with a flame ionization detector (GC-FID, Hewlett Packard model 5890, series II Plus). Ozone concentration was measured by a Horiba ambient O3 monitor
(model APOA-360 CE), and concentrations of nitrogen oxides were measured by a Horiba ambient NO-NO2-NOx monitor (model APNA-360). Temperature and humidity
of the chamber were also measured by Vaisala probes (HMP230 series transmitters). Details on calibration procedures of the above instruments are given elsewhere (6).
particles were also passed through a silica-gel diffusion drier before being introduced into the chamber.
The temperature in the chambers was maintained at 20 ± 2 °C. Relative humidity of the chamber was controlled by controlling the humidity of the flushing air. For dry experiments, chambers were flushed with dry-scrubbed air with RH < 10%. For humid experiments, dry-scrubbed air was passed through a bubbler and a particle filter before being introduced into the chamber at a rate such that the relative humidity achieved in the chamber at 20 °C was ~55 ± 5 %. During photooxidation studies, 300, 40 W each, 350- BL lights were used to illuminate the chambers (23).
Volatile hydrocarbons (Sigma Aldrich) were introduced as liquid samples into injection glass bulbs. The liquid was then heated gently in the bulb, and the vapors were carried to the chamber by passing scrubbed air through the bulb. During dark ozonolysis experiments, cyclohexane, used as the hydroxyl radical (OH) scavenger, was introduced into the chamber in a similar manner. The role of different OH scavengers in ozonolysis experiments, in terms of producing additional HO2 and RO2 radicals that may change the
cyclohexane was used as the scavenger during the experiments from which we report results. The concentration of cyclohexane injected for each experiment was based on the concentration of the parent hydrocarbon and reaction rates of the parent hydrocarbon and cyclohexane with OH radical such that 99% of the time cyclohexane, rather than the parent hydrocarbon, would react with the OH radical.
During photooxidation studies, NO (502 ppm in nitrogen, Scott-Marrin Inc.), NO2
(521 ppm in nitrogen, Air Liquide), and propene (500 ppm in nitrogen, Air Liquide) were injected into the chamber.
Concentrations of the parent hydrocarbon and the seed- in the case of seeded
experiments- or NOx levels- in the case of photooxidation experiments- were monitored
for at least 1 h to ensure stability of the system before start of the reaction. Start of the reaction in ozonolysis studies was marked by ozone injection using a UV lamp ozone generator (EnMet Corporation). Ozone injection continued until the concentration of ozone exceeded by a factor of two or three the initial hydrocarbon concentration, depending on the experiment, to ensure full oxidation. During photooxidation
experiments, turning on the chamber’s UV source lamps marked the beginning of the reaction.
10.4. Determination of SOA Density and Morphology
systematically undetected. Comparing parallel AMS mass distribution measurements and DMA volume distributions provides an estimate of aerosol effective density (21,29,30). The AMS mass distribution is measured vs. vacuum aerodynamic diameter (dva) whereas DMA volume distribution is measured vs. electrical mobility diameter (dm). The vacuum aerodynamic diameter is the diameter of a sphere, in the free molecular regime, with unit density (1 g/cm3) and the same terminal velocity as the particle of interest. The mobility diameter is the diameter of a sphere with the same migration velocity of the particle of interest in a constant electric field at atmospheric pressure. These two measures of particle size are related by “effective density” (ρeff) or “material density” (ρm) as follows:
(1)
)
(
)
(
C
3c 0
m c v t
ve m
m va eff
d
C
d
d
d
χ
χ
δ
ρ
ρ
ρ
=
=
where ρ0 is unit density (1 g cm-3), Cc is the Cunningham slip correction factor, dve is the
volume equivalent diameter, δisthe internal void fraction,χt is the dynamic shape factor
in the transition regime, and χv is the dynamic shape factor in the free molecular regime
(30). Note that several other definitions of effective densities are used in the literature; these definitions are equivalent for spherical particles but can be significantly different when particles are irregular (30). When comparing AMS and DMA aerosol mass distributions in order to deduce the SOA density, only the rising edge of the small-size bins of the distributions was considered for the following reasons: (1) transmission efficiency in the AMS is 100% for 100-500 nm particles (P. Liu, University of Wyoming, unpublished data) (13), which is also the size range of interest; (2) during some
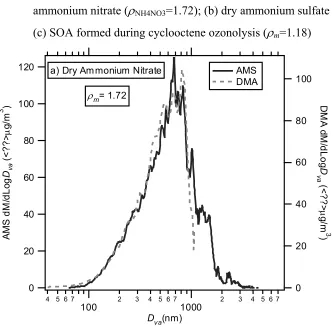
nucleation experiments, nucleated particles grew to sizes larger than the scan-range of the DMA, thus limiting the comparison only to smaller sizes. As shown in Figures 10.2a-10.2b, this comparison has been proven successful to better than ±10% for ammonium nitrate and ammonium sulfate aerosols. During seeded experiments, the estimates of ρeff
andmass concentration measurements of the seed and SOA (mseed and mSOA) were used along with the assumption of unit dynamic shape factor (χ = 1, i.e., particle sphericity) to determine density of SOA (ρSOA) based on the following relationship which also assumes
volume additivity:
(2)
SOA SOA seed
seed
SOA seed
SOA seed
SOA seed
eff
m
m
m
m
V
V
m
m
ρ
ρ
ρ
+
+
=
+
+
=
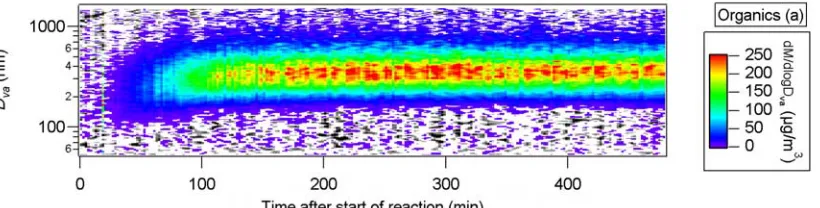
Typical evolution of the SOA concentration and mass distribution during an experiment is shown in Figures 10.3a-10.3c; condensation of secondary organics onto the seed causes a shift in the mass distribution of the seed and SOA to larger sizes. During this growth, the width of the mass distribution decreases, indicating condensation is the main mechanism of growth. Although particle loss to the chamber walls is also expected to narrow the mass distribution, analysis of mass distributions obtained during “wall-loss experiments”, where the loss rate of the seed particles to the chamber walls is
characterized, indicates that the width of the distributions does not change appreciably for durations typical of SOA experiments.
Information about morphology of the aerosols can be deduced by comparing the sulfate signal before and after start of the reaction during seeded experiments.
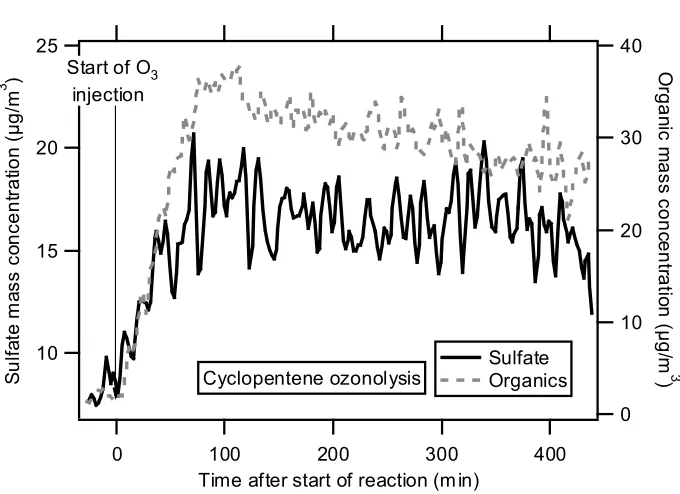
dry and less volatile particles off of the AMS vaporizer (T. Onasch, Aerodyne Research, Inc., personal communication). It has been observed that collection efficiency of ambient particles increases once the AMS inlet temperature approaches the ambient dew point and particles deliquesce and become liquid droplets (16). A similar phenomenon is observed here as SOA condenses on the seed aerosol during the first stages of the reaction. Figure 10.4 shows the time trend of mass concentration of sulfate and organics for cyclopentene ozonolysis; the sulfate signal increases by a factor of ~2 once ozone injection, and
consequently SOA formation starts. As discussed subsequently, this phenomenon was not observed with oxidation of all hydrocarbons, which suggests different particle phases (liquid vs. solid) within the AMS vacuum conditions for the SOA formed from different precursors.
10.5. Analysis of Organics
can fragment at different positions, giving rise to mass spectra in which groups of peaks are separated by 14 amu units (for saturated chains). The m/z’s measured for a given compound are an indication of the functional groups in the molecule. A delta value (∆ =
m/z – 14n + 1, where n is the “nominal” number of CH2 groups left on the functional
group) is calculated for each m/z, which is an indication of the functionality of the fragment. For example, it is observed that unsaturated organics and aromatics yield ∆
values <=0 while oxygenated organics yield ∆ values >=2 (31). Although more details will be discussed subsequently, it is worth noting that the SOA generated by the various systems studied here show very different characteristics based on ion series analysis. The patterns determined in chamber experiments can be used in interpreting mass spectra obtained by AMS from ambient aerosols and help provide a better understanding of the main precursors of ambient SOA.
10.6. Results and Discussion
10.6.1. Dark Ozonolysis of Cycloalkene Precursors
A series of experiments with C5-C8 cycloalkenes was conducted in order to
investigate the effect of the parent hydrocarbon structure, such as position of the double bond or a methyl substituent, on SOA yield and other physical and chemical properties of SOA (6). These experiments were conducted in the presence of ammonium sulfate seed as well as in the absence of any seed.
condensation of SOA on the seed particles, such that the probability of bounce of organic-coated seed particles on the vaporizer decreased and thus collection efficiency increased.
The effective density of SOA was determined as described in Section 3 and is
tabulated in Table 2. Since the organic phase appears to be liquid, it was assumed that the particles are spherical, and thus the effective density should be a good estimate of the true material density. On average, ρSOA was 1.10±0.04 g/cm3during seeded experiments in
contrast to 1.39±0.05 g/cm3 during nucleation experiments with similar precursor
concentrations. The fact that density of the SOA formed during nucleation experiments is ~25% higher than that of SOA formed during seeded experiments may suggest that either the particles sampled during seeded experiments are not spherical or the chemistry leading to the presence of organics in the aerosol phase is different under the two systems, such that it leads to formation of denser organic species during nucleation experiments. As shown in Figure 10.5 as an example, the fragments that are dominant for oxygenated organics, mainly CnH2n-1O2+fragments with ∆ = 4 and CO2+ fragment (m/z
44) from thermal decomposition of oxygenated organics on the AMS vaporizer, indeed contribute to a greater extent to the total SOA mass for nucleation-generated SOA of cycloheptene.
Consistent observations of increased ion signal intensities of organic acids in the SOA during nucleation experiments have also been made in the ozonolysis of α-pinene by ion trap mass spectrometry (electrospray ionization source, direct infusion injection of the SOA sample). Although this observation was made in a different system (ozonolysis of
AMS observations presented here. For example, it is seen in the negative-ion mode mass spectra in Figure 10.6 that ion signals at m/z 171, 185, and 199 (corresponding to norpinic acid, pinic acid, and hydroxy pinonic acid, respectively, and likely their isomers- all gas phase oxidation products) increase by 50%, 24%, and 130%, respectively, in the
nucleation experiment (Figure 10.6b) compared to the non-acid seeded one (Figure 10.6a). It is also seen in Figure 10.6b that ion signal intensities of some oligomers (m/z
299, 357, and 399) increase by at least 25% in the nucleation experiment, which may explain in part its higher SOA yield compared to that in the non-acid seeded experiment (11).
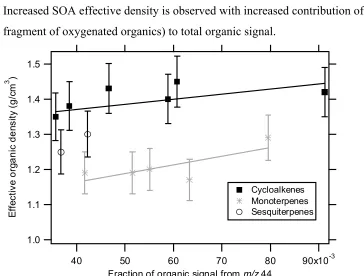
There is a trend of increasing SOA effective density with increasing contribution of
m/z 44 to the total organic signal in the oxidation of many of the hydrocarbon precursors studied here (Figure 10.7). Although it is not possible to rule out completely the
possibility of shape effects on lower estimates of SOA effective density during seeded experiments, the AMS mass spectra provided the evidence that there is an increased contribution of more oxygenated organics, which are generally denser, to the total SOA during nucleation experiments.
During the course of the cycloalkene ozonolysis experiments, the specific features of the organic mass spectra did not exhibit much change in time, as shown in Figures 10.3d-10.3e, except for increase in absolute intensity of organic peaks relative to the sulfate peaks.
10.6.2. Dark Ozonolysis of Biogenic Precursors
produced is such that the seed signal decreased after the start of condensation of organics, indicating less efficient collection of SOA-coated sulfate particles. One possible
explanation is that the SOA formed during ozonolysis of biogenics is in solid-phase under the vacuum conditions of the AMS; therefore, there is a greater probability of bounce of these SOA-coated particles on the AMS vaporizer. For example, it is shown in Figure 10.8 that after start of condensation of SOA from ozonolysis of linalool, the sulfate signal of the seed decreased by ~26%, which cannot be explained only by particle loss to the walls.
The effective density of SOA formed from ozonolysis of biogenic hydrocarbons was calculated following the method outlined in Section 3. Since the particles are likely in solid phase within the AMS and potentially non-spherical, the estimated densities are a lower bound of the true material densities (30). On average, biogenically derived SOA have lower “effective” densities compared to the SOA formed from nucleation-oxidation of cycloalkenes (Table 3), which may be due to real differences in material density as well as shape effects.
The biogenic precursors studied here showed distinct characteristics in the ion series pattern when compared to those of cycloalkene and m-xylene SOA. Generally, fragments in different m/z ranges exhibit different patterns of delta values. Here, three categories with different fragment size, with the nominal ranges of C1-C4, C5-C6, and C7-C15, are
considered since the delta patterns shift from fragments of C1-C4 category to those of C7
-C15. As shown in Figure 10.9, the larger fragments of SOA from biogenic precursors
however, the backbone of terpinolene molecule is more similar to that of a methylene-substituted cycloalkene. Thus, it is not surprising that the fragmentation pattern of SOA formed from terpinolene ozonolysis is closer to that of SOA formed from ozonolysis of cycloalkenes. Dominant negative delta values are indicative of organic molecules that are terpene derivatives or have unsaturated or cyclic oxygenated structures.
The bicyclic compounds studied here, namely α-pinene, β-pinene, and ∆3-carene,
have similar average delta values for larger fragment sizes, as shown in Figure 10.9, due to the similarity in their structures. A quite different precursor studied was 4-allylanisole, the SOA from which exhibits a very dominant low ∆ value in its fragmentation pattern. We conclude that the benzyl fragment (m/z 77, ∆ = -6) and CH3OC6H4CH2+ fragment
(m/z 121, ∆ = -4) are the dominant contributors to the low average ∆ values. Among all the biogenic precursors studied here, the SOA formed from ozonolysis of linalool exhibits the smallest contribution of larger fragments to the total SOA mass (only 4.5% from C7-C15 fragments). Because of the chemical structure and position of the double
bonds in linalool, it is suspected that the primary ozonolysis products of linalool are only small-oxygenated molecules that only partition into the aerosol phase to a small extent. This hypothesis is further supported by low SOA yield observed for linalool. It is also interesting to note that the SOA formed from linalool yielded the lowest estimate of effective density of all systems studied, which may suggest the growth of somewhat non-spherical or porous particles. During the oxidation of biogenic precursors that have similar molecular weight and similar structures, namely α-pinene, ∆3-carene, α-terpinene,
that have greater organic yields also contain greater amounts of larger organic molecules, and possibly have a higher contribution of oligomeric structures (or of molecules that are more resistant to fragmentation) to the total SOA mass.
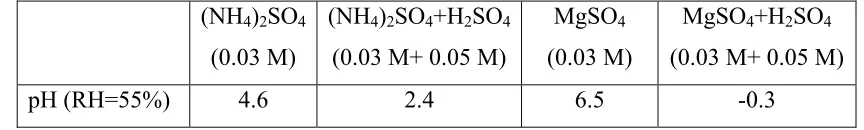
It is suspected that the reactions leading to formation of higher molecular weight SOA species are catalyzed in the presence of acids or bases (9,12). In order to assess the effect of seed particle acidity on SOA formation, α-pinene ozonolysis was carried out in the presence of both neutral and acidic ammonium sulfate seed as well as magnesium sulfate seed. The choice of these seeds allowed the study of the effect of seed type and pH on possible aerosol-phase reactions. The pH values of the bulk solutions from which the seeds were prepared from (at 55% relative humidity) are tabulated in Table 4 (9). During acid runs, sulfate fragmentation patterns in the mass spectra were analyzed to ascertain the acidity of the seed. Sulfate fragmentation patterns for pure and acidic ammonium sulfate were very similar since the most probable form of the anion in both systems is bisulfate. However, during acid MgSO4 experiments, at least an order of
magnitude increase in signals at fragments that are dominant for H2SO4, namely m/z 81
(HSO3+) and m/z 98 (H2SO4+), relative to the SO+ fragment was observed.
weight species in the SOA or presence of molecules that are more resistant to
fragmentation. The difference between experiments with ammonium sulfate and acidic ammonium sulfate is statistically insignificant. In addition, the fragmentation patterns of SOA, analyzed with the time series of delta values, during these experiments are very similar. This can be explained since the pH difference between the ammonium sulfate and acidic ammonium sulfate solutions used is only ~2.2,and thus the sensitivity of the two systems to acid-catalyzed reactions is not significantly different. The contribution of larger organic fragments to the organic mass increased, however, by 13% in the presence of acidic MgSO4 seed as compared to pure MgSO4 seed. This indicates that
acid-catalyzed heterogeneous reactions that form high molecular weight species occur to a larger extent in the presence of acidic MgSO4 seed, leading to a greater contribution of
larger fragments to the total organic mass. Similar observations have been made during these experiments in terms of the percentage of increased organic yield of α-pinene in the presence of ozone and the same pairs of seed: presence of sulfuric acid with MgSO4 seed
led to an increased organic yield of 7-15%, while presence of sulfuric acid with ammonium sulfate seed led to an increased yield of <5% (9). Because of slower evaporation of the MgSO4 (neutral or acidic) seed on the AMS vaporizer compared to
ammonium sulfate, and to avoid build up of the salt on the vaporizer, the vaporizer temperature was increased to ~750 °C during experiments with MgSO4 seed. Since
of polymerization compared to pure MgSO4 seed cannot be inferred from Figure 10.10
because the AMS vaporizer was operated at a higher temperature with MgSO4 seed and
thus shifted the fragmentation of SOA towards smaller fragments.
Differences of fragmentation patterns are observed, as shown in Figure 10.11. For example, the contribution of ∆ = -1 and ∆ = 3 during acid MgSO4 runs is lower while that
of ∆=0 is higher when comparing to the non-acid MgSO4 runs (Figure 10.11a). These
variations are consistent with suggested catalyzed reaction mechanisms, e.g., acid-catalyzed gem-diol reactions as well as acid dehydration of monomers in α-pinene ozonolysis. Polymerization through gem-diol reaction involves the reaction of hydroxyl and carbonyl groups of monomers. Such reaction of α-pinene oxidation products that still contain one of the cyclic structures of α-pinene would result in a lower contribution of
∆ = -1 patterns to the oligomers. Acid dehydration in the aerosol phase would also lead to less contribution of organic acids/diacids to the total organic mass, and therefore less contribution of m/z 44 (CO2+ion fragment) and ∆ = 3 to the total organic signal. Figure
10.11b shows the correlation of the reduction in ∆ = 3 fragments with decrease in CO2+
10.6.3. Photooxidation of m-xylene
The photooxidation of m-xylene was studied in the presence of pure and acidic ammonium sulfate seed, 45 ppb of NO, 15 ppb of NO2, and 240 ppb of propene. Due to
the nature of photooxidation experiments, i.e., simultaneous reactions in the two chambers with different seed aerosols, the AMS sampled alternatively from each chamber. In contrast to the morphology of SOA formed during cycloalkene ozonolysis but similar to biogenic SOA, SOA condensed on the seed during m-xylene
photooxidation caused the sulfate seed signal to decrease, indicating poorer collection efficiency of the seed after SOA condensation, likely due to formation of solid phase SOA under the AMS vacuum conditions.
Figure 10.12 shows the evolution of the contribution of different ion series to the total organic signal during the experiment. Similar to pure ammonium sulfate and acidic ammonium sulfate experiments with α-pinene, there is little variation between the two seed types. Unlike ozonolysis of α-pinene, however, the contribution of ∆ = 3 increased by ~16% and ~30%, during non-acid and acid experiments, respectively, over a similar time period after the start of reaction, as did the contribution of organic signal from m/z
44 (CO2+ ion fragment), indicating a more prolonged oxidation process of the organics
during the photooxidation study (Figure 10.12b).
Previous work on the composition of SOA formed under low-humidity
photooxidation of m-xylene identified 3-methyl-2,5-furandione, m-toluic acid, and 2,5-furandione together with some nitrophenol compounds as the dominant species,
consistent with presence of 2,5-furandione and 3-methyl-2,5-furandione (Figure 10.13). Based on the contribution of m/z 68 to the total organic signal while sampling from the chamber and for pure 3-methyl-2,5-furandione during an off-line calibration procedure, the estimated mass of 3-methyl-2,5-furandione in m-xylene experiment was at most ~6 % of the total organic mass. It is not possible though to compare this estimate directly with that of Forstner et al. (33) because of the following reasons: (1) the humidity levels in the two sets of experiments are not the same; this is an important factor to consider since anhydrides tend to form carboxylic acids in the presence of water molecules (34); (2) percentage of the identified mass relative to total SOA mass has not been reported by Forstner et al. Also shown in Figure 10.13 are the time trends of fragments at m/z 30 and 46, two dominant fragments of nitrate. The increased signal intensity of these fragments after start of the reaction is consistent with the presence of nitro compounds in the SOA. The mass of 2,6-dimethyl-4-nitrophenol, identified in previous photooxidation studies of
m-xylene, was estimated to be at most ~2% of the total organic mass based on the contribution of m/z 137 and 167 fragments to the total organic signal during an off-line calibration of pure 2,6-dimethyl-4-nitrophenol by the AMS. Although care has been taken to use fragments that do not have signal contributions from known inorganic compounds, the calculated contributions of 3-methyl-2,5-furandione and 2,6-dimethyl-4-nitrophenol to the total organic mass may be overestimated since some other organic species may also fragment at the masses used in these calculations.
10.7. Common Features in Different Systems
produce roughly similar mass spectra in the AMS. Organic mass spectra obtained from oxidation of α-pinene, m-xylene, and cyclopentene are compared in Figure 10.14 with those obtained in the ambient, sampling Ohio background pollution, measured airborne during Aug. 2004, Cleveland, OH pollution, obtained on the ground at the Cleveland International Airport during Aug. 2004, and brush-fire plumes, obtained in the vicinity of Monterey, CA during July 2003. All the ambient samples are dominated by signals at m/z
18 and 44 (similar to m-xylene and cyclopentene) and yet there is significant contribution from fragments at m/z 27, 29, 41, 43, and 55 in all cases. Furthermore, ambient mass spectra show a more dominant feature at m/z 57 compared to chamber-derived SOA, indicating greater presence of the alkyl groups in the ambient organic aerosols. The mass spectrum of the brush-fire plume also indicates signals at m/z 67 and 69, similar to that of
α-pinene, which are common for unsaturated hydrocarbons, unsaturated alcohols, or unsaturated carbonyl groups.
∆=0, 2, and 3 has been observed in the organic mass spectra obtained during other ambient studies (17,35). The average delta values of different size fragments from ambient organic mass spectra are compared in Figure 10.16. Commonly, the larger fragments exhibit negative average delta values, indicating dominance of unsaturated, aromatic, or cyclic structures, while the smaller fragments have positive delta values, indicating dominance of more saturated and oxygenated structures.
In previous studies with the AMS, fragments at m/z 44 (CO2+ fragment of oxygenated
organics) and m/z 57 (common fragment of alkyl groups) have been identified as
indicators for oxygenated and hydrocarbon-like organic aerosols, respectively ( 14,19,36-38). Keeping in mind that the spectra obtained in chamber studies are all SOA spectra, for comparison purposes and as a reference, the relative contributions of these fragments to the total organic mass in several systems studied here are presented in Table 5.
10.8. Acknowledgement
10.9. References
(1) Pandis, S. N.; Paulson, S. E.; Seinfeld, J. H.; Flagan, R. C. Aerosol formation in the photooxidation of isoprene and b-pinene. Atmospheric Environment, 1991, 25(5-6), 997-1008.
(2) Hoffmann, T.; Odum, J. R.; Bowman, F. M.; Collins, D.; Klockow, D.; Flagan, R. C.; Seinfeld, J. H. Formation of organic aerosols from the oxidation of biogenic
hydrocarbons. J. of Atmospheric Chemistry, 1997, 26(2), 189-222.
(3) Odum, J. R.; Jungkamp, T. P. W.; Griffin, R. J.; Flagan, R. C.; Seinfeld, J. H. The atmospheric aerosol-forming potential of whole gasoline vapor. Science, 1997,
276(5309), 96-99.
(4) Odum, J. R.; Jungkamp, T. P. W.; Griffin, R. J.; Forstner, H. J. L.; Flagan, R. C.; Seinfeld, J. H. Aromatics, reformulated gasoline, and atmospheric organic aerosol formation. Environ. Sci. Technol., 1997, 31(7), 1890-1897.
(5) Griffin, R. J.; Cocker, D. R.; Flagan, R. C.; Seinfeld, J. H. Organic aerosol
formation from the oxidation of biogenic hydrocarbons. J. Geophys. Res., 1999, 104(D3), 3555-3567.
(6) Keywood, M. D.; Varutbangkul, V.; Bahreini, R.; Flagan, R. C.; Seinfeld, J. H. Secondary organic aerosol formation from the ozonolysis of cycloalkenes and related compounds. Environ. Sci. Technol., 2004, 38, 4157-4164.
(7) Kalberer, M.; Paulsen, D.; Sax, M.; Steinbacher, M.; Dommen, J.; Prevot, A. S. H.; Fiesseha, R.; Weingartner, E.; Frankevich, V.; Zenobi, R.; Baltensperger, U.
Identification of polymers as major components of atmospheric organic aerosols. Science,
(8) Limbeck, A.; Kulmala, M.; Puxbaum, H. Secondary organic aerosol formation in the atmosphere via heterogeneous reaction of gaseous isoprene on acidic particles.
Geophys. Res. Letter, 2003, 30(19), 1996, doi:1910.1029/2003GL017738.
(9) Gao, S.; Ng, N. L.; Keywood, M.; Varutbangkul, V.; Bahreini, R.; Nenes, A.; He, J.; Yoo, K. Y.; Flagan, R. C.; Seinfeld, J. H. Particle phase acidity and oligomer
formation in secondary organic aerosol. Environ. Sci. Technol., 2004, doi:
10.1021/es049125k.
(10) Tolocka, M. P.; Jang, M.; Ginter, J. M.; Cox, F. J.; Kamens, R. M.; Johnston, M. V. Formation of oligomers in secondary organic aerosol. Environ. Sci. Technol., 2004,
38, 1428-1434.
(11) Gao, S.; Keywood, M.; Ng, N. L.; Surratt, J.; Varutbangkul, V.; Bahreini, R.; Flagan, R. C.; Seinfeld, J. H. Low-molecular-weight and oligomeric components in secondary organic aerosol from the ozonolysis of cycloalkenes and a-pinene. J. Phys
Chem., 2004, 10.1021/jp047466e.
(12) Jang, M.; Czoschke, N. M.; Lee, S.; Kamens, R. M. Heterogeneous atmospheric aerosol production by acid-catalyzed particle-phase reactions. Science, 2002, 298, 814-817.
(13) Jayne, J. T.; Leard, D. C.; Zhang, X.; Davidovits, P.; Smith, K. A.; Kolb, C. E.; Worsnop, D. W. Development of an Aerosol Mass Spectrometer for size and composition analysis of submicron particles. Aerosol Science and Technology, 2000, 33, 49-70.
Ambient aerosol sampling with an Aerosol Mass Spectrometer. J. Geophys. Res., 2003,
108(D7), 8425, doi:8410.1029/2001JD001213.
(15) Bahreini, R.; Jimenez, J. L.; Wang, J.; Flagan, R. C.; Seinfeld, J. H.; Jayne, J. T.; Worsnop, D. R. Aircraft-based aerosol size and composition measurements during ACE-Asia using and Aerodyne aerosol mass spectrometer. J. Geophys. Res., 2003, 108(D23), 8645, doi:8610.1029/2002JD003226.
(16) Allan, J. D.; Bower, K. N.; Coe, H.; Boudries, H.; Jayne, J. T.; Canagaratna, M. R.; Millet, D. B.; Goldstein, A. H.; Quinn, P. K.; Weber, R. J.; Worsnop, D. R.
Submicron aerosol composition at Trinidad Head, California, during ITCT 2K2: Its relationship with gas phase volatile organic carbon and assessment of instrument performance. J. Geophys. Res., 2004, 109(23), D23S24, doi:10.1029/2003JD004208. (17) Drewnick, F.; Schwab, J. J.; Jayne, J. T.; Canagaratna, M.; Worsnop, D. R.; Demerjian, K. L. Measurements of ambient aerosol composition during PMTACS-NY 2001 using an aerosol mass spectrometer. Part I: Mass Concentrations. Aerosol Science
and Technology, 2004, 38(S1), 92-103.
(18) Drewnick, F.; Schwab, J. J.; Jayne, J. T.; Canagaratna, M.; Worsnop, D. R.; Demerjian, K. L. Measurements of ambient aerosol composition during PMTACS-NY 2001 using an aerosol mass spectrometer. Part II: Chemically speciated mass
distributions. Aerosol Science and Technology, 2004, 38(S1), 104-117.
(19) Zhang, Q.; Stanier, C. O.; Canagaratna, M.; Jayne, J. T.; Worsnop, D. R.; Pandis, S. N.; Jimenez, J. L. Insights into the chemistry of nucleation bursts and new particle growth events in Pittsburgh based on aerosol mass spectrometry. Environ. Sci. Technol.,
(20) O'Dowd, C. D.; Jimenez, J. L.; Bahreini, R.; Flagan, R. C.; Seinfeld, J. H.; Hameri, K.; Pirjola, L.; Kulmala, M.; Jennings, S. G.; Hoffmann, T. Marine aerosol formation from biogenic iodine emissions. Nature, 2002, 417, 632-636.
(21) Jimenez, J. L.; Bahreini, R.; Cocker, D. R.; Zhuang, H.; Varutbangkul, V.; Flagan, R. C.; Seinfeld, J. H.; O'Dowd, C. D.; Hoffmann, T. New Particle Formation from Photooxidation of Diiodomethane (CH2I2). J. Geophys. Res., 2003, 108(D10), 4318,
doi:4310.1029/2002JD002452.
(22) Alfarra, M. R.; Paulsen, D.; Gysel, M.; Garforth, A. A.; Dommen, J.; Prevot, A. S. H.; Worsnop, D. R.; Baltensperger, U.; Coe, H. A mass spectrometric study of secondary organic aerosols formed from the photooxidation of anthropogenic and biogenic precursors in a reaction chamber. Submitted to Environ. Sci. Technol., Oct. 2004.
(23) Cocker, D. R.; Flagan, R. C.; Seinfeld, J. H. State-of-the-art chamber facility for studying atmospheric aerosol Chemistry. Environ. Sci. Technol., 2001, 35, 2594-2601. (24) Allan, J. D.; Jimenez, J. L.; Coe, H.; Bower, K. N.; Williams, P. I.; Worsnop, D. R. Quantitative sampling using an Aerodyne Aerosol Mass Spectrometer. Part 1: Techniques of data interpretation and error analysis. J. Geophys. Res., 2003, 108(D3), 4090, doi:4010.1029/2002JD002358.
(26) Wang, S. C.; Flagan, R. C. Scanning electrical mobility spectrometer. J. Aerosol
Science, 1989, 20(8), 1485-1488.
(27) Keywood, M. D. K.; Kroll, J. H.; Varutbangkul, V.; Bahreini, R.; Flagan, R. C.; Seinfeld, J. H. Secondary Organic Aerosol Formation from Cyclohexene Ozonolysis: Effect of OH Scavenger and the Role of Radical Chemistry. Environ. Sci. Technol., 2004,
38(12), 3343-3350.
(28) Docherty, K. S.; Ziemann, P. J. Effects of stabilized Criegee intermediate and OH radical scavengers on aerosol formation from reactions of beta-pinene with O-3. Aerosol
Science and Technology, 2003, 37(11), 877-891.
(29) Jimenez, J. L.; Bahreini, R.; Cocker, D. R.; Zhuang, H.; Varutbangkul, V.;
Flagan, R. C.; Seinfeld, J. H.; O'Dowd, C. D.; Hoffmann, T. New particle formation from photooxidation of diiodomethane (CH2I2). J. Geophys. Res., 2003, 108(D23), 4733, doi:4710.1029/2003JD004249.
(30) DeCarlo, P.; Slowik, J. G.; Worsnop, D. R.; Davidovits, P.; Jimenez, J. L. Particle morphology and density characterization by combined mobility and aerodynamic
measurements. Part 1: Theory. Aerosol Science and Technology, 2004, 38(DOI:
10.1080/027868290903907), 1185–1205.
(31) McLafferty, F. W.; Turecek, F. In Interpretation of Mass Spectra; University Science Books: Sausalito, CA, 1993.
(33) Forstner, H. J. L.; Flagan, R. C.; Seinfeld, J. H. Secondary organic aerosol from the photooxidation of aromatic hydrocarbons: molecular composition. Environ. Sci.
Technol., 1997, 31, 1345-1358.
(34) Koehler, C. A.; Fillo, J. D.; Ries, K. A.; Sanchez, J. T.; Haan, D. O. D. Formation of secondary organic aerosol by reactive condensation of furandiones, aldehydes, and water vapor onto inorganic aerosol seed particles. Environ. Sci. Technol., 2004, 38, 5064-5072.
(35) Schneider, J.; Borrmann, S.; Wollny, A. G.; Blasner, M.; Mihalpoulos, N.; Oikonomou, K.; Sciare, J.; Teller, A.; Levin, Z.; Worsnop, D. R. Online mass
spectrometric aerosol measurements during the MINOS campaign (Crete, August 2001).
Atmos. Chem. Phys., 2004, 4, 65-80.
(36) Zhang, Q.; Alfarra, M. R.; Worsnop, D. R.; Allan, J. D.; Coe, H.; Canagaratna, M. R.; Jimenez, J. L. Deconvolution and quantification of primary and oxygenated organic aerosols based on aerosol mass spectrometry. Part I: Development and validation of the method. Submitted to Environ. Sci. Technol., Sep. 2004.
(37) Canagaratna, M.; Jayne, J. T.; Ghertner, D. A.; Herndon, S.; Shi, Q.; Jimenez, J. L.; Silva, P. J.; Williams, P.; Lanni, T.; Drewnick, F.; Demerjian, K. L.; Kolb, C. E. Chase Studies of Particulate Emissions from in-use New York City Vehicles. Aerosol
Science and Technology, 2004, 38, 555-573.
(38) Alfarra, M. R.; Coe, H.; Allan, J. D.; Bower, K. N.; Boudries, H.; Canagaratna, M. R.; Jimenez, J. L.; Jayne, J. T.; Garforth, A. A.; Li, S.; Worsnop, D. R.
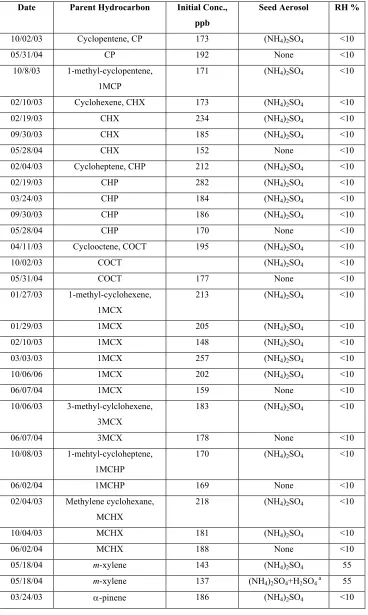
Table 10.1. Summary of conducted experiments
Date Parent Hydrocarbon Initial Conc., ppb
Seed Aerosol RH %
10/02/03 Cyclopentene, CP 173 (NH4)2SO4 <10
05/31/04 CP 192 None <10
10/8/03 1-methyl-cyclopentene, 1MCP
171 (NH4)2SO4 <10
02/10/03 Cyclohexene, CHX 173 (NH4)2SO4 <10
02/19/03 CHX 234 (NH4)2SO4 <10
09/30/03 CHX 185 (NH4)2SO4 <10
05/28/04 CHX 152 None <10
02/04/03 Cycloheptene, CHP 212 (NH4)2SO4 <10
02/19/03 CHP 282 (NH4)2SO4 <10
03/24/03 CHP 184 (NH4)2SO4 <10
09/30/03 CHP 186 (NH4)2SO4 <10
05/28/04 CHP 170 None <10
04/11/03 Cyclooctene, COCT 195 (NH4)2SO4 <10
10/02/03 COCT (NH4)2SO4 <10
05/31/04 COCT 177 None <10
01/27/03 1-methyl-cyclohexene, 1MCX
213 (NH4)2SO4 <10
01/29/03 1MCX 205 (NH4)2SO4 <10
02/10/03 1MCX 148 (NH4)2SO4 <10
03/03/03 1MCX 257 (NH4)2SO4 <10
10/06/06 1MCX 202 (NH4)2SO4 <10
06/07/04 1MCX 159 None <10
10/06/03 3-methyl-cylclohexene, 3MCX
183 (NH4)2SO4 <10
06/07/04 3MCX 178 None <10
10/08/03 1-mehtyl-cycloheptene, 1MCHP
170 (NH4)2SO4 <10
06/02/04 1MCHP 169 None <10
02/04/03 Methylene cyclohexane,
MCHX
218 (NH4)2SO4 <10
10/04/03 MCHX 181 (NH4)2SO4 <10
06/02/04 MCHX 188 None <10
05/18/04 m-xylene 143 (NH4)2SO4 55
05/18/04 m-xylene 137 (NH4)2SO4+H2SO4 a 55
Date Parent Hydrocarbon Initial Conc., ppb
Seed Aerosol RH %
10/31/03 α-pinene 111 (NH4)2SO4 55
10/31/03 α-pinene 113 (NH4)2SO4+H2SO4 b 55
11/03/03 α-pinene 71 (NH4)2SO4 55
11/03/03 α-pinene 72 (NH4)2SO4+H2SO4 b 55
11/25/03 α-pinene 48 MgSO4 55
11/25/03 α-pinene 47 MgSO4+H2SO4 b 55
11/27/03 α-pinene 96 MgSO4 55
11/27/03 α-pinene 88 MgSO4+H2SO4 b 55
11/29/03 α-pinene 52 MgSO4 55
11/29/03 α-pinene 51 MgSO4+H2SO4 b 55
03/15/03 β-pinene 196 None <10
03/31/03 Terpinolene 97 (NH4)2SO4 <10
04/11/03 Terpinolene 188 (NH4)2SO4 <10
06/04/04 Terpinolene 200 None <10
03/31/03 α-Terpinene 58 None <10
04/04/03 ∆3-carene 90 (NH
4)2SO4 <10
04/02/03 Myrcene 83 (NH4)2SO4 <10
04/04/03 Allylanisole 120 (NH4)2SO4 <10
04/02/03 Linalool 72 (NH4)2SO4 <10
03/28/03 β-caryophyllene 89 None <10
03/28/03 α-humulene 103 None <10
aAcidic seed made from 0.03 M salt+0.1 M H
2SO4 solution bAcidic seed made from 0.03 M salt+0.05 M H
Table 10.2. Estimated effective density of SOA during cycloalkene ozonolysis experiments in the presence or absence of seed aerosol. The corresponding standard deviations of the average when multiple experiments were considered are indicated in parentheses. (See Figure 10.1 for list of compounds)
ρSOA
(g/cm3) CP CHX CHP COCT 1MCP 1MCX 3MCX MCHX 1MCHP
Seeded 1.15 1.13 (0.04)
1.14 (0.05)
1.14 (<0.01)
1.07 1.06 (0.08)
1.06 1.08
(0.06)
1.11
Nucleation 1.42 1.45 1.4 1.38 N/A 1.3 1.43 N/A 1.35
Table 10.3. Estimated effective density of SOA during biogenic ozonolysis experiments. The corresponding standard deviations of the average when multiple experiments were considered are indicated in parentheses. These densities are lower limits of the true material densities, as shape effects for these experiments tend to reduce the measured effective densities. All estimates are based on seeded experiments except for β-pinene, β-caryophyllene, and α-humulene (See Table 1).
Parent HC ρSOA
(g/cm3)
Parent HC ρSOA
(g/cm3) Terpinolene a 1.29
(0.03)
4-allylanisole 1.04
α-pinene b 1.19 Linalool 0.64
β-pinene 1.20 β-caryophyllene 1.3
∆3-carene 1.19 α-humulene 1.25
Myrcene 1.17
[image:33.612.120.379.417.592.2]
a Seeded experiments; b Experiment on 03/24/03
Table 10.4. Estimated pH values of seed particles and their relative bulk concentrations
(NH4)2SO4
(0.03 M)
(NH4)2SO4+H2SO4
(0.03 M+ 0.05 M)
MgSO4
(0.03 M)
MgSO4+H2SO4
(0.03 M+ 0.05 M)
[image:33.612.112.544.648.713.2]Table 10.5. Relative contribution of different fragments to the total organic signal (See Table 1 for list of compounds and experiments)
Hydrocarbon m/z 44 m/z 57 Hydrocarbon m/z 44 m/z 57
CHX a 0.061 0.018 β-pinene 0.055 0.006
1MCX a 0.043 0.019 α
-terpinene 0.058 0.008
CHP a 0.059 0.020 Terpinolene d 0.080 0.008
MCHX a 0.067 0.021 myrcene 0.063 0.011
COCT a 0.039 0.017 linalool 0.056 0.011
m-xylene b 0.149 0.004 α-humulene 0.037 0.012
α-pinene c 0.042 0.006 β-caryophyllene 0.042 0.008
Figure 10.1. Chemical structures of the SOA precursor compounds studied I) Cycloalkenes II) Biogenics III) Aromatic
cyclopentene CP- C5H8
cyclohexene CHX- C6H10
cycloheptene CHP- C7H12
cyclooctene COCT- C8H14 1-methyl cyclohexene
1MCX- C7H12 1-methyl cyclopentene
1MCP- C6H10
3-methyl cyclohexene 3MCX- C7H12
methylene cyclohexane MCHX- C7H12
1-methyl cycloheptene MCHP- C7H12
α-pinene C10H16
β-pinene C10H16
α-terpinene C10H16
terpinolene C10H16
∆3-carene
C10H16
myrcene C10H16
α-humulene C15H24
β-caryophyllene C15H24
m-xylene C8H10
linalool C10H18O
Figure 10.2. Comparison of AMS and DMA mass distributions as a means to deduce aerosol effective density: AMS and DMA Mass distributions of (a) dry ammonium nitrate (ρNH4NO3=1.72); (b) dry ammonium sulfate (ρ(NH4)2SO4=1.77);
(c) SOA formed during cyclooctene ozonolysis (ρm=1.18)
120 100 80 60 40 20 0 A M S dM /d Lo g Dva (< ? ? > µ g/ m 3 )
4 5 6 7
100 2 3 4 5 6 71000 2 3 4 5 6 7
Dva(nm)
100 80 60 40 20 0 D M A d M /d Log D va (< ? ? > µ g/ m 3 ) AMS DMA ρm= 1.72
a) Dry Ammonium Nitrate
20 15 10 5 0 A M S dM /d Lo g Dva (< ? ? > µ g/ m 3 )
4 5 6 7
100 2 3 4 5 6 7 1000 2 3 4 5 6
Dva(nm)
20 15 10 5 0 D M A d M /d Log D va (< ? ? > µ g/ m 3 ) AMS DMA ρm= 1.7
b) Dry Amm onium Sulfate
700 600 500 400 300 200 100 0 dM /dLo g Dva ( µ g/ m 3 )
4 5 6 7 8 9
100 2 3 4 5 6 7 8 91000 Dva (nm)
ρm= 1.18
30 25 20 15 10 5 0 dM /d lo g Dva (µ g /m 3 )
5 6 7 8 9
100 2 3 4 5 6 7 8 91000 Dva (nm)
200 150 100 50 0 dM /d lo g D va (µg /m 3 ) Organics (b) 0.5-1 h after 6- 6.5 h after
25 20 15 10 5 0 dM /d lo g Dva (µ g /m 3 )
5 6 7 8 9
100 2 3 4 5 6 7 8 91000 Dva (nm)
0.01 0.1 1 10 N itr a te E qui va le nt M a ss ( µ g/ m 3 ) 150 140 130 120 110 100 90 80 70 60 50 40 30 20 10 m/z
0.5-1 h after (d)
Ammonium 6.04 ± 0.05 Sulphate 12.7 ± 0.06 Organics 14 ± 0.09
NH+
SO2+
SO3+ HSO3+
H2SO4+
NH3+
NH2+
m/z 115 m/z 99 ∆=2 m/z 73 ∆=4 m/z 55 ∆=0 m /z 41
∆=0 m/z 42 ∆=1
m/z 44 CO2+ or ∆=3
SO+ m/z 27 ∆=0 m/z 29 ∆=2 m/z 131 m/z 91 m/z 60 0.01 0.1 1 10 N itr at e E qui va le nt M a ss ( µ g/ m 3 ) 150 140 130 120 110 100 90 80 70 60 50 40 30 20 10 m/z
6-6.5 h after (e)
Ammonium 7.66 ± 0.05 Sulphate 15.8 ± 0.07 Organics 79.7 ± 0.2
NH+
SO2 +
SO3+
HSO3+ H
2SO4
+
NH3+
NH2+
m/z 115 SO+ m/z 99 ∆=2 m/z 73 ∆=4 m/z 55 ∆=0 m/z 41 ∆=0 m/z 42 ∆=1 m/z 44 CO2+ or ∆=3
m/z 27 ∆=0
m /z 29 ∆=2
m/z 131 m/z 91
Figure 10.4. Time trends of sulfate and organic mass concentrations during cyclopentene ozonolysis. Sulfate signal increased after SOA formation, indicating improved collection efficiency of organic-coated seed particles.
25
20
15
10
S
u
lfa
te m
as
s
co
n
cen
tr
a
tio
n
(µ
g
/m
3 )
400 300
200 100
0
Time after start of reaction (m in)
40
30
20
10
0
O
rga
nic m
a
ss
con
cen
tra
tio
n (
µ
g/
m
3
)
Start of O3 injection
Figure 10.5. Fraction of the organic signal at ∆=4 (common ∆ group for CnH2n-1O2+
fragment of acids) and m/z 44 (CO2+ fragment of oxygenated organics) in total SOA mass
during initial stages of cycloheptene oxidation. Increased contribution of carboxylic acid fragments to total mass during initial stages of nucleation experiments may explain higher SOA density observed in these experiments.
0.14
0.12
0.10
0.08
0.06
0.04
0.02
0.00
Fr
ac
tio
n
o
f
or
gan
ic
si
gnal
100 80
60 40
20
Time after start of reaction (min) Cycloheptene Experiment
Seeded Nucleation ∆=4
Figure 10.6. Ion trap mass spectra (negative-ion mode) of SOA from α-pinene (100 ppb) ozonolysis; (a) in the presence of MgSO4 seed particles; (b) in the absence of any seed
particles. The mass spectrum of SOA formed during nucleation exhibits higher signal intensity for acids (m/z 171, 185, 199) and oligomers (m/z 299, 357, and 399) than the seeded experiment.
150 200 250 300 350 400 450 500 550 600
m/z 0
2000 4000 6000 8000 10000 12000 14000 16000 18000 20000 22000 24000 26000 28000 30000 32000 34000 36000 38000 40000 42000
185.0
357.0 170.9
367.0 299.0
398.8
199.0 214.9 312.8 476.9 499.0 568.6
586.5 326.7 370.9 400.8 440.9 522.7
284.9 230.9 246.9
Intensit
y
150 200 250 300 350 400 450 500 550 600
m/z 0
2000 4000 6000 8000 10000 12000 14000 16000 18000 20000 22000 24000 26000 28000 30000 32000 34000 36000 38000 40000 42000
185.0
356.9 170.9
299.0 367.0 199.0
398.8 200.9
382.8 557.0
326.9 496.8 540.8 572.8
477.0
271.0 416.9 438.9
230.9
Intensit
y
Figure 10.7. Relationship between SOA effective density with relative contribution of
m/z 44 signal to total organic signal for different classes of parent hydrocarbons.
Increased SOA effective density is observed with increased contribution of m/z 44 (CO2+
fragment of oxygenated organics) to total organic signal.
1.5
1.4
1.3
1.2
1.1
1.0
E
ff
ec
tiv
e o
rga
n
ic
d
e
ns
ity
(
g
/c
m
3 )
90x10-3 80
70 60
50 40
Figure 10.8. Time trends of sulfate and organic mass concentrations in ozonolysis of linalool. Decrease in sulfate signal after SOA formation indicates poorer collection efficiency of particles, and may suggest formation of solid SOA.
25 20 15 10 S u lfa te M as s C onc en tr a tio n ( µ g/ m 3 ) 200 150 100 50 0
Time after start of reaction (min)
6 4 2 0 O rga n ic M a ss C o n cen trat io n (µ g /m 3 ) Sulfate Organics Start of O3
injection
Figure 10.9. Average delta values of different size fragments for anthropogenic and biogenic SOA. In contrast to anthropogenic SOA, larger fragments of biogenic SOA have dominantly negative ∆ values, indicating presence of terpene derivative structures and unsaturated or cyclic oxygenated compounds.
Figure 10.10. Relative contribution of higher molecular weight fragments to total organic mass during ozonolysis of α-pinene in the presence of different seed particles. Increased fraction of larger fragments to SOA formed during acidic MgSO4 experiment indicates
greater extent of acid-catalyzed reactions that form higher molecular weight species.
25
20
15
10
5
0
C
o
nt
rib
u
tio
n t
o
or
g
a
ni
c m
as
s
fr
o
m
n
om
ina
l C
5
-C
15
fr
a
gm
e
n
ts
(%
)
Figure 10.11. (a) Relative contribution of different ∆ groups to total SOA mass formed from ozonolysis of α-pinene in the presence of MgSO4 or MgSO4+H2SO4 seed aerosols.
(b) Fraction of organic signal due to m/z 44 and ∆=3 during ozonolysis of α-pinene in the presence of MgSO4 or MgSO4+H2SO4 seed. Increased contribution of ∆ = -1 and ∆ = 0
and decreased contribution of ∆ = 3 (or m/z 44) to total mass during acid experiment are consistent with acid-catalyzed reactions.
0.3
0.2
0.1
0.0
Fr
ac
tio
n
o
f or
ga
ni
c s
ig
n
a
l
200 150
100 50
Time after start of reaction (min)
a) Non Acid Acid
∆= -1
∆= 0
∆= 2
∆= 3
0.16 0.14 0.12 0.10 0.08 0.06 F ra ct io n of or g a ni c si g n a l f rom ∆ =3 200 150 100 50
Time after start of reaction (min)
100x10-3 90 80 70 60 50 40 30 Fr ac tio n o f o rgani c si gn a l fr o m m/ z 44
b) Non Acid Acid
∆=3
m/z 44
Figure 10.12. (a) Relative contribution of different ∆ groups to total SOA mass formed from photooxidation of m-xylene in the presence of (NH4)2SO4 or (NH4)2SO4 +H2SO4
seed aerosols. (b) Fraction of organic signal due to m/z 44 and ∆=3 during photooxidation of m-xylene in the presence of (NH4)2SO4 or (NH4)2SO4 +H2SO4 seed aerosols. Increased
contribution of ∆ = 3 to total signal correlates well with increased contribution of CO2+
fragment of oxygenated organics (m/z 44).
0.5
0.4
0.3
0.2
0.1
0.0
F
rac
tion
of
or
g
a
n
ic
s
ign
a
l
400 350
300 250
200 150
100 50
Time after start of reaction (min)
a) Non Acid Acid
∆=-1
∆= 0
∆= 2
0.18
0.16
0.14
0.12
0.10
F
ra
ct
io
n
o
f o
rgani
c si
gnal
fr
om
m/
z
44
400 350
300 250
200 150
100 50
Tim e after start of reaction (m in)
0.30
0.28
0.26
0.24
0.22
0.20
0.18
0.16
0.14
F
ract
ion
of
or
g
ani
c si
gna
l fr
om
∆
=3
b) Non Acid Acid
m/z 44
∆=3
Figure 10.13. Time trend of main fragments of 2,5-furandione (m/z 54), 3-methyl-2,5-furandione (m/z 68), and nitrate (m/z 30 and 46) during photooxidation of m-xylene. Increase in the intensity of these fragments after start of reaction is consistent with presence of furandione compounds and nitro-compounds in SOA.
16x103 12 8 4 0 R a w io n s ign a l a t m/ z 30 ( H z) 600 400 200 0
Time after start of reaction (min)
6000 5000 4000 3000 2000 1000 0 R aw io n s ign al at m/ z 46 (H z) 3000 2500 2000 1500 1000 500 0 R a w io n s ign a l a t m/ z 54 ( H z) 5000 4000 3000 2000 1000 0 R a w io n s ign al at m/ z 68 ( H z)
Non Acid Acid
m/z 54
m/z 68
m/z 30
Figure 10.14. Mass spectra of SOA formed during α-pinene, m-xylene, and cyclopentene oxidation experiments as well as ambient organic mass spectra of Ohio background pollution, Cleveland, OH pollution, and brush fire plumes. Common dominant fragments at m/z 41, 43, 44, and 55 are observed in all mass spectra.
16 12 8 4 0 P e rc en tage cont ri bu tio n t o tot al o rga n ic si gn al 100 90 80 70 60 50 40 30 20 10 m/z 16 12 8 4 0 16 12 8 4 0 16 12 8 4 0 16 12 8 4 0 16 12 8 4 0 Brush Fire (Monterey, CA) Cleveland (ICARTT) Ohio (ICARTT) 18 27
29 44 55
69 CP m-xylene α-pinene 43 41 67 57 53 18 2729 41 43 44
535557 69 15
Figure 10.15. Delta analysis of mass spectra obtained from brush fire, Cleveland, and background Ohio pollution plumes. Organic composition in all these air masses is very similar and dominated by fragments with ∆=2, 0, and 3. In cases when similar air masses were sampled in more than one occasion, the error bars represent the standard deviation of the average to indicate the extent of variation in the averaged delta values.
0.30
0.25
0.20
0.15
0.10
0.05
0.00
R
el
a
tiv
e
In
te
n
sity
-7 -6 -5 -4 -3 -2 -1 0 1 2 3 4 5 6
delta number (∆) (a) Brush Fire
0.30
0.25
0.20
0.15
0.10
0.05
0.00
R
ela
tiv
e
In
te
n
sity
-7 -6 -5 -4 -3 -2 -1 0 1 2 3 4 5 6
delta number (∆) (b) Cleveland
(ICARTT)
0.30
0.25
0.20
0.15
0.10
0.05
0.00
R
ela
tiv
e
In
te
n
sity
-7 -6 -5 -4 -3 -2 -1 0 1 2 3 4 5 6
delta number (∆) (c) Ohio
Figure 10.16. Average delta values of different size fragments of ambient organic mass spectra obtained in brush fire, Cleveland pollution, and background Ohio pollution plumes. Larger fragments in these mass spectra exhibit negative delta values. The error bars represent the standard deviation of the averaged delta values in each category.
-4 -3 -2 -1 0 1 2 3
A
ver
a
ge D
e
lta
Brush Fire Cleveland Ohio