Fragment based drug discovery for SOD1-ALS
and
solution X-ray scattering studies on the copper
chaperone for SOD1 (hCCS) and its functional
complexes with SOD1
Thesis submitted in accordance with the requirements of the University of Liverpool for the degree of Doctor in Philosophy
by
Gareth Wright
Amyotrophic lateral sclerosis (ALS) is a fatal disease of the nervous system. The majority of ALS cases are have no attributable genetic link, however approximately 10% are familial and 20 % of these result from mutations in the SOD1 gene. How SOD1 mutation manifests as the ALS phenotype is not clear however the enzyme does gain an aggregative property characterised by SOD1 inclusions in the brain and spinal cord. Drug treatment for sporadic and familial ALS is currently limited to palliatives and there is currently no specific treatment for SOD1 mediated ALS. In order to find molecules that may be of use in the development of SOD1 therapeutics a crystallographic screening pipeline was set up to assess binding of small molecules to both wild-type and SOD1 mutants.
Using in silico studies and previous crystallographic work as a starting point, this method revealed several low molecular weight compounds (Mr 183 – 310 gMol-1) that have SOD1
binding activity. These molecules belong to three distinct classes: catecholamine, quinazoline and fluorouridine and occupy two distinct binding sites on the surface of the SOD1 β-barrel in an area known to be important in disease pathogenesis.
The incorporation of copper into biological macromolecules such as SOD1 is essential for the viability of most organisms. However, copper is toxic and therefore the intracellular free copper concentration is kept to an absolute minimum. The Copper Chaperone for SOD1 (CCS) is the major pathway for SOD1 copper loading and transfer of an intrasubunit disulphide bond known to stabilise SOD1.
Table of contents
Acknowledgements...7
List of Figures...8
List of Tables...12
Glossary of Abbreviations...13
Chapter I:
ALS, SOD1 and drug development...14
1.1 Amyotrophic Lateral Sclerosis...14
1.2 Familial Amyotrophic Lateral Sclerosis and associated proteins...15
1.3 SOD1 genetics...16
1.4 Superoxide and SOD1 catalytic function...16
1.5 SOD1 structure...17
1.6 SOD1 fALS disease pathogenesis...19
1.7 Available SOD1 fALS therapeutics and review of clinical trials in progress...21
Chapter II:
Drug discovery and crystallographic theory...23
2.1 Fragment based rational drug design...23
2.2 Crystallographic fragment-based drug discovery...23
2.3 Crystallisation, compound soaking and data collection...24
2.4 Crystallographic theory...25
2.5 Data reduction, scaling & merging...26
2.6 Isomorphous phasing...26
Chapter III:
Crystallographic screening of small molecules for SOD1 binding. 29
3.1 SOD1 screening pipeline...29
3.2 Small molecule library screen...30
3.3 4-(4-methyl-1,4-diazepan-1-yl)-2-(trifluoromethyl)quinazoline (MDTQ)...31
3.4 4-(4-methylpiperazin-1-yl)quinazoline (MPQ)...35
3.5 4-(4-methyl-1,4-diazepan-1-yl)quinazoline (MDQ)...38
3.6 4-(4-methylpiperazin-1-yl)-2-(trifluoromethyl)quinazoline (MPTQ)...42
3.7 Quinazoline Summary...44
3.8 5-Fluorouridine...45
3.9 Isoproteranol...51
3.10 Adrenaline...56
3.11 Dopamine...60
3.12 An in vitro assay to monitor SOD1 aggregation...65
Chapter IV:
Discussion of small molecule SOD1 binding and the effect upon
SOD1 aggregation in vitro...76
4.1 The SOD1 screening pipeline...76
4.2 The SOD1 tryptophan-32 binding site...76
4.3 The SOD1 loop II binding site...77
4.4 Lansbury compounds and contrary results...78
4.5 Loop II and Trp32 in SOD1 pathology and implications...79
4.6 Affinity & NMR experiments...80
4.7 Prospects and further work...81
Chapter V:
An introduction to the human copper chaperone for SOD1 and
small-angle X-ray scattering...82
5.2 The membrane bound copper transporter and metallochaperones...82
5.3 Domain architecture of hCCS...84
5.4 X-ray scattering...86
5.5 X-ray scattering by biological macromolecules in solution...87
5.6 Ab initio shape restoration from the scattering curve...88
5.7 Rigid body modelling...89
5.8 Summary...90
Chapter VI:
Solution X-ray scattering studies on hCCS and SOD1...91
6.1 Expression of recombinant hCCS in Escherichia coli and purification...91
6.2 hCCS small angle X-ray scattering and assignment of scattering parameters...94
6.3 Ab initio shape reconstruction...98
6.4 Rigid body modelling of hCCS...101
6.5 Characterisation of human SOD1 by small angle X-ray scattering...105
Chapter VII:
Structural characterisation of the hCCS-SOD1 heterodimer by
solution X-ray scattering...111
7.1 Construction of the hCCS-SOD1 heterodimer...111
7.2 SAXS data collection and assignment of structural parameters...114
7.3 Ab initio model reconstructions...117
7.4 Rigid body modelling the hCCS-wtSOD1 complex...119
7.5 Rigid body modelling the I113T and L38V SOD1-hCCS complex...124
7.6 Comparison of the solution structures of SOD1, hCCS and the hCCS-SOD1 complex ...129
8.1 A comparison of hCCS scattering profiles collected at different X-ray sources and
SAXS stations...136
8.2 The function of hCCS and its intrinsic flexibility...138
8.3 Stoichiometry of hCCS-SOD1 complex formation...143
8.4 The hCCS-SOD1 heterogeneity and implications for ALS...144
8.5 Prospects and further work...146
Chapter IX:
Materials and Methods...147
9.1 SOD1 cloning and plasmid construction...147
9.2 Site directed mutagenesis...148
9.3 Expression of recombinant SOD1 proteins...148
9.4 SOD1 purification...148
9.5 Crystallisation, soaking experiments and data collection...149
9.6 In vitro SOD1 aggregation assay...150
9.7 hCCS cloning and expression...151
9.8 Purification and tag removal...152
9.9 hCCS-SOD1 heterodimeric complex formation...153
9.10 Small-angle X-ray data collection and processing...153
9.11 Rigid body modelling...154
References...155
Appendices ...170
Appendix I – Summary of Oligonucleotides...170
Appendix II – Summary of Plasmids...170
Appendix III – E. coli Strains...170
Acknowledgements
Thank you to my supervisors Prof. Samar Hasnain and Dr Richard Strange for direction and encouragement.
Many thanks to Dr Guenter Grossmann for excellent help with the practicalities of SAXS, numerous paper redrafts and a lot of 5 am chocolate at the synchrotron.
Many of the novel SOD1 binding compounds described in the first half of this work were synthesised by Dr Neil Kershaw for which, along with many useful discussions, I am very grateful.
A big thank you to Mr Mark Prescott and Dr Mark Wilkinson for mass spectrometry on a heap of proteins.
Thank you to all members, past and present, of labs C & D in the University of Liverpool Biosciences building whose trade in consumables and expertise made a lot of this work possible.
List of Figures
Fig 1.1 The structure of human SOD1 18
Fig 1.2 Detail of the SOD1 copper and zinc binding sites 18
Fig 1.3 Distribution of fALS associated mutations throughout the SOD1 open reading frame
19
Fig 2.1A Hanging drop vapour diffusion 25
Fig 2.1B Phase diagram of protein crystallisation driven by precipitant concentration
25
Fig 3.1 The structure of MDTQ 31
Fig 3.2 MDTQ bound to I113T SOD1 33
Fig 3.3 MDTQ bound to multiple SOD1 mutants 34
Fig 3.4 The structure of MPQ 35
Fig 3.5 MPQ bound to I113T SOD1 36
Fig 3.6 MPQ bound to multiple SOD1 mutants 37
Fig 3.7 The structure of MDQ 38
Fig 3.8 MDQ bound to I113T SOD1 40
Fig 3.9 MDQ bound to multiple SOD1 mutants 41
Fig 3.10 The structure of MPTQ 42
Fig 3.11 MPTQ bound to I113T SOD1 43
Fig 3.12 The structure of 5-fluorouridine 45
Fig 3.13 The I113T dimerisation region hydrophobic pocket after crystal soaking with 5-fluorouridine
47
Fig 3.14 5-Fluorouridine bound to I113T SOD1 48
Fig 3.15 5-Fluorouridine bound to multiple SOD1 mutants 49
Fig 3.16 The structure of isoproteranol 51
Fig 3.17 The I113T dimerisation region hydrophobic pocket after crystal soaking
with isoproteranol 52
Fig 3.18 Isoproteranol bound to I113T SOD1 53
Fig 3.19 Isoproteranol bound to multiple SOD1 mutants 54
Fig 3.20 Comparison of I113T SOD1 in the native and isoproteranol bound states 55
Fig 3.21 The structure of adrenaline 56
Fig 3.22 Adrenaline bound to I113T SOD1 58
Fig 3.23 Adrenaline bound to multiple SOD1 mutants 59
Fig 3.24 The structure of dopamine 60
Fig 3.26 Dopamine bound to multiple SOD1 mutants 63 Fig 3.27 Comparison of I113T SOD1 structures with bound catecholamines 64 Fig 3.28 Aggregation of I113T SOD1 monitored by size exclusion
chromatography
65
Fig 3.29 Aggregation of recombinant SOD1 in the presence of MDTQ monitored
by SEC 69
Fig 3.30 Aggregation of recombinant SOD1 in the presence of MPQ monitored by SEC
70
Fig 3.31 Aggregation of recombinant SOD1 in the presence of MDQ monitored by SEC
71
Fig 3.32 Aggregation of recombinant SOD1 in the presence of 5-fluorouridine
monitored by SEC 72
Fig 3.33 Aggregation of recombinant SOD1 in the presence of isoproteranol monitored by SEC
73
Fig 3.34 Aggregation of recombinant SOD1 in the presence of dopamine monitored by SEC
74
Fig 4.1 The structures of four SOD1 binding quinazoline derivatives 76
Fig 4.2 The structures of three SOD1 binding catecholamines 77
Fig 4.3 The SOD1 dimer 79
Fig 5.1 Multiple protein sequence alignment CCS and SOD1 proteins 83
Fig 5.2 Structures of the three hCCS domains 84
Fig 5.3 The accepted mechanism of SOD1 copper loading by hCCS 86
Fig 6.1 Purification of recombinant hCCS 91
Fig 6.2 Electrospray ionisation mass spectrometry of recombinant hCCS 92 Fig 6.3 Size exclusion chromatography profile of recombinant hCCS 93 Fig 6.4 Size exclusion chromatography profile of hCCS described by radius of
gyration and forward scattering intensity
95
Fig 6.5 Solution X-ray scattering profile of hCCS 96
Fig 6.6 Guinier plot of X-ray scattering from hCCS 96
Fig 6.7 hCCS distance distrubution function 97
Fig 6.8 hCCS Kratky plot 97
Fig 6.9 Ab initio P1 shape reconstruction of hCCS 99
Fig 6.10 18 ab initio P1 shape reconstructions of hCCS 100
Fig 6.11 Consensus shape of all ab initio non-symmetrical SAXS models of hCCS 100 Fig 6.12 Scattering profile of 25 rigid body models of full length hCCS 103
Fig 6.13 Solution structures of homodimeric hCCS 104
Fig 6.14 Interaction between the copper binding motifs of domains I and III 105
Fig 6.16 Comparison of the scattering profile of wild-type, L38V and I113T copper-apo zinc-holo SOD1
107
Fig 6.17 Kratky analysis of recombinant zinc loaded wild-type, L38V and I113T
SOD1 108
Fig 6.18 Small-angle X-ray scattering shape restoration models of human SOD1 108 Fig 6.19 Comparison of the experimental scattering profile of I113T SOD1 with
the predicted profile deduced from its crystal structure
109
Fig 7.1 Size exclusion chromatographic and SDS-PAGE analysis of the hCCS-wtSOD1 heterodimer
112
Fig 7.2 Size exclusion chromatography of the hCCS-SOD1 complex after
purification and concentration 113
Fig 7.3 Scattering profile of hCCS complexed with SOD1 115
Fig 7.4 Distance distribution function of hCCS complexed with SOD1 116
Fig 7.5 Ab initio bead models of the hCCS-wtSOD1 complex 117
Fig 7.6 The 'most typical' hCCS-wtSOD1 complex model 118
Fig 7.7 Averaged ab initio shape restorations of hCCS complexed with SOD1 118
Fig 7.8 Solution structures of the hCCS-wtSOD1 complex 121
Fig 7.9 Scattering profile for the 20 rigid body models of hCCS-wtSOD1 122 Fig 7.10 Comparison of SAXS solution structures of the human CCS-wtSOD1
complex with the crystal structure of the S. cerevisiae complex
122
Fig 7.11 Association of hCCS domain III with SOD1 123
Fig 7.12 Scattering profile of 20 hCCS-L38V SOD1 models 125
Fig 7.13 Scattering profile of 20 hCCS-I113T SOD1 models 125
Fig 7.14 Solution structures of the hCCS-L38V SOD1 complex 127
Fig 7.15 Solution structures of the hCCS-I113T SOD1 complex 128
Fig 7.16 Scattering profiles of hCCS, SOD1 and their heterodimeric complex 130 Fig 7.17 Comparison of the positions of the hCCS Atx1-like domain I when
complexed with wtSOD1 and I113T SOD1
132
Fig 7.18 Comparison of the positions of the hCCS Atx1-like domain I when complexed with wtSOD1 and L38V SOD1
133
Fig 7.19 Comparison of the positions of the hCCS domain III when complexed
with both wtSOD1 and I113T SOD1 133
Fig 7.20 Comparison of the X-ray scattering profiles of wild-type, L38V and I113T SOD1 complexed with hCCS
134
Fig 8.1 Comparison of smoothed scattering profiles from hCCS collected at three different SAXS beamlines
137
Fig 8.2 Comparison of Guinier plots for hCCS measured at three beamlines 137 Fig 8.3 Comparison of one yCCS monomer from the crystal structures of the
yCCS dimer and the yCCS-ySOD1 complex
List of Tables
Table 3.1 Single crystal X-ray diffraction data collection, processing and model refinement statistics for MDTQ bound to human recombinant SOD1
32
Table 3.2 Summary of potential hydrogen bonding in between MDTQ and SOD1
34
Table 3.3 Single crystal X-ray diffraction data collection, processing and model
refinement statistics for MPQ bound to SOD1 35
Table 3.4 Single crystal X-ray diffraction data collection, processing and model refinement statistics for MDQ bound to SOD1.
39
Table 3.5 Single crystal X-ray diffraction data collection, processing and model refinement statistics for MPTQ bound to SOD1.
43
Table 3.6 Single crystal X-ray diffraction data collection, processing and model
refinement statistics for 5-fluorouridine bound to SOD1 46 Table 3.7 Summary of potential hydrogen bonding between 5-fluorouridine and
I113T SOD1 at the Trp32 site
49
Table 3.8 Single crystal X-ray diffraction data collection, processing and model refinement statistics for isoproteranol bound to SOD1.
52
Table 3.9 Summary of potential hydrogen bonding interactions between SOD1
and isoproteranol in the loop II binding site. 54
Table 3.10 Single crystal X-ray diffraction data collection, processing and model refinement statistics for adrenaline bound to SOD1
57
Table 3.11 Summary of potential hydrogen bonding interactions between SOD1 and adrenaline in the loop II binding site.
59
Table 3.12 Single crystal X-ray diffraction data collection, processing and model
refinement statistics for dopamine bound to SOD1 61
Table 3.13 Summary of potential hydrogen bonding interactions between SOD1 and adrenaline in the loop II binding site
63
Table 6.1 The three hCCS domains used in rigid body modelling 101
Table 7.1 Comparison of deduced scattering parameters for three hCCS-SOD1 complexes
116
Table 7.2 Deduced scattering parameters for SOD1, hCCS and their complex 131 Table 8.1 Deduced SAXS parameters for hCCS measured at three beamlines 138
Table 9.1 PCR cycling conditions for SOD1 DNA amplification 147
Glossary of Abbreviations
Abbreviation Full name
ADMET Absorption, distribution, metabolism, excretion and toxicity ALS Amyotrophic lateral sclerosis
CCS Copper chaperone for SOD1
Dmax Maximum intra-particle dimension
DMF Dimethylformamide
DMSO Dimethyl sulfoxide
DTT Dithiothreitol
ESI-MS Electrospray ionisation mass spectroscopy EXAFS Extended X-ray absorption fine structure fALS Familial amyotrophic lateral sclerosis
FBDD Fragment-based drug discovery
5-FUrd 5-Fluorouridine
ICP-MS Inductively coupled plasma mass spectrometry
IPTN Isoproteranol
ITC Isothermal titration calorimetry
MDQ 4-(4-methyl-1,4-diazepan-1-yl)quinazoline
MDTQ 4-(4-methyl-1,4-diazepan-1-yl)-2-(trifluoromethyl)quinazoline MPQ 4-(4-methylpiperazin-1-yl)quinazoline
MPTQ 4-(4-methylpiperazin-1-yl)-2-(trifluoromethyl)quinazoline
NMR Nuclear magnetic resonance
PCR Polymerase chain reaction
PDB Protein data bank
Rg Radius of gyration
sALS Sporadic amyotrophic lateral sclerosis SAXS Small-angle X-ray scattering
SOD1 Human Cu/Zn superoxide dismutase-1
Chapter I
ALS, SOD1 and drug development
1.1 Amyotrophic Lateral Sclerosis
Amyotrophic lateral sclerosis (ALS) is an idiopathic neuropathy of humans characterised by death of the upper and lower motor neurons leading to muscle atrophy, paralysis and death 1. ALS has an incidence of 3.0 and 2.4 per 100,000 person years for men and women
respectively in Europe 2. This is reflected in other population registries where information
is available 3 and equates to approximately a 1 in 500 probability of an individual
developing ALS over their life span. These figures can be compared with those pertaining to multiple sclerosis 4.2 per 100,000, Parkinson's disease 14 per 100,00 4 and Alzheimer's
disease 750 per 100,000 5.
Symptoms that give rise to initial presentation are varied but can be divided roughly into bulbar onset and limb onset. Bulbar onset effects 42% 6 of patients and is characterised by
dysarthria, dysphagia or sialorrhoea 7. Limb onset ALS is seen in 58% 6 of cases and is
associated with muscle weakness or atrophy, fasciculations and cramps 7. A small minority
of patients present initially with respiratory weakness not associated with bulbar or limb symptoms 8. As the disease progresses fatigue and reduced activity become common 9.
Malnutrition and sialorrhoea, arising from an inability to swallow, together with reduced respiratory function and uncontrolled expression of emotion 10 are observed in the later
stages. Death usually arises from respiratory failure often associated with pneumonia 11.
ALS is inexorably progressive with 70 - 80% of patients dying within 5 years of the onset of symptoms 6. Although there is a slight preponderance of ALS in men rather than women
1.2 Familial Amyotrophic Lateral Sclerosis and associated proteins
The remaining 10% of ALS cases have a genetic link with one of several susceptibility loci that have varying degrees of genetic penetrance and resultant disease severity 13. A small
number of familial amyotrophic lateral sclerosis (fALS) cases have been observed to show an autosomal recessive inheritance pattern 14,15 but the majority are autosomal dominant 16-18.
While 13 ALS loci have been discovered only 6 have a substantive pathological connection with known proteins. Alsin is a GTPase regulator encoded by the ALS2 gene at position q33 on chomosome 2 and is responsible for an early onset, recessive form of ALS resulting from C-terminal truncation 14,19 . The SEXT gene at 9q34 encodes the senataxin protein,
several mutations in which have been found to determine an early onset form of ALS with slow disease progression 16. Mutations in the OPTN gene at locus 10p15 which encodes
optineurin, previously implicated in open angle glaucoma, have been associated with an autosomal dominant ALS characterised by late onset 20. Similarly, two point mutations in
the VAPB locus at 20q13 have been discovered to be responsible for an autosomal dominant atypical form of ALS associated with adult onset spinal muscular atrophy 21,22.
TDP-43 (Tar DNA Binding Protein-43) and FUS (Fused In Sarcoma) are nucleic acid binding proteins coded for at loci at chromosomal locations 1p36 23 and 16p11 24
respectively. Both of these proteins were first identified through implications in other diseases. The FUS locus was found to undergo a translocation in liposarcoma tumours that created a chimeric protein together with the transcription regulator CHOP 24. Ou et al
discovered that TDP-43 binds to and represses transcription from the HIV long terminal repeat sequence TAR 25. Autozygosity mapping subsequently uncovered a direct
connection between mutation of these two protein and fALS 18,26. Interestingly, TDP-43 had
1.3 SOD1 genetics
Approximately 20% of familial ALS cases are associated with mutations in the superoxide dismutase-1 (SOD1) encoding gene found on chromosome 21 at location q22.1 17.
Mutation in the SOD1 gene therefore accounts for 1 – 2% of all ALS cases which is the highest proportion of any of the known causative genetic elements.
To date there are 159 documented ALS causing SOD1 mutations 28. An affected
individual's life expectancy after initial onset of symptoms is defined, to a large extent, by the mutation 29,30. These mutations are diverse in nature and include amino acid deletion 31
and insertion 32, deletion of base pairs in the 3' untranslated region 33, premature truncation 34 and amino acid substitution 17, the latter of which is by far the most common. These
mutations are for the most part dominantly inherited 17 with individuals heterozygous for
the pathogenic mutation. However, homozygous sufferers have been observed indicating a possible recessive inheritance pattern 35,36 which, surprisingly, in one case was associated
with a juvenile onset and rapid disease progression 35.
1.4 Superoxide and SOD1 catalytic function
The existence of the superoxide radical (O2-) was first postulated by Linus Pauling in 1931
as an aside to his work on the quantum mechanics of the chemical bond 37. It is produced
in vivo as a result of the aberrant univalent reduction of dioxygen by leaky electron transport in mitochondrial oxidative phosphorylation 38. Superoxide is easily converted into
the highly toxic hydroxyl radical (•OH) and peroxynitrite (ONOO-). Up to 2% of electrons
passing through the electron transport chain are lost to the environment so reactive oxygen species, including superoxide, would quickly render the cell dysfunctional and lead to necrosis without a neutralisation strategy. The superoxide dismutase class of enzymes catalyse the dismutation of superoxide to dioxygen and hydrogen peroxide 39 and are
employed to deal with this toxic threat.
Human SOD1 (EC 1.15.1.1) when fully mature contains one copper and one zinc ion per monomer 40. The redox potential of copper in the SOD1 active site enables it to efficiently
step reaction 39:
O2- + Cu2+ZnSOD → O2 + Cu1+ZnSOD
O2- + Cu1+ZnSOD +2H+ → H2O2 + Cu2+ZnSOD
This reaction is very efficient and proceeds at almost the diffusional limit with a rate constant of 109 M-1 s-141 as opposed to spontaneous dismutation which operates at 105 M-1
s-142.
SOD1 is a structurally conserved protein present in widely divergent species 43,44 and is
constitutively expressed in almost all human cells 45 underscoring the biological
importance of this enzyme. It is found predominantly in the cytosol 46 and mitochondrial
intermembrane spaces of eukaryotic cells 47 but also in the nucleus, peroxisomes and
lysosomes 48.
1.5 SOD1 structure
Human SOD1 is a 32 kDa homodimer composed of two non-covalently associated 153 amino acid subunits. The first structure of SOD1 was that of the bovine enzyme determined at 2.0 Å resolution in 1982 49. The wild-type human protein was described at
2.5 Å resolution in 1992 with a focus on designing thermally stable recombinant SOD1 proteins for therapeutic use combating free radical mediated disease 50. This was followed
in 2006 by a 1.07 Å atomic resolution structure of wild-type native human SOD1 51.
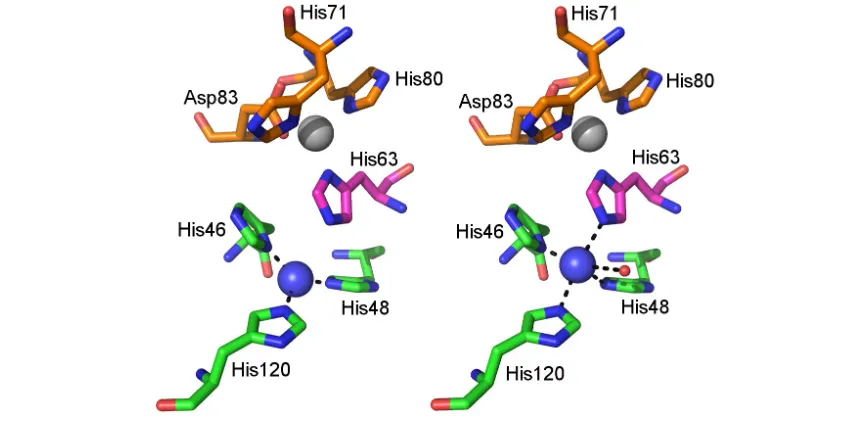
Figure 1.1. The structure of human SOD1. The SOD1 β-barrel is highlighted in red. Loops are highlighted purple except loop IV and VII, the zinc and the electrostatic loops which are highlighted green and cyan respectively. The copper and zinc sites are shown withblue and grey spheres respectively. PDB ID: 2C9V 51.
When the copper ion is oxidised His63 acts as a bidentate bridging ligand between the two metal ions and copper is coordinated in an irregular tetrahedral fashion. On reduction copper moves 1.0 Å away from His63 and is coordinated only by the imidazole group nitrogens of His46, His48, and His120 in a planar triangular conformation (Figure 1.2).
[image:18.595.101.535.474.685.2]The N and C termini of the SOD1 polypeptide form short protrusions from the β-barrel and together with sections of loops IV and VI comprise the dimer interface. This region is stabilised largely by hydrophobic interactions between the dimer counterparts.
1.6 SOD1 fALS disease pathogenesis
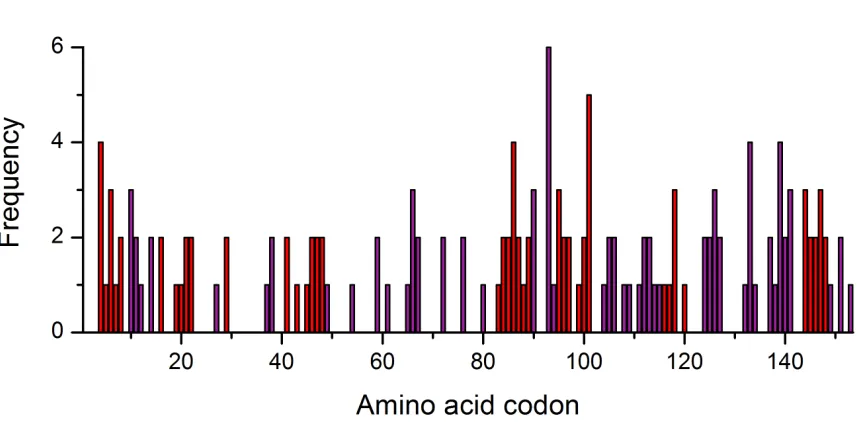
fALS associated SOD1 mutations are located throughout the full length of the 153 amino acid SOD1 primary sequence including zinc 52,53 and copper 54,55 site substitutions (Figure
[image:19.595.106.536.270.483.2]1.3).
Figure 1.3. Distribution of fALS associated mutations throughout the SOD1 open reading frame. Mutations found in loop regions are coloured purple and mutations found in the β-barrel are coloured red. The height of each bar represents the number of novel SOD1 mutations found at that particular site.
Indeed, 81 codons (53%) have one or more documented fALS mutations. A close inspection of their position indicates a 20% increased probability that a residue will have one or more mutations inside the β-barrel than in a loop (0.46 and 0.66 respectively). However strand 3 of the β-barrel (amino acids 30 - 36) is suspiciously free of mutations and is the longest unmutated region. On the other hand there are obvious hotspots not only in the β-barrel but in loops VI and VII, the electrostatic loop.
SOD1 proteins have been observed to have dismutase activities varying from approaching nil up to 150% of the wild-type protein. This does not correlate with disease characteristics such as age of onset and life span after onset of symptoms 57-59. Therefore, disruption of
dismutase activity cannot be the root cause of SOD1 associated ALS. If human SOD1 does not have an unknown function, distinct from its dismutase activity, that is deleteriously affected by these mutations it must gain a characteristic that it does not posses in its wild-type form.
This notion is supported by a number of observations of transgenic mice. Those expressing fALS-associated human SOD1 mutants develop ALS-like symptoms in early adulthood 60,61
and these symptoms result irrespective of the presence, absence or expression level of wild-type SOD1 61. Those expressing or over-expressing only human wild-type protein
display no ALS-like symptoms 62,63 as do those completely deficient in the enzyme 64.
Large SOD1 filled aggregates are observed in the spinal cord neurons of fALS effected individuals and fALS associated SOD1 mutant transgenic mice 65-68. These aggregates
interfere with axonal transport 69,70, cause aberrant apoptosis 71, damage the mitochondria 72 and sequester the proteasome 73. The SOD1 toxic gain of function could be the ability to
aggregate however the mechanism which facilitates this aggregation is not currently known or the reason it specifically effects motor neurons.
At first glance SOD1 aggregation appears counter-intuitive given that wild-type fully metallated SOD1 remains correctly folded at temperatures approaching boiling point 74.
However, introduction of fALS associated SOD1 mutations was found to decrease the thermal stability as determined by differential scanning calorimetry 74. Similarly, partial
metallation of wild-type and mutant SOD1 proteins was also found to decrease thermal stability 74 with loss of the zinc ion from wild-type SOD1 substantially promoting
monomerisation 75 and self organisation into amyloid-like structures 76,77 and soluble
aggregates 78,79.
Each SOD1 monomer contains one intramolecular disulphide bond between cysteines 57 and 146 49. This bond is transferred from CCS (Copper Chaperone for SOD1) 80 during the
copper loading process 81 or by a CCS-independent pathway 82. In fALS associated SOD1
levels 83. Disulphide reduction was observed to promote SOD1 monomerisation 83
particularly when the protein was partially zinc metallated 75. SOD1 monomerisation has
been shown to precede aggregation 84,85 and introduction of a inter-subunit disulphide bond
or a chemical crosslink between adjacent Cys111 residues was observed stabilise the protein and prevent polymerisation in vitro86,87.
Thus destabilisation of the SOD1 dimer resulting from demetallation, disulphide reduction or a combination of both, appears to be a central characteristic of fALS associated mutants. This is corroborated by structural and computational molecular dynamics data that indicate a change in the nature of the dimer interface 88,89, increased dimer instability 85 and a loss of
structural integrity in the zinc binding and electrostatic loop regions 90 on reduction or
metal removal.
1.7 Available SOD1 fALS therapeutics and review of clinical trials in progress
The relatively low incidence of ALS classifies it as an orphan disease and consequently it has attracted little attention in terms of therapeutics development from traditional drug development agencies. Currently, Riluzole is the only approved drug for the treatment of ALS. It is known to increase life expectancy for an ALS sufferer by two months on average
91. There are currently no available drugs specifically targeted to fALS or SOD1 mediated
fALS.
Clinical and pre-clinical trials of SOD1 mediated fALS therapeutics have met with almost complete failure, however some recent studies are worthy of note. Arimoclomol is currently undergoing phase II/III clinical trials 92. It is a co-inducer of heat shock proteins
that enables the clearing of SOD1 aggregates by over-expression of protein chaperones and has been observed to prolong life expectancy in fALS mouse models by 22% when used in pre and early symptomatic individuals 93,94. However, when this drug was tested against late
stage ALS mouse models, that exhibit a greater degree of similarity to human patients initially presenting with ALS, it did not have any life prolonging effect 95.
oligonucleotides able to bind nascent SOD1 mRNA, prevent translation and increase survival time in rat G93A models after direct infusion into the ventricular system have been documented 97. Phase I clinical trials are ongoing for this therapy but while
efficacious in animal models, this delivery method has obvious penalties for future patient comfort and care. Similarly, antisense expressing viral systems have successfully transduced the CNS although their ability to retard disease progression is disputed 98,99.
Pyrimethamine, is a common drug used for the treatment of protozoal infections such as malaria and toxoplasmosis. It is reported to reduce SOD1 levels in G93A SOD1 mouse 100.
In an initial 18 week, seven person clincial trial, this compound was observed to reduce blood lymphocyte SOD1 levels by 30 – 60% for non-A4V patients 100. Conversely,
pyrimethamine was not observed to reduce SOD1 expression in wild-type mice nor abrogate SOD1 synthesis in cell models 101 however this compound is currently undergoing
phase I/II clinical trials.
Chapter II
Drug discovery and crystallographic theory
2.1 Fragment based rational drug design
A traditional approach to drug development takes a defined biological target and screens millions of drug-like compounds for interactions using a minaturisable assay 102. While this
methodology has been valuable in generating many of the therapeutics discovered in the 20th century it is inherently limited by the inverse relationship between molecular
complexity and lead discovery 103, and the low success ratio of lead optimisation 104. The
large infrastructure investment needed for the successful completion of an initial screen, lead optimisation and arrival at a potential drug-like compound, even before clinical or toxicity trials begin, is prohibitive for all but the largest pharmaceutical companies. This effectively stalls drug development for diseases where there are low numbers of affected individuals or the end market is perceived to be too small to compensate for initial outlay
105.
An alternative approach screens low molecular weight compounds for relatively weak binding to the target 106, which may not have been identified by a in vitro assay, using a
structure based technique such as NMR or X-ray crystallography 107. These small
molecules are then grown or linked to produce larger molecules that have strong site specific binding 108 characterised by increased ligand efficiency 109. Throughout this process
it is possible to engineer in Lipinsky 'Rule of 5' 110 compliance including hydrophilicity,
low number of rotatable binds, low molecular weight (<500 Da), 5 or lower hydrogen bond donors or acceptors and other ADMET properties which will facilitate activity.
2.2 Crystallographic fragment-based drug discovery
The relative ease with which crystallisation and single crystal X-ray diffraction structure determination proceeds means crystallography is an ideal tool to feed information into the drug development pipeline throughout its course. Its use in initial ligand screening 107
how chemical space should be probed during optimisation 111.
2.3 Crystallisation, compound soaking and data collection
A prerequisite for crystallographic protein structure determination is diffracting crystals. Crystallisation is the ordered precipitation of solute from a solution by nucleation followed by growth. Throughout this work SOD1 was crystallised by the hanging drop vapour diffusion method (Figure 2.1A). Protein solution at a sufficiently high concentration was mixed 1:1 with the a precipitant solution and suspended over a reservoir of the precipitant solution. Initially the concentration of precipitant, [ppt], is given by
[pptreservoir]=2[pptdrop]
As water evaporates from the drop and condenses in the reservoir solution, this becomes
[pptreservoir]=[pptdrop]
with a concomitant doubling of the protein concentration in the drop. This concentration shift pushes the drop from the unsaturated phase to the supersaturated phase (Figure 2.1B). The degree of supersaturation is the key-point in crystallisation experiment and can be affected by temperature, pH, protein concentration and precipitant concentration. Very high supersaturation will promote disordered expulsion of protein from solution leading to amorphous precipation however if supersaturation cannot be achieved crystal nucleation will not take place. Nucleation is often a very slow process but its necessity can circumvented by addition of pre-existing seed crystals. The SOD1 crystals used in the following chapter were grown from seeds originally acquired from apo-H48Q SOD1 crystallisation and were transferred into the drop after equilibration.
Figure 2.1 (A) Hanging drop vapour diffusion. (B) Phase diagram of protein crystallisation driven by precipitant concentration.
Crystallographic data collection often takes place with the crystal in a stream of nitrogen gas at 100 K. This reduces the effects of radiation damage and means a single crystal is sufficient to collect all the data necessary for structure determination. While this reduces the demand for protein and ligand it is essential that the ligand be included in any aqueous cryoprotectant solutions in order that bound ligand is not dispersed during cryoprotection.
The data presented in the following chapter were collected at two crystallographic beamlines: Proxima 1 at SOLEIL, Paris, France and IO3 at DIAMOND, Oxfordshire, England. Details of data collection and processing can be found in the Materials and Methods chapter.
2.4 Crystallographic theory
The minutiae of crystallographic theory are available in numerous canonical texts and it is not the purpose of this work to review available information however, what follows is a brief description of that which is necessary to understand the work presented in chapter III.
The distribution of electrons (ρ) at a point (x, y, z) within a unit cell (with volume V) of a crystal can be described as the Fourier sum of its structure factors (Fhkl).
ρ(x , y , z)=1
V
∑
h∑
k∑
l Fhkle2.5 Data reduction, scaling & merging
The first stage in the process of creating a model of a biomolecule by X-ray diffraction crystallography is data reduction. That is, indexing of reflections to correct h, k and l
values, unit cell parameter refinement and assessment of the intensity of reflections by background subtracted integration. The outcome of this process is a data set consisting of the Miller indices of each reflection (hkl), its intensity (Ihkl) and standard uncertainty (σIhkl).
Throughout this work data reduction was performed with iMOSFLM 112 or HKL2000 113.
The intensity of each reflection can be affected by the intensity of the incident beam and variability in the beam's path length through the crystal as it is moved into different orientations. It cannot be assumed therefore, that the intensities measured directly from the diffraction image are consistent across the whole data set. This problem is eliminated by observing reflections with known index across more than one frame and scaling the dataset so that identical reflections have identical intensity throughout. This task was performed here using the programs SCALA 114 or HKL2000.
2.6 Isomorphous phasing
As stated previously, the electron density within a crystal unit cell can be expressed as the equation in Section 2.4 where the structure factor amplitudes and phases are implicit in the term Fhkl. This equation can be reformulated as
ρ(x , y , z)=1
V
∑
h∑
k∑
l∣
Fhkl∣
e−2πi(hk+ky+lz−α'hkl)
which gives electron density at coordinate (x, y, z) of the real lattice as a function of measured structure factor amplitudes │Fhkl│ and phases (α'hkl). The structure factor
amplitude is proportional to the square root of its intensity (Ihkl1/2) which can be directly
The phase problem is a major hurdle when the structure of a new protein is being experimentally determined. It is solved most frequently by isomorphous replacement, anomalous diffraction or molecular replacement methods. However, a protein crystal soaked in a putative ligand is unlikely to deviate hugely from the structure of the native crystal. A crystallographic approach to fragment based drug discovery necessitates that the structure of the target protein has already been solved. If this is the case the structure of the ligand-protein complex can be solved using phase information taken from the native protein structure by isomorphous molecular replacement in conjunction with experimentally measured intensities from the complex.
In the following chapter the structure of SOD1 with eight ligands is presented. Each ligand is described bound to SOD1 in both the P21 and and C2221 space groups. These structures
were solved using previously existing SOD1 models with PDB codes 2VOA 90 and 1UXL 89 respectively. Four structures of L38V SOD1 were found to pack in the P2
12121 space
group. These structures were solved by isomorphous phasing using a pre-existing but unpublished model of P212121 native L38V SOD1 which was itself solved by molecular
replacement using the program MOLREP 115.
2.7 Refinement
Isomorphous phasing allows one to generate a rough electron density map of the protein-ligand complex under investigation. At this point structure factors can be calculated from the model taking into account the sum of diffractive contributions from individual atoms (j) with elemental scattering factor (fj) at a particular position (xj, yj, zj) in the unit cell.
Fhkl=
∑
j=1f je2Πi(hxj+kyj+lzj)
calculated amplitudes │Fc│ approaching observed amplitudes│Fo│. The structures
Chapter III
Crystallographic screening of small molecules for SOD1 binding
3.1 SOD1 screening pipeline
Using a crystallographic approach to compound screening and lead optimisation we hope to find compounds that bind to and consequently change the pathogenic characteristic of SOD1, with the aim of producing target specific therapeutics. In practice this involves co-crystallisation of SOD1 with a number of putative ligands and subsequent determination of the structure of the SOD1-ligand complex.
The screening of small molecules for SOD1 binding took place against the dimer interface mutant I113T. The II13T mutation was one of the first 11 SOD1 mutations implicated in ALS 17. It is one of the most common SOD1 gene mutations and has been reported in nine
countries. It is by far the most common mutation in the UK 118,119 and is associated with
extreme phenotypic variation 120,121 and incomplete penetrance 122. This mutant is known to
be extremely prone to aggregation in vitro as a result of metal loss 78.
I113T SOD1 crystals in the P21 space group were grown from seed at pH 5. This crystal
form is densely packed and can diffract up to atomic resolution 123,51, with 1.0 Å currently
the highest documented resolution, and is resistant to low concentrations of dimethyl sulfoxide (DMSO). If binding was observed in the crystal structure with I113T the compound was soaked into wild-type, L38V 17 and H48Q 55 SOD1 crystals at pH 5. L38V
is located in the loop connecting strands 3 and 6 of the SOD1 β-barrel and H48Q is a copper site mutant. In order to discount ligand binding through crystal lattice contacts the compound was also tested against I113T SOD1 crystals in the C2221 space group grown at
3.2 Small molecule library screen
3.3 4-(4-methyl-1,4-diazepan-1-yl)-2-(trifluoromethyl)quinazoline (MDTQ)
As part of their ongoing research into the pathogenesis and amelioration of SOD1 related fALS Antonyuk et al reported a diverse group of molecules which were found to bind SOD1 123. One of these compounds,
4-(4-methyl-1,4-diazepan-1-yl)-2-(trifluoromethyl)quinazoline hereafter called MDTQ, was found to occupy a binding site over the SOD1 Trp32. MDTQ is composed of a quinazoline ring system with an homopiperazine group connected at C4 and a trifluoromethyl at C2 (Figure 3.1). MDTQ has good solubility in aqueous buffers removing the necessity to use strong solvents such as DMSO.
Figure 3.1. The structure of MDTQ (4-(4-methyl-1,4-diazepan-1-yl)-2-(trifluoromethyl) quinazoline). The quinazoline numbering system is shown, Mr 310.14 g Mol-1.
In the structure presented by Antonyuk et al 123, the tri-fluromethyl group of MDTQ
interacts with L38V SOD1 through two hydrogen bonds with Glu100. The quinazolene double ring system was also hydrogen bonded with Ser98. MDTQ bound L38V SOD1 with the long axis of its quinazoline ring system running parallel with the Trp32 indole group maximising any stacking interaction.
MDTQ was entered into the SOD1 screening pipeline in order to asses the methodology's efficacy, determine if MDTQ universally binds all SOD1 mutants and to characterise its pharmacophore properties. Table 3.1 shows the crystallographic statistics for five SOD1-MDTQ structures.
of Ser98 and the backbone amide groups of Val31 and Ile99 (Figure 3.2D). Another hydrogen bond with the Glu100 carboxylic acid was postulated previously however in this structure the donor-acceptor distance is 4.6 Å. The Ser98 side chain also acts as a hydrogen bond donor to a MDTQ quinazoline ring nitrogen. These interactions are summarised in table 3.2.
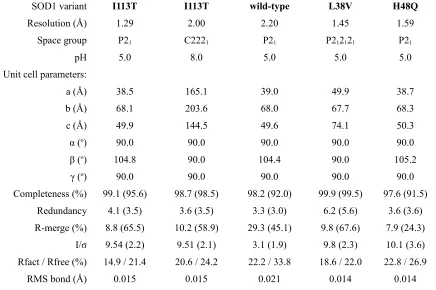
SOD1 variant I113T I113T wild-type L38V H48Q
Resolution (Å) 1.29 2.00 2.20 1.45 1.59
Space group P21 C2221 P21 P212121 P21
pH 5.0 8.0 5.0 5.0 5.0
Unit cell parameters:
a (Å) 38.5 165.1 39.0 49.9 38.7
b (Å) 68.1 203.6 68.0 67.7 68.3
c (Å) 49.9 144.5 49.6 74.1 50.3
α (o) 90.0 90.0 90.0 90.0 90.0
β (o) 104.8 90.0 104.4 90.0 105.2
γ (o) 90.0 90.0 90.0 90.0 90.0
Completeness (%) 99.1 (95.6) 98.7 (98.5) 98.2 (92.0) 99.9 (99.5) 97.6 (91.5) Redundancy 4.1 (3.5) 3.6 (3.5) 3.3 (3.0) 6.2 (5.6) 3.6 (3.6) R-merge (%) 8.8 (65.5) 10.2 (58.9) 29.3 (45.1) 9.8 (67.6) 7.9 (24.3)
I/σ 9.54 (2.2) 9.51 (2.1) 3.1 (1.9) 9.8 (2.3) 10.1 (3.6) Rfact / Rfree (%) 14.9 / 21.4 20.6 / 24.2 22.2 / 33.8 18.6 / 22.0 22.8 / 26.9
RMS bond (Å) 0.015 0.015 0.021 0.014 0.014
Table 3.1. Single crystal X-ray diffraction data collection, processing and model refinement statistics for MDTQ bound to human recombinant SOD1.
Figure 3.2. MDTQ bound to I113T SOD1. (A) MDTQ with respect to the SOD1 dimer in grey and light grey, strands 3 and 6 of the SOD1 β-barrel are coloured purple and green respectively. (B) 2Fo-Fc electron density
map of MDTQ contoured at 1σ at the Trp32 binding site with the SOD1 surface coloured by amino acid hydrophobicity according Eisenberg's consensus hydrophobicity scale 124 and (C) the second conformation of
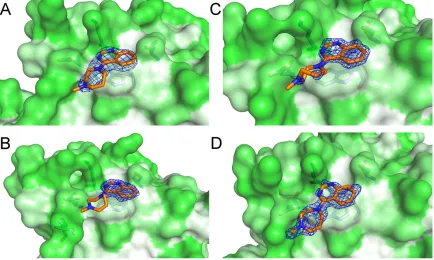
Figure 3.3. MDTQ bound to multiple SOD1 mutants. 2Fo-Fc electron density maps contoured at 1σ of
MDTQ bound at the Trp32 site in (A) I113T SOD1 pH 8 C2221 crystal structure (B) L38V SOD1 in the
P212121 form, (C) wild-type SOD1 and (D) H48Q SOD1 grown at pH 5 in the P21 form.
Donor I113T wtSOD1 L38V H48Q I113T pH8 Acceptor
Ser98-OH 2.7 Å 3.0 Å 2.7 Å 2.9 Å 2.8 Å N-Quinazoline
Ser98-OH 2.7 Å 2.6 Å 2.8 Å 2.5 Å 2.5 Å F-Trifluoromethyl
Ile99-NH 3.6 Å 3.7 Å 3.4 Å 3.8 Å 3.3 Å F-Trifluoromethyl
Val31-NH 3.2 Å 3.5 Å 4.1 Å 3.3 Å 3.2 Å F-Trifluoromethyl
Glu100-COOH 4.6 Å 4.2 Å 4.7 Å 3.1 Å 3.9 Å F-Trifluoromethyl
Table 3.2. Summary of potential hydrogen bonding in between MDTQ and SOD1. In the case of the I113T P21 structure values indicate the canonical orientation presented in Figure 3.2B.
Figure 3.3 describes the binding of MDTQ to three SOD1 variants. In each case the MDTQ molecule is found in the published orientation. Electron density for the ligand is good indicating that binding to SOD1 is not pH or SOD1 mutant dependent.
3.4 4-(4-methylpiperazin-1-yl)quinazoline (MPQ)
The quinazoline based compound 4-(4-methylpiperazin-1-yl)quinazoline (MPQ) differs from MDTQ in that the trifluoromethyl group at C2 is not present and the homopiperazine at C4 is replaced with a methylpiperazine (Figure 3.4). Table 3.3 shows crystallographic statistics for various SOD1 proteins complexed with MPQ.
Figure 3.4. The structure of MPQ (4-(4-methylpiperazin-1-yl)quinazoline). The quinazoline numbering is system shown, Mr 228.14 g Mol-1.
SOD1 variant I113T I113T wild-type L38V H48Q
Resolution (Å) 1.24 1.93 1.35 1.33 1.53
Space group P21 C2221 P21 P212121 P21
pH 5.0 8.0 5.0 5.0 5.0
Unit cell parameters:
a (Å) 38.7 166.3 38.8 50.1 38.6
b (Å) 68.1 203.8 68.5 67.8 68.1
c (Å) 50.0 144.5 50.0 74.4 49.6
α (o) 90.0 90.0 90.0 90.0 90.0
β (o) 104.7 90.0 104.5 90.0 104.5
γ (o) 90.0 90.0 90.0 90.0 90.0
Completeness (%) 99.9 (99.9) 99.5 (95.5) 94.1 (69.6) 95.2 (77.3) 95.2 (94.4) Redundancy 4.1 (3.4) 3.7 (3.0) 3.47 (2.6) 6.08 (3.37) 3.7 (3.8) R-merge (%) 8.2 (68.9) 9.2 (52.0) 5.4 (42.8) 8.4 (59.8) 7.2 (11.5)
I/σ 14.4 (1.7) 12.3 (2.0) 13.3 (2.2) 10.81 (1.73) 12.2 (3.8) Rfact / Rfree (%) 13.9 / 17.5 17.2 / 20.4 13.6 / 18.1 17.3 / 23.3 19.4 / 23.2
RMS bond (Å) 0.014 0.015 0.013 0.013 0.014
Figure 3.5. MPQ bound to I113T SOD1. (A) MPQ with respect to the SOD1 dimer in grey and light grey, strands 3 and 6 of the SOD1 β-barrel are coloured purple and green respectively. (B) 2Fo-Fc electron density
Figure 3.5A shows the mode of binding of MPQ to I113T on the surface of strand 3 of the SOD1 β-barrel. This compound occupies roughly the same space as MDTQ roughly 3.5 Å above the Trp32 indole. MPQ binding at this site differs however from that of MDTQ presented in the previous section in that the quinazoline nitrogen atoms are not involved in hydrogen bonding with SOD1 and face out from the β-barrel. The methylpiperazine is positioned between the side-chains of Glu21 and Lys30, 3.5 Å from each, with a possible hydrogen bond between the Glu21 carboxyl and methylpiperazine nitrogen (Figure 3.5C).
Figure 3.6. MPQ bound to multiple SOD1 mutants. 2Fo-Fc electron density maps contoured at 1σ of MPQ
bound at the Trp32 site in (A) I113T SOD1 pH 8 C2221 crystal structure (B) L38V SOD1 in the P212121 form,
(C) wild-type SOD1 and (D) H48Q SOD1 grown at pH 5 in the P21 form.
3.5 4-(4-methyl-1,4-diazepan-1-yl)quinazoline (MDQ)
Figure 3.7 describes the structure of 4-(4-methyl-1,4-diazepan-1-yl)quinazoline (MDQ). This compound is very similar to MDTQ with an unmodified homopiperazine group at C4 but the trifluoromethyl at quinazoline ring position C2 is removed. Like the previous two compounds, MDQ has good solubility in aqueous buffers. This compound was entered in to the SOD1 screening pipeline (Table 3.4) and, as expected, was found to interact with SOD1 at the Trp32 site on the surface of strand 3 of the β-barrel (Figure 3.8A).
Figure 3.7. The structure of MDQ (4-(4-methyl-1,4-diazepan-1-yl)quinazoline). The quinazoline numbering system is shown, Mr 242.15 g Mol-1.
Variant I113T I113T wild-type L38V H48Q
Resolution (Å) 1.22 2.29 1.35 1.21 1.6
Space group P21 C2221 P21 P212121 P21
pH 5.0 8.0 5.0 5.0 5.0
Unit cell parameters:
a (Å) 38.0 165.0 38.3 50.6 38.8
b (Å) 68.2 202.9 68.1 68.1 68.3
c (Å) 49.0 144.1 49.3 74.3 50.4
α (o) 90.0 90.0 90.0 90.0 90.0
β (o) 104.1 90.0 104.3 90.0 105.4
γ (o) 90.0 90.0 90.0 90.0 90.0
Completeness (%) 97.3 (87.2) 99.4 (96.8) 95.5 (76.8) 98.1 (90.9) 96.4 (95.3) Redundancy 3.5 (2.8) 7.1 (6.5) 3.4 (2.3) 8.9 (4.9) 3.6 (3.8) R-merge (%) 8.0 (52.2) 14.9 (83.9) 7.1 (35.6) 9.5 (75.7) 14.0 (48.4)
I/σ 9.7 (1.9) 11.52 (2.14) 10.52 (2.14) 12.82 (2.06) 6.3 (2.3) Rfact / Rfree (%) 12.5 / 15.9 16.4 / 21.7 16.5 / 21.8 15.7 / 20.1 25. 6 / 30.1
RMS bond (Å) 0.014 0.015 0.014 0.012 0.016
Figure 3.8. MDQ bound to I113T SOD1. (A) MDQ with respect to the SOD1 dimer in grey and light grey, strands 2, 3 and 6 of the SOD1 β-barrel are coloured yellow, purple and green respectively. (B) 2Fo-Fc
Figure 3.9. MDQ bound to multiple SOD1 mutants. 2Fo-Fc electron density maps contoured at 1σ of MDQ
bound at the Trp32 site in (A) I113T SOD1 pH 8 C2221 crystal structure (B) L38V SOD1 in the P212121 form,
3.6 4-(4-methylpiperazin-1-yl)-2-(trifluoromethyl)quinazoline (MPTQ)
The compound presented in Figure 3.10, 4-(4-methylpiperazin-1-yl)-2-(trifluoromethyl)quinazoline (MPTQ) is another quinazoline derivative which differs from the original MDTQ compound published by Antonyuk et al 123 only by the omission of a
carbon and two hydrogens from the homopiperazine moiety to form methylpiperazine (Figure 3.10). This change brings about a reduction in molecular mass from 310.14 to 296.12 gMol-1 and an increase in ClogP of 2.75 to 2.77 for MDTQ and MPTQ respectively.
MPTQ has a much lower solubility in water than MDTQ despite such small changes in physical characteristics. Consequentially, this compound could not be used at the 50 mM crystal soaking concentration which is standard in much published ligand soaking work and has been used thoughout this study. In practice the maximum concentration at which MPTQ could be used was 1 mM as there is a trade-off between crystallisation precipitant and solubilising agent concentrations that can be used in the soaking buffer, in this case ammonium sulphate and DMSO.
Figure 3.10. The structure of MPTQ (4-(4-methylpiperazin-1-yl)-2-(trifluoromethyl)quinazoline). The quinazoline numbering system is shown, Mr 296.12 gMol-1.
Figure 3.11. MPTQ bound to I113T SOD1. 2Fo-Fc electron density map contoured at 1σ of MPTQ with
partial occupancy at the Trp32 site in the P21 crystal structure I113T SOD1 at pH 5.
Variant I113T
Resolution (Å) 1.57 Space group P21
pH 5.0
Unit cell parameters:
a (Å) 30.6
b (Å) 68.0
c (Å) 50.6
α (o) 90.0
β (o) 105.6
γ (o) 90.0
Completeness (%) 98.1 (90.6) Redundancy 3.6 (3.1) R-merge (%) 8.6 (62.9)
I/σ 11.1 (2.1) Rfact / Rfree (%) 17.4 / 21.5
RMS bond (Å) 0.015
3.7 Quinazoline Summary
The quinazoline ring system is a versatile scaffold used in many therapeutic applications including antibacterials 125, antimalarials 126, cancer treatments 127 and analgesics 128.
Antonyuk et al previously documented an interaction between SOD1 and the quinazoline derivative 4-(4-methyl-1,4-diazepan-1-yl)-2-(trifluoromethyl)quinazoline (MDTQ) 123.
3.8 5-Fluorouridine
Fluorinated pyrimidine analogues, such as 5-fluorouracil, are widely used as anti-tumor therapeutics. 5-Fluorouracil is a member of the antimetabolite class of cancer treatments and exerts an effect by conversion to 5-fluorouridine which is in turn phosphorylated. The resulting compound forms a stable complex with thymidylate synthase inhibiting deoxythymidine monophosphate synthesis or is incorporated into nascent mRNA where it disrupts much of its normal function 129.
5-Fluorouridine is a nucleoside derivative composed of a single uracil ring substituted at C5 with fluorine and a ribose ring at N3 (Figure 3.12). While it is a more potent anti-tumor agent than 5-fluorouracil and the highly similar 5-fluoro-2'deoxyuridine it is not in clinical use due to strong associated side effects.
Figure 3.12. The structure of 5-fluorouridine. The pyrimidine numbering system is shown. Mr 262.02 gMol-1.
Nowak et al highlighted 5-fluorouridine as a potent inhibitor of in vitro SOD1 aggregation
130. This group used in silico methods to find compounds with a potential to bind at a
hydrophobic pocket at the SOD1 dimer interface centred on Val7, Gly146 and Val147 from opposing monomers 131. By occupying this site a perceived instability in the SOD1 mutant
dimer that promotes monomerisation was abrogated and aggregation propensity was returned to a level equivalent to that seen in the wild-type protein. The uracil moiety was prevalent in this first group of compounds which were then further modified for greater specificity, activity and improved ADME properties 130. 5-Fluorouridine was a member of
5-Fluorouridine and other compounds from both studies described above 130,131 have great
promise as SOD1 therapeutic leads but have never been directly visualised in situ at the Val7-Gly146-Val147 pocket. This compound was entered into the SOD1 screening pipeline not only to gain important structural information regarding its mode of binding with the aim of further optimisation but also to gain an improved understanding of SOD1 related fALS pathogenesis. Crystallographic data relating to this compound bound to several SOD1 variants are presented in Table 3.6.
Variant I113T I113T wild-type L38V H48Q
Resolution (Å) 1.06 1.95 1.28 1.24 1.53
Space group P21 C2221 P21 P212121 P21
pH 5.0 8.0 5.0 5.0 5.0
Unit cell parameters:
a (Å) 38.0 165.2 38.6 50.0 38.7
b (Å) 68.1 203.2 68.2 67.6 68.0
c (Å) 49.1 144.4 50.2 74.0 50.5
α (o) 90.0 90.0 90.0 90.0 90.0
β (o) 104.2 90.0 105.1 90.0 105.6
γ (o) 90.0 90.0 90.0 90.0 90.0
Completeness (%) 87.8 (68.2) 99.9 (99.5) 96.4 (74.5) 91.0 (56.0) 99.7 (99.7) Redundancy 2.4 (1.6) 7.0 (6.5) 3.5 (2.5) 5.8 (2.4) 3.6 (3.6) R-merge (%) 7.0 (41.7) 11.9 (68.1) 5.4 (47.5) 7.4 (48.7) 8.0 (26.2)
I/σ 7.5 (1.5) 12.0 (2.8) 18.7 (1.9) 12.8 (1.7) 9.7 (4.1) Rfact / Rfree (%) 16.2 / 20.0 17.6 / 20.9 12.8 (17.8) 15.0 / 19.0 20.7 / 24.4
RMS bond (Å) 0.015 0.014 0.014 0.014 0.015
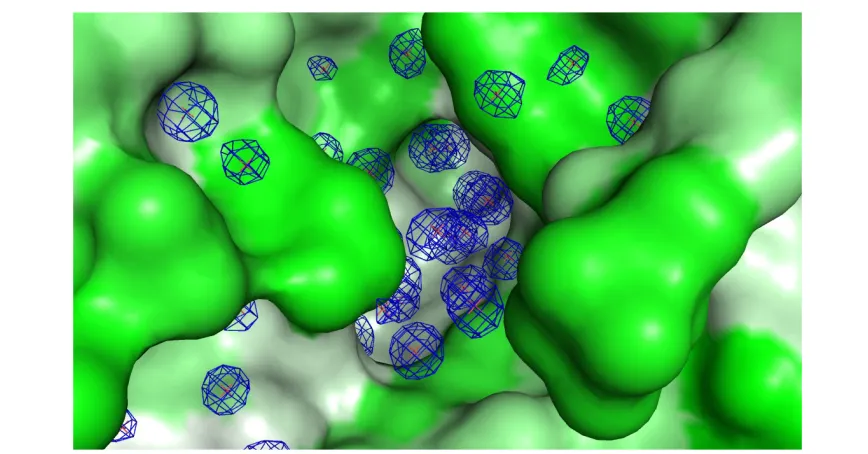
Figure 3.13. The I113T dimerisation region hydrophobic pocket after crystal soaking with 5-fluorouridine. (A) The position of the Val7-Gly146-Val147 pocket with residues highlighted cyan and (B) 2Fo-Fc electron
density maps contoured at 1σ of solvent in this pocket in the I113T SOD1 crystal structure after soaking with 50 mM 5-fluorouridine for 2 hours. The pocket is shown from two angles with no sign of electron density corresponding to 5-fluorouridine.
Figure 3.14. 5-Fluorouridine bound to I113T SOD1. (A) 5-Fluorouridine with respect to the SOD1 dimer in grey and light grey, strands 2, 3 and 6 of the SOD1 β-barrel are coloured yellow, purple and green respectively. (B) 2Fo-Fc electron density map of 5-fluorouridine contoured at 1σ at the Trp32 binding site
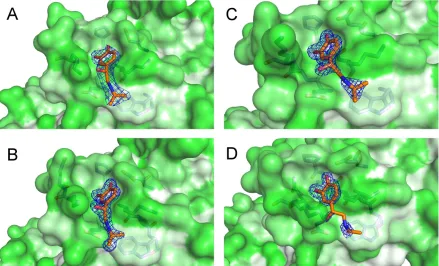
Figure 3.15. 5-Fluorouridine bound to multiple SOD1 mutants. 2Fo-Fc electron density maps contoured at 1σ
of 5-fluorouridine bound at the Trp32 site in (A) I113T SOD1 pH 8 C2221 crystal structure (B) L38V SOD1
in the P212121 form, (C) wild-type SOD1 and (D) H48Q SOD1 grown at pH 5 in the P21 form.
During the course of structure refinement it became clear that 5-fluorouridine does bind SOD1 at the Trp32 site (Figure 3.14). This is not unsurprising given the ability of tryptophan to engage molecules in non-specific stacking interactions however 5-fluorouridine also potentially makes a hydrogen bond between the C2 carbonyl and the Ser98 side-chain (Table 3.7).
Donor I113T wtSOD1 L38V H48Q Acceptor
Ser98-OH 3.7 Å 3.9 Å 4.3 Å 4.4 Å O=C2-5-Fluorouridine
Table 3.7 Summary of potential hydrogen bonding between 5-fluorouridine and SOD1 at the Trp32 site. A value is not shown for 5-fluorouridine bound in the C2221 structure as the hydrogen bond distances are too
large.
5-Fluorouridine's interaction with the I113T Trp32 site is mediated though the pyrimidine ring and its substituents. In the structure presented there is very little electron density that can be attributed to the ribose ring and there are no available bonding partners indicating it is freely able to rotate around N3-C bond.
and wild type SOD1 in the P21 crystal form grown at pH 5 indicates this binding is
repeatable and consistent in form (Figure 3.15B, C and D). In each case there is good electron density associated with the pyrimidine group, which forms two hydrogen bonds with the SOD1 Lys30 and Ser98 side-chains. Conversely, 5-fluorouridine binding at pH 8 is of a slightly different character. In this case the uracil ring is rotated over Trp32 bringing the C6 carbonyl into hydrogen bonding distance (3.6 Å) with the Glu21 side-chain carboxyl. Again the ribose group shows little electron density when contoured at 1σ.
To summarise, 5-fluorouridine was predicted to bind to SOD1 at a pocket close to the dimerisation region. This compound was observed to effectively inhibit SOD1 mutant aggregation in vitro 130. Here we are unable to find any evidence of that this compound
binds at the predicted site. This is despite numerous crystal soaking experiments against several SOD1 variants. One can however observe some electron density attributable to 5-fluorouridine at the Trp32 binding site described by Antonyuk et al 123 and explored in
3.9 Isoproteranol
Isoproteranol is a licensed sympathomimetic inotropic drug used in the treatment of several cardiac conditions and asthma 132 although in the latter case it has largely been superseded
by newer therapeutics due to complications arising from dosing 133. It is a synthetic
catecholamine and isopropyl derivative of epinephrine (Figure 3.16) which acts on the β1 and β2 adrenergic receptor.
Figure 3.16. The structure of isoproteranol (also known as: Isoprenaline, Isuprel and Medihaler-iso). 211.3 gMol-1.
Isoproteranol was also proposed as a SOD1 binding compound targeted to the Val7-Gly146-Val147 pocket 130. This is particularly interesting in light of recent findings
implicating isoproteranol in effective down regulation of SOD1 mRNAs in Wistar rat myocardium tissue following 7 days of repeated dosing 134. While this effect has not been
researched in man and may result from a number possible non-specific processes this compound is clearly worth investigation in regard to its potential interaction with SOD1. Isoproteranol was soaked into crystals of SOD1 and the bound structures were analysed for ligand binding (Table 3.8).
Figure 3.17 shows the Val7-Gly146-Val147 pocket of I113T SOD1 after crystal soaking with isoproteranol. The result is much the same as that described in the previous section dealing with 5-fluorouridine, while electron density associated with ordered water molecules is clearly visible there is nothing which represents the ligand.
Binding is repeatable, not SOD1 mutant specific and pH independent (Figure 3.18 and 3.19).
Variant I113T I113T wild-type L38V H48Q
Resolution (Å) 1.45 2.2 1.34 1.53 1.53
Space group P21 C2221 P21 P21 P21
pH 5.0 8.0 5.0 5.0 5.0
Unit cell parameters:
a (Å) 37.9 165.1 38.3 38.0 38.2
b (Å) 68.0 203.5 68.0 67.8 67.9
c (Å) 49.3 144.6 50.5 49.9 49.7
α (o) 90.0 90.0 90.0 90.0 90.0
β (o) 104.0 90.0 105.3 104.6 104.4
γ (o) 90.0 90.0 90.0 90.0 90.0
Completeness (%) 98.0 (94.2) 99.7 (98.6) 98.7 (87.3) 99.7 (99.7) 99.7 (99.7) Redundancy 3.6 (3.4) 7.4 (7.3) 3.79 (3.27) 3.5 (3.6) 3.5 (3.6) R-merge (%) 5.3 (26.0) 14.9 (91.2) 6.8 (42.1) 11.1 (31.3) 7.1 (16.0)
I/σ 15.2 (4.3) 13.32 (2.82) 10.99 (2.60) 6.9 (3.1) 11.8 (6.1) Rfact / Rfree (%) 15.7 / 18.8 19.5 / 23.1 18.1 / 19.7 24.3 / 30.0 20.0 / 22.8
[image:52.595.100.537.122.414.2]RMS bond (Å) 0.016 0.014 0.015 0.015 0.015
Table 3.8. Single crystal X-ray diffraction data collection, processing and model refinement statistics for isoproteranol bound to SOD1.
Figure 3.17. The I113T dimerisation region hydrophobic pocket after crystal soaking with isoproteranol. 2Fo
-Fc electron density map contoured at 1σ of the I113T SOD1 Val7-Gly146-Val147 pocket with solvent after 2
[image:52.595.100.534.481.708.2]Figure 3.18. Isoproteranol bound to I113T SOD1. (A) Isoproteranol with respect to the SOD1 dimer in grey and light grey, strands 2, 3 and 6 of the SOD1 β-barrel are coloured yellow, purple and green respectively. (B) 2Fo-Fc electron density map of isoproteranol contoured at 1σ at the β-barrel loop II site with the SOD1
Figure 3.19. Isoproteranol bound to multiple SOD1 mutants. 2Fo-Fc electron density maps contoured at 1σ of
the loopII/catecholamine pocket with Isoproteranol bound in (A) I113T SOD1 pH 8 C2221 crystal structure
(B) L38V SOD1 , (C) wild-type SOD1 and (D) H48Q SOD1 grown at pH 5 in the P21 form.
Donor I113T wtSOD1 L38V H48Q I113T pH8 Acceptor
Isoproteranol C1-OH 2.4 Å 2.6 Å 2.6 Å 2.5 Å 3.6 Å COOH-Glu100
Isoproteranol C1-OH 3.4 Å 3.2 Å 3.2 Å 3.4 Å 3.4 Å O=C-Pro28
Isoproteranol C2-OH 2.8 Å 2.8 Å 2.7 Å 2.9 Å 3.1 Å O=C-Pro28
Isoproteranol C2-OH 3.1 Å 3.1 Å 3.2 Å 3.2 Å 3.4 Å O=C-Glu21
Isoproteranol C2-OH 3.3 Å 3.4 Å 3.3 Å 3.4 Å 3.3 Å H2O
Isoproteranol tail-OH 3.1 Å 3.6 Å 4.3 Å 3.1 Å 4.7 Å O=C-Glu21
Isoproteranol tail-NH 3.5 Å 3.6 Å 3.3 Å 4.1 Å 3.7 Å O=C-Glu21
Table 3.9. Summary of potential hydrogen bonding interactions between SOD1 and isoproteranol in the loop II binding site.
hydrophobic interaction with the Trp32 indole however its occupancy is lower than the rest of the molecule indicating a degree of flexibility. In an unbound SOD1 structure the Lys30 side-chain is able to move freely and is not visible after the β or γ carbon. Here space is limited by the presence of isoproteranol and the fully visible Lys30 side chain is forced to move towards Ser98. Other than this deformation the SOD1 dimer remains unperturbed with a whole molecule RMSD of 0.26 Å compared with the atomic resolution crystal structure of wild-type SOD1 (2C9V) 51 (Figure 3.20).
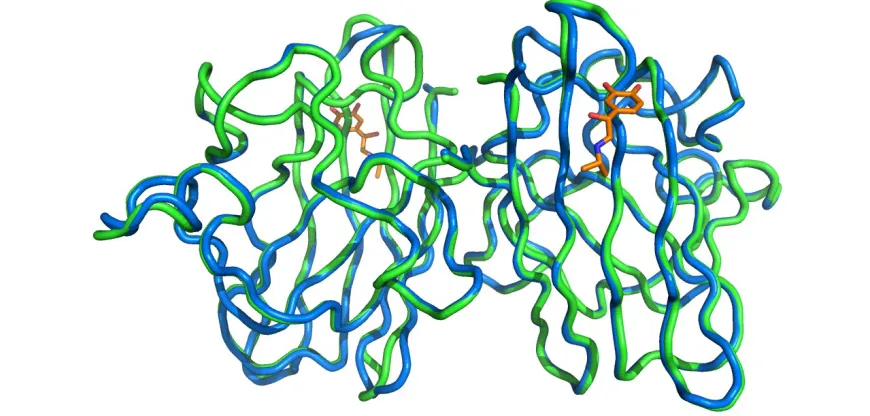
Figure 3.20. Comparison of I113T SOD1 in the native and isoproteranol bound states. Structural alignment, RMSD = 0.25 Å, of I113T SOD1 with isoproteranol bound at the loop II site (blue and orange) with the structure of wild-type SOD1 (2C9V) (green). In each case the protein backbone is represented as a ribbon.
To summarise, we find that isoproteranol does not occupy the Val7-Gly146-Val147 pocket in any of the SOD1 structure presented here. In each of these structures, isoproteranol can be found at multiple positions some of which are attributed to crystal lattice contacts however one site is not lattice dependent. Ligand binding at this loop II site is likely to create several hydrogen bonds with the protein and each of the ligand's four possible hydrogen bond donor groups are involved in this interaction.