1
Effects of Diameter on the Durability of Glass-Fiber-Reinforced-Polymer
1(GFRP) Bars Conditioned in Alkaline Solution
23
Brahim Benmokrane,1 Allan Manalo,2 Jean-Charles Bouhet,3 Khaled, Mohamed4, 4
and Mathieu Robert5 5
6
ABSTRACT 7
Current standards do not consider the diameter of glass-fiber-reinforced-polymer (GFRP) bars 8
used as internal reinforcement in concrete structures to be a factor influencing bar durability. 9
This paper investigates the effects of bar diameter on the physical and mechanical properties as 10
well as the durability of GFRP reinforcing bars conditioned for three months at 60°C in an 11
alkaline solution simulating a concrete environment. Five diameters (nominal diameters of 9.5 12
mm, 12.7 mm, 15.9 mm, 19.1 mm, and 25.4 mm) were considered; bar properties were assessed 13
before and after conditioning. Microstructural analyses and measurement of physicochemical 14
properties were also carried out. The results show that bar size had no significant effect on bar 15
physical properties, except for water absorption. The smaller diameter bars had higher water 16
absorption than the larger ones due to their higher surface-area-to-volume ratios. In the case of 17
the unconditioned bars, the tensile strength and modulus were not significantly affected by bar 18
diameter, but there was a size effect for interlaminar shear strength and flexural strength. On the 19
other hand, the conditioning in the alkaline solution had a greater negative effect on the tensile 20
strength of the larger bars than on the smaller ones. Scanning-electron-microscope (SEM) 21
observations and Fourier-transform-infrared-spectroscopy (FTIR) analysis revealed that the 22
degradation remained at the surface of all the conditioned specimens. Nevertheless, there were 23
2
different diameters. This indicates that the current provisions in standards that do not relate 25
strength-retention limit to bar size are acceptable. 26
27
Keywords: GFRP reinforcing bars; diameter; durability; mechanical; properties retention; alkaline 28
environment, concrete 29
30 31
1Professor, Canada Research Chair in Advanced Composite Materials for Civil Structures,
32
NSERC Research Chair in Innovative FRP Reinforcement for Concrete Infrastructures, 33
Department of Civil Engineering, University of Sherbrooke, Sherbrooke, Quebec, Canada, J1K 34
2R1, Phone: 819-821-7758, Fax: 819-821-7974, E-mail: [email protected]
35
2Senior Lecturer, Centre for Future Materials, Faculty of Health, Engineering and Sciences,
36
University of Southern Queensland, Toowoomba, Queensland 4350, Australia. E-mail: 37
38
3M.Sc Candidate, Department of Civil Engineering, University of Sherbrooke, Sherbrooke,
39
Quebec, Canada J1K 2R1, E-mail: [email protected]
40
4Postdoctoral Fellow, Department of Civil Engineering, University of Sherbrooke, Sherbrooke,
41
Quebec, Canada J1K 2R1, E-mail: [email protected]
42
5Professor, Dept. of Civil Engineering, Univ. of Sherbrooke, QC, Canada J1K 2R1. E-mail:
43
3 INTRODUCTION
46
Glass fiber-reinforced-polymer (GFRP) bars have emerged as an attractive alternative to steel 47
reinforcement in concrete structures because of their corrosion performance in aggressive 48
environmental conditions. These composite reinforcing bars have attracted significant interest 49
because of their superior properties such as light weight, high mechanical properties, and 50
neutrality with respect to electrical and magnetic disturbances. The results of several 51
experimental studies, establishment of materials specifications, publication of design codes and 52
guidelines, and successful field applications in concrete structures have driven the worldwide use 53
and acceptance of GFRP bars (ACI 440.1R, CSA S6, CSA S806, CSA S807, fib 2007, 54
Benmokrane et al. 2006; Drouin et al. 2011, Manalo et al. 2014; Mohamed and Benmokrane, 55
2016 & 2015, Arafa et al, 2016, Ahmed et al., 2016). As a result, a variety of GFRP bars 56
manufactured with various fibers and resins as well as various surface geometries are now 57
commercially available (ACI 440.1R). Like steel reinforcement, GFRP bars are available in 58
diameters ranging from 6 mm to 36 mm (ACI 440.1R); larger diameter bars can be also 59
manufactured. Unlike steel reinforcement, whose properties can be assumed to be the same for 60
different bar diameters, GFRP bars are size dependent in terms of longitudinal strength due to 61
shear-lag effect (Bank 2006). To illustrate, Hollaway (2008) measured a reduction in tensile 62
strength of up to 40% when the bar diameter increased from 9.5 mm to 20 mm. For these 63
reasons, manufacturers are required to fully report the characteristic strength, stiffness, physical, 64
and durability properties for every type and size of FRP bar. 65
The mechanical, physical, and durability characteristics are important information needed in 66
the material specifications and design of FRP bars. These properties should be determined in 67
4
also be made available to design engineers, asset owners, and building-code and standard-writing 69
authorities (Micelli and Nanni 2004). More importantly, the physical, mechanical, and durability 70
properties of every commercially available and newly developed GFRP bar should comply with 71
the limits specified in the current standards and specifications (ACI 440.6, CSA S807). While the 72
minimum specified mechanical properties are available for each bar diameter, the current ACI 73
and CSA standards and specifications (ACI 440.6, CSA S807) do not relate the requirement 74
limits in terms of physical and durability properties to FRP-bar size. This is because there have 75
been few studies investigating the effect of GFRP-bar size on physical and durability properties. 76
The durability of GFRP bars is a complex problem because it depends upon the components 77
of the composite material (Bakis, 1993, Benmokrane and Rahman 1998, Hollaway 2010). In 78
particular, the reaction of GFRP bars to the alkali in concrete has received significant attention 79
due to their importance in construction applications (Porter et al. 1997, Bakis et al. 1998, 80
Nkurunziza et al. 2005, Chen et al. 2007, Robert et al. 2013, Belarbi and Wang 2012, Kamal and 81
Boulfiza 2011). As internal reinforcement, FRP bars are embedded in a cementitious 82
environment aggressive to glass FRPs (GFRPs) due to the high pH level of the pore-water 83
solutions and the presence of alkali ions (Porter et al. 1997, Micelli and Nanni 2004, Robert et al. 84
2009). Most of the cases available to date focusing on the physical and durability properties of 85
GFRP bars have involved small-diameter bars. Tannous and Saadatmanesh (1999) investigated 86
the durability characteristics of 10 mm and 19.5 mm diameter vinyl ester and polyester-based 87
AR-Glass FRP bars. Their results showed very small changes in the elastic modulus (0% to 2%). 88
The tensile strength retained after 6 months exposure to an alkaline solution (pH=12) at 60 oC 89
was only 72% to 77% for 10 mm bars, but 83% to 86% for 19.5 mm diameter bars. Furthermore, 90
5
polyester. Similarly, Micelli and Nanni (2004) investigated the durability of GFRP rods 92
subjected to alkaline exposure and high temperature (60 oC). While they considered two different
93
diameters of GFRP rods, the 12 mm diameter bars were made from thermoplastic resin, while 94
the 6.35 mm diameter bars were made from polyester resin. Their results revealed no degradation 95
in the GFRP bars made with thermoplastic resin, but a reduction in tensile strength of up to 40% 96
in the bars made with polyester resin after 42 days. Robert et al. (2009) conducted an accelerated 97
aging test of 12.7 mm vinylester based GFRP bars with a fiber content of 77.9% by weight 98
embedded in concrete. They found that the GFRP bars in alkaline solution experienced strength 99
losses more than 3 times that of the GFRP bars aged in moist concrete. Most recently, 100
Benmokrane et al. (2015) conducted a comparative durability study of 6 mm glass/vinylester, 101
basalt/vinylester, and basalt/epoxy FRP bars. Their test results revealed that basalt/epoxy FRP 102
bars has better mechanical property retention than basalt/vinylester. The results from these 103
studies primarily provide the basis which the current design guidelines and codes can use in 104
developing generalized requirement limits as well as similar environmental reduction factors for 105
all GFRP-bar sizes. Clearly, there is a gap in research investigating the durability characteristics 106
of GFRP bars of different sizes and correlating them with their important physical and 107
mechanical properties. 108
This paper systematically investigates the physical and mechanical properties of GFRP bars 109
of different diameters. It aims to correlate the physical and long-term characteristics of FRP bars 110
with bar diameters for their effective use and to provide guidance in the development of design 111
codes and material specifications for this reinforcing material. In the first stage, the physical and 112
chemical properties of the unconditioned bar materials were determined. In the second stage, the 113
6
environment. Mechanical characterization of these conditioned bars was then conducted and 115
compared to that of the unconditioned bars. Microstructural analyses and measurements of the 116
physicochemical properties were also carried out on the conditioned and unconditioned GFRP 117
bars. The findings from these studies are provided in this paper. 118
EXPERIMENTAL PROGRAM 119
Materials 120
The sand-coated GFRP bars used in this study were made of continuous boron-free glass fibers 121
(EC-R) impregnated in a vinylester-based resin matrix and were manufactured according to the 122
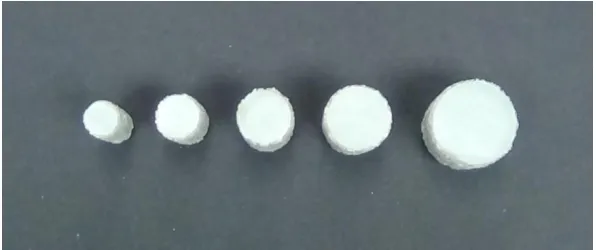
pultrusion process by a Canadian company (Pultrall Inc., Thetford Mines, Quebec). Five 123
diameters of GFRP bars were investigated (#3, #4, #5, #6, and # 8), which correspond to nominal 124
diameters of 9.5 mm, 12.7 mm, 15.9 mm, 19.1 mm, and 25.4 mm, respectively, as shown in 125
Figure 1. The technical specifications for these bars can be found in the data sheets reported by 126
Pultrall (2012). 127
Specimen Details 128
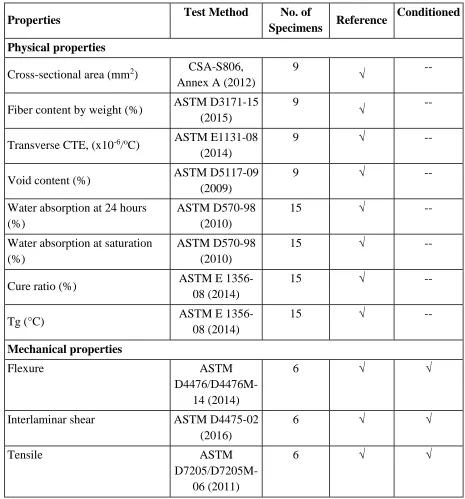
The preparation of specimens and characterization of the physical and mechanical properties of 129
the GFRP bars were performed according to the appropriate ASTM, ACI, and CSA test 130
standards. Table 1 summarizes the test methods as well as the number of specimens tested for 131
each type of test and bar size. The specimens were cut and prepared in accordance with the 132
recommendation of the appropriate test standards. 133
Bar Conditioning 134
The GFRP bars were separated into two series. The first series consisted of unconditioned 135
reference bars; the second comprised GFRP bars conditioned in an alkaline solution for 90 days 136
at 60°C. The alkaline solution used comprised 118.5 g of Ca(OH)2, 0.9 g of NaOH, and 4.2 g of
7
KOH for 1 L of water. The solution had a pH of 12.6, which is representative of a mature 138
concrete pore solution. The conditioning temperature was set at 60°C, as specified in ASTM 139
D7705/D7705M-12 (2012). The conditioning was conducted in accordance with ACI 440.3R-12 140
(2012), Test method B.6, and CSA-S806-12 (2012), Annex O. During conditioning, the level of 141
alkaline solution and pH level were checked periodically, and new solution added as necessary. 142
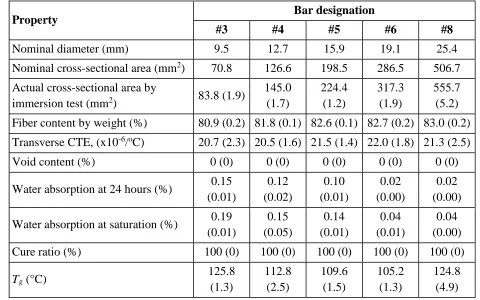
PHYSICAL PROPERTIES OF THE GFRP BARS 143
Table 2 summarizes the physical properties of the GFRP bars. The values listed within 144
parentheses represent the standard variation of the test results. 145
Actual Cross-Sectional Area by Immersion Test 146
The actual cross-sectional area of the GFRP bars was measured in accordance with CSA-S806 147
(2012), Annex A. A plastic cylinder and a scale capable of measuring weight up to an accuracy 148
of 1 g were used. Twenty-four 270 mm long specimens were prepared for each bar diameter and 149
tested. All specimens were kept in the test environment for 24 hours prior to weighing and 150
measuring. All the bars are oversized when compared to their respective nominal cross-sectional 151
areas (Table 2). The average measured oversize varied from 9% to 18%, as seen with the largest 152
(#8) and smallest (#3) bars, respectively. This variation is due to the ratio difference of the sand 153
coating to the core. According to the average measured surface area, all bar diameters meet the 154
Grade III requirements of the Ministry of Transport Ontario's special provision for glass-fiber-155
reinforced-polymer reinforcing bar. 156
Fiber Content 157
The fiber content of the GFRP bars was calculated according to ASTM D3171-15 (2015). Nine 158
specimens for each bar diameter were identified, dried, and weighted. The bars were then placed 159
8
remaining fibers were weighed in order to get the fiber weight ratio. Since the bars were sand 161
coated, the weight of the sand was measured separately and subtracted from the initial weight. 162
Table 2 shows that the fiber content increased slightly with bar diameter, from 80.9% of fibers 163
by weight for the #3 bars to 83.0% for the #8 bars. It should be noted, however, that the limits 164
specified in CSA S807 (2010) for the glass fiber fraction by weight is only 70%. 165
Transverse Coefficient of Thermal Expansion 166
The transverse coefficient of thermal expansion was calculated according to ASTM E1131-08 167
(2014). Nine specimens were tested for each bar diameter. The measurements were conducted 168
between -30°C and 60°C at a heating rate of 3°C. A TA Q400 thermomechanical analyser was 169
used. Cryogenic equipment (liquid nitrogen) was used to reach subzero temperatures. The results 170
show that the coefficients of thermal expansion for the different bar diameters fall between 171
20.5x10⁻⁶/°C and 22.0x10⁻⁶/°C, which is only half of the limit of 40.0x10⁻⁶/°C specified in CSA
172
807 (2010). 173
Void Content 174
The void content of the GFRP bars was measured with the wicking test according to ASTM 175
D5117-09 (2009). Five specimens 25 mm in length for each bar diameter were placed into a dye 176
penetrant solution from a mixture of basic fuchsin (C20H19N3HCl) and methyl hydrate with a
177
1:100 weight ratio. The wicking action is revealed by the apparition of spots on the side of the 178
specimen not immersed in the solution. The tests were made at a room temperature and relative 179
humidity of 23oC and 50%, respectively. Before the test, a precautionary nail-polish shield 180
recommended by ASTM D2374-05 (2011) was applied in order to prevent wicking along the bar 181
periphery. The dye penetrant solution is poured in a disposable pan so that only the bottom three 182
9
after 15 minutes of immersion. No colored dots were observed in any of the specimens, 184
indicating that there were no voids or cracks running through the length of the bars. As specified 185
in CSA 807 (2010), the void content in FRP bars should be no greater than 1%. 186
Water Absorption 187
The water absorption of the bars after 24 hours and at saturation was determined according to 188
ASTM D 570-98 (2010). Nine specimens 75 mm in length were prepared, dried, and weighed for 189
each bar diameter. These specimens were then entirely immersed in distilled water at 60°C. The 190
samples were removed from the water after 24 hours, surface dried, and weighed. Then, they 191
were placed in water again until full saturation, i.e., when the weight increase in three 192
consecutive weightings was less than 1%. In calculating the water absorption, the loss of sand 193
coating was considered by weighing the specimens two times, i.e., just after removing the 194
specimens from water and after 24h of oven drying at 60°C. The difference between the two 195
measurements gave the real mass of absorbed water. 196
The water absorption of the GFRP bars at 24 hours and at saturation was found to decrease as 197
the diameter of the bars increased. The maximum absorption of the #3 bars after 24 hours and at 198
saturation was 0.152% and 0.195%, respectively. This low water absorption for the GFRP bars 199
considered herein—even at saturation—is due to the low moisture diffusion of the vinylester 200
resin, as indicated by Tannous and Saadatmanesh (1999). For FRP reinforcing bars, the limit of 201
water absorption after 24 hours specified in CSA-S807 (2010) is 0.25%. The values at saturation 202
are 1% and 0.75% (high durability) in ACI 440.6M (2008) and CSA-S807 (2010), respectively. 203
This shows that the water absorption of the GFRP bars with different diameters is well within the 204
allowable specified limit in current standards. 205
10
Cure Ratio (%) and Glass Transition Temperature (Tg)
207
The cure ratio and glass transition temperature, Tg, of the GFRP bars were determined by
208
differential scanning calorimetry (DSC) according to the ASTM E 1356-08 (2014) test method. 209
For this test, nine pieces weighing about 20 mg were cut from the center of the core of each bar, 210
weighed, and placed in an aluminum pan. The specimens were then heated from 25°C to 180°C 211
at a rate of 10°C/min. The Tg obtained for all bar diameters ranged from 105oC to 125oC for the
212
GFRP bar, which is higher than the limit of 100°C specified in CSA S807 (2010) and ACI 213
440.6M (2008). Similarly, a cure ratio of 100% was measured for all bar diameters. It is worth 214
noting that the specified cure ratio for GFRP bars is only 95% (CSA S807, 2010). 215
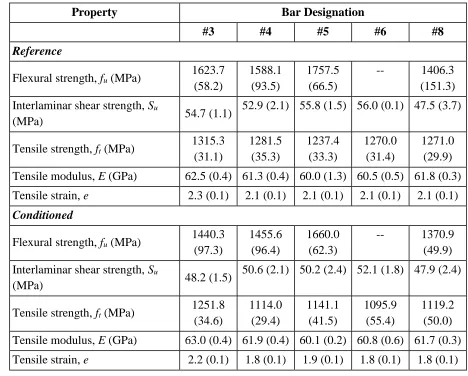
MECHANICAL PROPERTIES OF THE GFRP BARS 216
The mechanical properties of the unconditioned (reference) and conditioned GFRP bars with 217
different diameters were assessed under three-point flexural testing, short-beam shear testing, 218
and tensile testing. Due to the limited length of both the conditioned and unconditioned #6 GFRP 219
bar specimens provided by the industry partner, there were no remaining portions to conduct the 220
flexural testing for this bar size. Table 3 summarizes the results of the mechanical 221
characterization. The values listed within parentheses are the standard deviation of the test 222
results. The nominal diameter and nominal cross-sectional area of the GFRP bars were used in 223
calculating the mechanical properties. 224
Flexural Properties 225
Flexural testing was conducted for comparative assessment of the mechanical properties of the 226
FRP bars. The test was conducted in accordance with ASTM D4476/D4476M-14 (2014). The 227
unconditioned and conditioned specimens were tested over a simply supported span equal to 20 228
11
replicates for each bar diameter were tested under laboratory conditions on an MTS 810 testing 230
machine equipped with a 500 kN load cell. The specimens were loaded at the midspan with a 231
circular nose and supported at the ends on two circular supports that allowed the specimens to 232
bend, as shown in Figure 2a. A displacement control rate of 3.0 mm/min was used. The applied 233
load and deflection were recorded during the test with a data acquisition system monitored by a 234
computer. The flexural strength of the GFRP bars, fu, in the outermost fibers at midspan was
235
calculated as fu PLc/(4I), where P is the failure load, L is the clear span, c is the distance to 236
the centroid of the extreme-most fibers, and I is the moment of inertia. 237
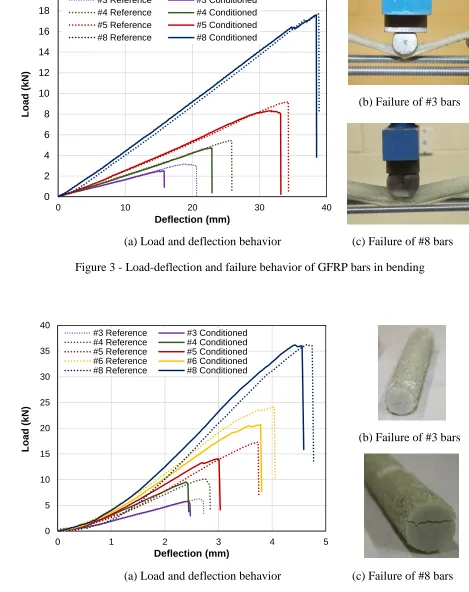
Under bending, the load–deflection behavior of all the specimens (Figure 3a) showed linear 238
behavior, but a slight reduction in stiffness was observed before final failure. This reduction of 239
stiffness is due to the initiation of compressive failure under the loading point, which is more 240
noticeable in the conditioned specimens than the reference samples. Moreover, the conditioned 241
samples failed at lower load and deflection than the reference samples, but with the same 242
bending stiffness prior to failure. Regardless of diameter, the bars failed due to compression in 243
the top fibers, followed by tensile failure at the bottom near the midpoint of the specimens 244
(Figures 3b and 3c). 245
Interlaminar Shear-Strength Properties 246
The short-beam shear testing was conducted following ASTM D4475-02 (2016) in order to 247
determine the interlaminar shear strength of FRP bars (Figure 2b). The short-beam shear test is a 248
matrix-dominated property and can give an indication of the resistance of the fiber–matrix 249
interface. The test was carried out with MTS 810 testing machine equipped with a 500 kN load 250
cell. Six replicates for each bar diameter were prepared and tested. The distance between the 251
12
rate of 1.3 mm/min was employed for the #3, #4, and #5 bars, while 1.8 mm/min was used for 253
the #6 and #8 bars. The applied load and displacement were recorded with a computer-monitored 254
data-acquisition system. The interlaminar shear strength Su of the FRP bar was calculated as
255
2 / 849 .
0 P d
Su , where P is the shear failure load and d is the bar diameter. 256
Figure 4 shows the results from short-beam shear testing. It can be seen that the applied load 257
increased linearly with the deflection with a slight nonlinearity before the final failure. This 258
nonlinear behavior before final failure is more apparent in the larger diameter bars. The 259
experimental results also show that the conditioned specimens failed at a lower load than the 260
reference samples. Micelli and Nanni (2004) indicated that the decrease in the apparent 261
horizontal shear strength of the conditioned GFRP bars is caused by resin damage due to 262
penetration of the alkaline solution. Both the unconditioned and conditioned specimens failed 263
due to horizontal shear cracks that originated from the edge of the bars and developed along the 264
length (Figures 4b and 4c). Park et al. (2008) indicated that very high interlaminar-shear stresses 265
can arise at the free edge of fiber composite materials. The only observed difference was the 266
more obvious compressive failure under the loading point and at the supports that occurred with 267
the larger diameter bars. This is due to the higher load needed to cause failure of the larger 268
diameter bars and achieve the same level of interlaminar shear stress, while the contact area 269
under the loading point was almost the same for all of the bar sizes. This observation explains the 270
nonlinear behavior of the bars before the final failure. 271
Tensile Properties 272
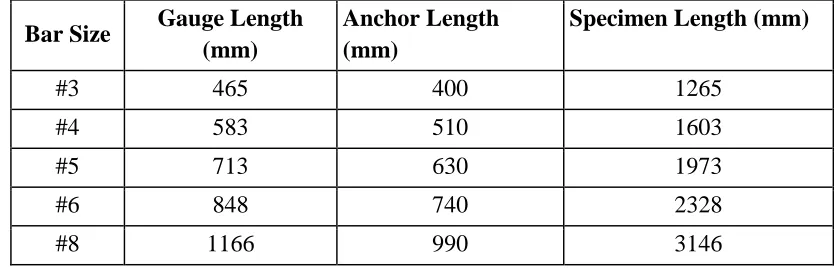
Tensile testing was conducted according to ASTM D7205/D7205M-06 (2011) and CSA-S806-12 273
Annex C. The tensile testing along the alignment of fibers is related to fiber properties. The 274
13
to the length of the anchorage steel tubes at each end of the GFRP bars, as specified in CSA-276
S806-12, Annex B. Table 4 provides the specimen and anchor length for each bar size. Each 277
specimen was instrumented with two LVDTs 200 mm in length to capture specimen elongation 278
during testing (Figure 1c). To avoid damaging the LVDTs, they were detached from the 279
specimen when the load reached 75% of the estimated ultimate load. The tests were carried out 280
with a Satec-Baldwin testing machine equipped with a 2000 kN load cell. The load was 281
increased at a rate of 300 MPa/min until tensile failure occurred. Six specimens were tested for 282
each bar diameter. The applied load and bar elongation were electronically recorded during the 283
test with a computerized data-acquisition system. This test determined the ultimate tensile 284
strength ft, tensile modulus E and tensile strain .
285
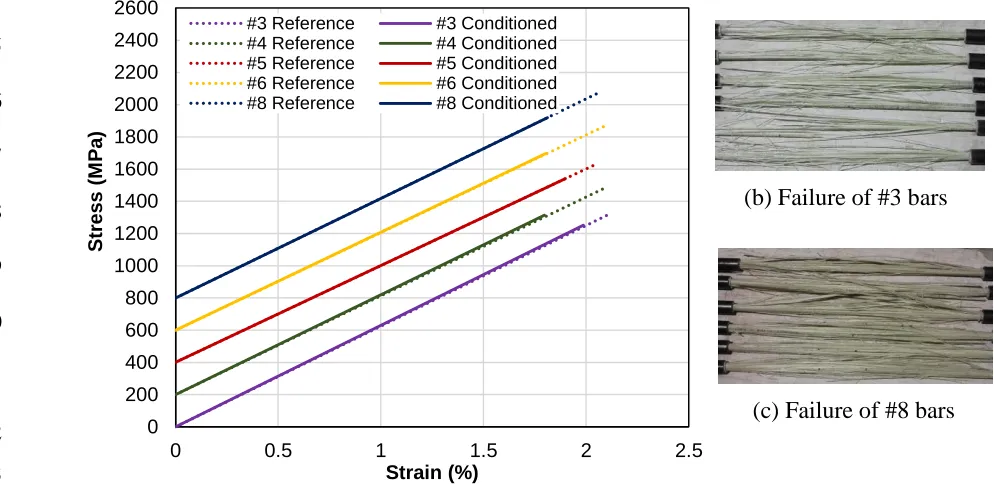
The typical stress strain behavior of the GFRP bars with different diameters is shown in 286
Figure 5a. All of the specimens behaved in a linear elastic fashion in tension up to failure and 287
exhibited almost identical slopes in the stress–strain curve. It is to be noted that the strain after 288
the LVDT’s were removed was calculated based on the stress and elastic modulus of the bars. 289
This behavior indicates that the elastic moduli of the bars with different diameters were similar 290
and that the loss of elastic modulus due to exposure to the simulated alkaline environment was 291
negligible. Nevertheless, the failure stress and rupture strain of the conditioned bars were lower 292
than that of the reference bars. Robert et al. (2009) had similar findings and they indicated that 293
the elastic modulus of the GFRP bars they tested was not affected by aging in a concrete 294
environment, but tended to be more brittle and evidenced lower strength than the reference bars. 295
Generally, rupture strain decreases as bar diameter increases. Figures 5b and 5c show that, 296
regardless of diameter, the GFRP bars tested failed at the middle of the bar (within the gauge 297
14
failure, a popping noise was heard caused by some of the fibers and/or the resin failing on the 299
outer perimeter of the bar. It is important to note that the measured tensile strength for both the 300
reference and conditioned bars (all bar diameters) was significantly higher than 655 MPa and 301
750 MPa, and that their elastic moduli were 39.3 GPa and 60 GPa, as specified in ACI 440.6M 302
and CSA S807-10, respectively for high modulus GFRP bars. Similarly, the failure strain was 303
higher than the prescribed 1.2%. 304
DISCUSSION 305
The effects of bar diameter on physical, mechanical, and durability properties are analyzed and 306
discussed in this section. 307
Effect of Bar Diameter on Physical Properties 308
The bar diameter had no significant effect on most of the physical properties of the GFRP bars, 309
including the transverse coefficient of thermal expansion, porosity, and Tg. Similarly, all of the
310
bars tested evidenced an entirely cured resin, indicating that bar diameter did not affect the 311
degree of cure. The development of an efficient production method makes this consistency 312
possible. This is in contrast with the observations made by Yi and Hilton (1988), who indicated 313
that laminate thickness might affect the degree of cure due to the higher thermal conductivity of 314
thicker composite laminates. On the other, the fiber content and water absorption were found to 315
increase and decrease, respectively, with increasing bar diameter. Since none of the FRP bars 316
contained voids, the lower water absorption for the larger diameter bars can be correlated to 317
increasing fiber content (by weight), as noted in section 2.4.1. Glass fibers absorb scarcely any 318
water, therefore the bars with higher matrix contents evidenced higher absorption rates. 319
In order to further correlate bar diameter to the percentage water absorption, the shape ratio of 320
15
shape ratio as the ratio between the sample's surface and volume. As can be seen in Figure 6a, 322
the shape ratio was significant in the water absorption of the GFRP bars at 24 hours (24 h) and at 323
saturation (Saturation), i.e., the water absorption increased as did the shape ratio. It can also be 324
observed that the relationship between the water absorption at 24 hours (%) and at saturation to 325
that of the shape ratio is the same, as demonstrated by the almost equal slopes of the water 326
absorption and shape-ratio relationship curves. On the another hand, there is a linear but negative 327
correlation between the shape ratio and bar diameter. The shape ratio decreases as the bar 328
diameter increases. This accounts for the smaller diameter bars having higher absorption rates 329
than the larger diameter ones with the same length, since the exposed surface is greater with 330
respect to volume. It is also worth noting that the decrease in the shape ratio is very similar to the 331
decrease in the percentage of water absorption at saturation (%) for the various bar diameters. 332
Effect of Bar Diameter on Mechanical Properties 333
Many studies have revealed that the short-term mechanical properties of FRP bars decrease with 334
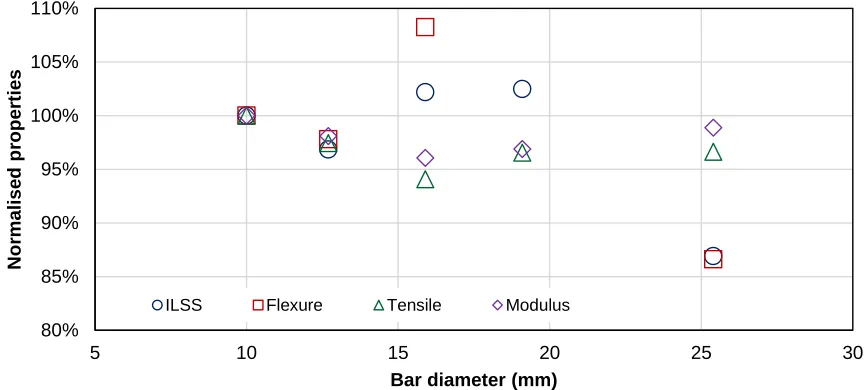
increased bar diameter (Bank 2006; Hollaway 2008). This conclusion, however, was not clearly 335
observed in our study. Figure 7 shows the normalized mechanical properties for the different 336
sizes of GFRP bars. This graph provides the percentage of the interlaminar shear strength (ILSS), 337
flexural strength (Flexure), tensile strength (Tensile), and tensile modulus (Modulus) for all of 338
the bar diameters with respect to the mechanical properties of the #3 bars. The figure show no 339
significant difference in the tensile properties of the GFRP bars regardless of bar diameter. While 340
the highest tensile strength and modulus were observed for the #3 bars, the lowest tensile 341
properties were exhibited by the #5 bars (94% compared to the #3 bars), with the #8 bars 342
exhibiting more than 96% of strength and stiffness of the #3 bars. Kocaoz et al. (2005) suggested 343
16
cross-sectional size but rather by the level of fibers contained in the bar. Since the percentage 345
fiber content by weight (%) (Table 2) for different bar diameters was almost the same, then the 346
bars should record the same elastic modulus. Moreover, the consistency in the measured tensile 347
properties of the GFRP bars with different diameters can be due to an adequate anchor length, 348
which resulted in a more efficient transfer of stresses from the bar surface to the center. Portnov 349
and Bakis (2008) suggested that introducing a more uniform distribution of the applied shear 350
stress near the grips could minimize the shear lag effect and increase the tensile-load-carrying 351
capacity of round pultruded rods. 352
In contrast to the tensile properties, there was a size effect observed for ILSS and flexural 353
strength. The #8 bars recorded ILSS and flexural strength almost 14% lower than the #3 bars. 354
Significant size effects were also observed by Wisnom and Jones (1996) on the average ILSS for 355
unidirectional glass-fiber/epoxy composites. They indicated that the lower ILSS with bigger 356
specimens could be due to the larger inherent defects. Koller et al. (2007) also suggested that the 357
probability of having large defects in composite materials increases with increased specimen 358
volume. Moreover, it should be noted that ILSS is a matrix-dominated property. Wisnom and 359
Jones (1996) suggested that matrix-dominated failures show the largest size effects in composite 360
materials. Defects near the edge of the GFRP bars were very critical for the specimens subjected 361
to the short-beam test as this location is subjected to higher levels of shear stress. Similarly, the 362
lower flexural properties of the larger diameter bars can be explained by the high probability of 363
defects. Carvelli et al. (2009) suggested that it is more difficult to keep the filaments parallel to 364
one another in larger diameter FRP bars during the pultrusion process, increasing their tendency 365
17
during the flexural test, in which the failure was initiated by the compression buckling of the top 367
fibers. 368
Property Retention of GFRP bars with Different Diameters 369
Tannous and Saadatmanesh (1999) indicated that the effect of an alkaline solution on FRP bars 370
only involved a very thin layer on the exposed surface. Thus, the approximate layer thickness 371
and area of the GFRP bars affected by the alkaline solution were calculated and reported in Table 372
5 to correlate with the property retention for different bar diameters. These values were 373
determined by assuming that the affected portions of the GFRP bar were the same as the 374
percentage of water absorption at saturation (%) and equally distributed along the surface of the 375
bars (Table 2). This approach was similar to the method adopted by Cinquin and Medda (2009). 376
It can be clearly seen that the affected thickness is only in the order of 1.9 x 10⁻³ to 5.4 x 10⁻³ 377
mm. Moreover, the percentage of affected thickness with respect to the nominal diameter 378
decreased as did bar diameter. 379
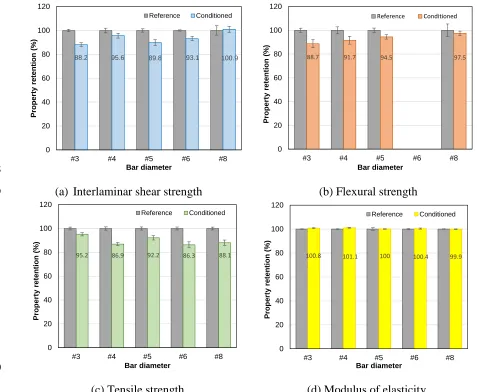
Figure 8 provides the strength and stiffness retention properties of the GFRP bars with 380
different diameters. Figures 8a to 8c clearly indicate that the strength properties were affected by 381
conditioning in the alkaline solution, while Figure 8d shows that the modulus of elasticity was 382
not affected. The almost 100% retention of the modulus of elasticity, which is a fiber-dominated 383
property, for all bar diameters indicates that the damage caused by the moisture diffusion was 384
confined to the very thin layer of the exposed surface and that the reinforcing fibers were not 385
affected by the conditioning. As the modulus of elasticity was determined from the linear-elastic 386
portion of the stress and strain curve, the matrix was still effectively transferring stresses to the 387
fibers. Nkurunziza et al. (2005) indicated that the diffusion of moisture and alkalis in composites 388
18
at lower loads, but higher mechanical loads increase the degradation of the fiber–matrix 390
interface. This accounts for the noticeable decrease in strength properties, as these values were 391
calculated at the point of failure of the GFRP bars at which the stress distribution along the fibers 392
is less uniform. 393
Figures 8a shows that the effect of conditioning on the ILSS of the GFRP bars was significant 394
with the smaller diameter bars, but decreased as the diameter increased. In fact, the residual 395
horizontal shear strength for the #8 bars was the same as that measured on the reference bars, 396
while the #3 bars retained only 88% of their ILSS. This can be explained by the thinner layer 397
affected by the alkaline solution in the case of the larger diameter bars, as reported in Table 5. As 398
indicated in the previous section, ILSS is governed by the fiber–matrix interface. Thus, the 399
decrease in ILSS can be correlated to interface degradation. Similarly, due to the very thin layer 400
affected by conditioning in the alkaline solution in the larger diameter GFRP bars, its affected 401
area was also significantly smaller with respect to the total area, compared to the smaller 402
diameter bars. 403
Figure 8b shows that the flexural-strength retention increased with bar diameter. The retention 404
ranged from 88% retention for the #3 bars to more than 97% for the #8 bars. This behavior was 405
also observed by Maranan et al. (2014), who found that larger diameter bars exhibited a slower 406
rate of strength degradation at high temperature than small diameter bars. Cinquin and Medda 407
(2009) also concluded that the residual mechanical properties were more affected in thin 408
composites than thick composites. The higher flexural strength retention for the larger diameter 409
bars could be due to the strength gradient through bar diameter during bending. During flexural 410
tests, the outermost fibers are subject to the maximum stress. Thus, a smaller amount of fibers 411
19
Moreover, the higher flexural-strength retention in the larger diameter bars can be correlated to 413
the smaller reduction in the second moment of area of the conditioned specimens. Since only the 414
bar surface was damaged, the fibers and matrix in the intact zone were undamaged and had the 415
same initial mechanical properties, resulting in a better redistribution of load when the outer 416
fibers progressively failed. 417
Figure 8c shows a opposite trend than do Figures 8a and 8b, in which the smaller diameter 418
bars exhibited higher tensile-strength retention. This figure shows that the #3 bars retained more 419
than 95% of their tensile strength, while the #8 bars retained only 88%. This trend can be due to 420
the shear lag effect. Achillides and Pilakoutas (2004) indicated that larger diameter FRP bars had 421
more significant shear lag-effect than smaller diameter bars and had a noticeable effect on tensile 422
strength. Castro and Carino (1998) further mentioned that the efficiency of the stress transfer 423
from the bar surface to the interior fibers influences the mechanical properties of the FRP bars. 424
Due to the shear lag effect, the outer fibers experience higher stresses than the inner fibers, even 425
though all fibers resist the tensile load at the same time. Due to conditioning in alkaline solution, 426
the outer surface of the bars was affected and might have decreased mechanical properties. As 427
the specimens were loaded, the outer fibers— which were subjected to higher stress—initiated 428
failure and the breakage moved instantly to the inner fibers, leading to the sudden and 429
catastrophic failure of the GFRP bars. This also explains the reason why the tensile strength is 430
more affected by the conditioning than the interlaminar shear and flexural strength. 431
From the above results, it can be concluded that the conditioning in alkaline solution affected 432
the flexural, ILSS, and tensile strength properties of the GFRP bars, but not their moduli of 433
elasticity. Moreover, the strength-retention limit was affected by bar size. The ILSS and flexural 434
20
contrast to tensile strength: the larger diameter bars had lower tensile strength retention. These 436
results suggest that the conclusions drawn by most studies based on smaller diameter FRP bars 437
do not apply to larger diameters. Based on the results in this study, it is more reasonable to use 438
larger diameter bars in assessing the tensile-strength retention of FRP bars exposed to severe 439
environmental conditions. Nevertheless, note should be taken of the very high load required to 440
cause failure of larger bars. That notwithstanding, the strength retention in all the bar diameters 441
considered in this study is significantly higher than the 0.70 environmental reduction coefficient 442
required by several codes. 443
SEM AND FTIR OBSERVATIONS 444
Scanning-electron-microscopy (SEM) observations were performed to assess the microstructure 445
of the GFRP bars before and after conditioning. All of the specimens observed under SEM were 446
cut, polished, and coated with a thin layer of gold–palladium using a vapor-deposit process. 447
Microstructural observations were performed on a JEOL JSM-840A SEM. Similarly, Fourier 448
Transformed Infrared Spectroscopy (FTIR) was conducted for each bar diameter to study the 449
changes in the chemical composition of the matrix at the bar surface. These observations were 450
conducted to determine the potential degradation of the polymer matrix, glass fibers, or interface, 451
as applicable, due to the penetration of the alkaline solution. The aim was to link these 452
observations to the possible evolution of mechanical properties and chemical composition of the 453
bars after conditioning. 454
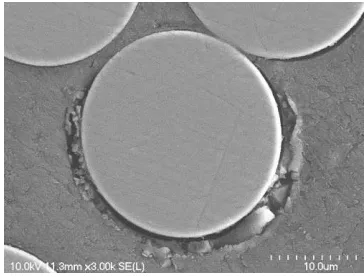
SEM 455
Figures 9 and 10 show the SEM micrographs of the cross section of the reference and 456
conditioned GFRP bars, respectively. As shown in Figures 9a and 9b, there were no pores 457
21
at the fiber–matrix interface, indicating excellent adhesion between the fibers and matrix. This is 459
also true in the center of the conditioned GFRP bars (Figure 10a). Small gaps between the fibers 460
and matrix were observed near the exposed surface in some conditioned specimens (Fig. 10b), 461
suggesting that the bars were affected after exposure to the alkaline solution. This damage to the 462
fiber–matrix interface reduces the transfer of loads between fibers and results in the reduction in 463
strength properties. Benmokrane et al. (2002), however, indicated that the mechanical properties 464
of GFRP bars are controlled by the fiber component. If the fibers have not deteriorated, FRP bars 465
will preserve most of their mechanical strength and will be able to support loads. If the protective 466
resin degrades, the bonding between the matrix and fibers located on the outer part of the bar will 467
gradually reduce and bar resistance will start to decrease. This is the most probable reason why 468
the flexural, ILSS, and tensile strength properties of GFRP bars decreased after alkaline 469
conditioning for 3 months. Nevertheless, the strength reduction is small as the SEM observation 470
confirmed that only the exposed surface of the GFRP bars was affected, not the core section. 471
This exposed surface can be considered as being an "all-resin" surface, which does not contribute 472
much in resisting the applied tensile load. 473
FTIR 474
Figure 11 shows the infrared spectroscopy (FTIR) spectra of the surface of the reference and 475
conditioned GFRP bars. Only the FTIR for the #3 and #8 bars are provided for comparison. The 476
FTIR for both bar diameters shows no clear differences between the infrared spectra of the 477
reference and conditioned GFRP bars. Moreover, the FTIR did not show any significant changes 478
in the chemical structure after exposure to the alkaline solution. These observations indicate that 479
the surface of the bars exposed to the alkaline solution for 3 months at 60oC had not been
480
22
further confirm that the degradation of the matrix remains only at the exposed surface of the 482
GFRP bars. This supports the findings by Nkurunziza et al. (2005) that vinylester epoxies are 483
very resistant to chemical attack, which improves the environmental resistance of FRP bars made 484
with these resins. 485
CONCLUSIONS 486
The effects of diameter on the physical, mechanical, and durability properties of sand-coated 487
GFRP bars made of continuous boron-free glass fibers (EC-R) impregnated in a vinylester-based 488
resin matrix were investigated. Based on the results of this study, the following conclusions 489
were drawn for the tested GFRP bars: 490
With the bar sizes considered, bar diameter did not affect fiber content, transverse coefficient 491
of thermal expansion, porosity, or glass transition temperature. On the other hand, the water 492
absorption was found to decrease as the diameter increased. This can be correlated to the 493
ratio of the surface area to the volume (shape ratio) of the GFRP bars. 494
The tensile strength and modulus of the reference bars were not significantly affected by the 495
cross-sectional size, but a size effect was observed for interlaminar shear strength and 496
flexural strength. The consistency in the measured tensile properties for GFRP bars with 497
different diameters is due to the efficient stress transfer from the bar surface to the center. On 498
the other hand, the higher probability of defects contained in the larger diameter bars may 499
have caused the lower interlaminar shear strength and flexural strength in comparison to the 500
smaller diameter bars. 501
The elastic moduli of the reference and conditioned bars were same for all bar diameters, 502
23
The interlaminar shear strength and flexural strength of the larger diameter GFRP bars were 504
less affected after exposure to the alkaline solution than the smaller bar diameter. The higher 505
interlaminar shear and flexural strength retention for the larger bar sizes was due to the lower 506
affected thickness. As a result, the penetrated area was proportionally small relative to the 507
total cross-sectional area of the bar. 508
The tensile-strength retention was highest for the smallest diameter bar. This suggests that 509
the impact of conditioning on the tensile properties of GFRP bars is expected to be greater 510
for larger than smaller diameters. 511
The scanning-electron-microscope and FTIR observations showed no changes in the material 512
properties and chemical structure in the exposed surface of the bars after conditioning in the 513
alkaline solution for 90 days at 60oC. This shows that the degradation remained at the surface 514
for all the bar diameters. 515
Nevertheless, the variations in the physical and mechanical properties of the GFRP bars 516
investigated in this study, from one diameter to another, remained low. Thus, the suggestions of 517
the current standards and specifications to not relate the strength-retention limit to the size of the 518
FRP bars are acceptable. Further research, however, is needed to investigate other bar types and 519
diameters to clearly determine how the diameter might affect the design of GFRP-reinforced 520
concrete structures. 521
ACKNOWLEDGMENTS 522
The authors would like to acknowledge the support of the Natural Sciences and Engineering 523
Research Council of Canada (NSERC), NSERC Research Chair in Innovative FRP 524
Reinforcement for Concrete Infrastructures, The Fonds Québécois de la Recherche sur la Nature 525
24
materials support. The technical assistance from the staff of the Structural Laboratory in the 527
Department of Civil Engineering, Faculty of Engineering at the University of Sherbrooke, are 528
also acknowledged. The second author also acknowledges the scholarship granted by the 529
Australian Government Endeavour Research Fellowships to undertake his research and 530
professional development at the University of Sherbrooke. 531
REFERENCES 532
Ahmed, E., Benmokrane, B., and Sansfaçon, M. (2016). "Case Study: Design, Construction, and 533
Performance of the La Chancelière Parking Garage’s Concrete Flat Slabs Reinforced with GFRP 534
Bars." ASCE Journal of Composites for Construction, DOI: 10.1061/(ASCE)CC.1943-535
5614.0000656 536
American Concrete Institute (2008). Metric specification for carbon & glass fiber-reinforced 537
polymer bar materials for concrete reinforcement. ACI-440.6M-08, Farmington Hills, Michigan, 538
USA. 539
American Concrete Institute (2012). Guide test methods for fiber-reinforced polymer, ACI 540
440.3R-12, Farmington Hills, Michigan, USA. 541
American Concrete Institute (2015). Guide for the design and construction of concrete reinforced 542
with FRP bars, ACI 440.1R-15, Farmington Hills, Michigan, USA. 543
Arafa, A., Farghaly, A., Ahmed, E., Benmokrane, B. (2016). "Testing of GFRP-RC Panels with 544
UHPRFC Joints of Nipigon River Cable Stayed Bridge in Northwest Ontario, Canada." ASCE
545
Journal of Bridge Engineering, DOI: 10.1061/(ASCE)BE.1943-5592.0000943, p. 05016006-1-546
05016006-14. 547
Archillides, Z. and Pilakoutas, K. (2004). “Bond behaviour of fibre reinforced polymer bars 548
25
ASTM Standard D570 − 98 (2010). Standard test method for water absorption of plastics. ASTM
550
D570 − 98, ASTM International, West Conshohocken, Philadelphia, Pa 19103. 551
ASTM Standard D2374-05 (2011). Standard test method for lead in paint driers by EDTA 552
Method. ASTM D2374-05, ASTM International, West Conshohocken, Philadelphia, Pa 19103. 553
ASTM Standard D3171-15 (2015). Standard test methods for constituent content of composite 554
materials. ASTM D3171−15, ASTM International, West Conshohocken, Philadelphia, Pa 19103. 555
ASTM Standard D4475-02 (2016). Standard test method for apparent horizontal shear strength 556
of pultruded reinforced plastic rods by the short-beam method. ASTM D4475-02, ASTM 557
International, West Conshohocken, Philadelphia, Pa 19103. 558
ASTM Standard D4476/D4476M - 14(2014). Standard test method for flexural properties of 559
fiber reinforced pultruded plastic rods. ASTM D4476/D4476M-14, ASTM International, West 560
Conshohocken, Philadelphia, Pa 19103. 561
ASTM Standard D5117-09 (2009). Standard test method for dye penetration of solid fiberglass 562
reinforced pultruded stock. ASTM D5117 − 09, ASTM International, West Conshohocken, 563
Philadelphia, Pa 19103. 564
ASTM Standard D7205/D7205M-06 (2011). Standard test method for tensile properties of fiber 565
reinforced polymer matrix composite bars. ASTM D7205/D7205M-06, ASTM International, 566
West Conshohocken, Philadelphia, Pa 19103. 567
ASTM Standard D7705/D7705M - 12(2012). Standard test method for alkali resistance of Fiber 568
Reinforced Polymer (FRP) matrix composite bars used in concrete construction. ASTM
569
26
ASTM Standard E1131-08(2014). Standard test method for compositional analysis by 571
thermogravimetry. ASTM E1131-08, ASTM International, West Conshohocken, Philadelphia, Pa 572
19103. 573
ASTM Standard E1356-08(2014). Standard test method for assignment of the glass transition 574
temperatures by differential scanning calorimetry. ASTM E1356-08, ASTM International, West 575
Conshohocken, Philadelphia, Pa 19103. 576
Bakis, C. E. (1993) “FRP Composites: Materials and Manufacturing.” Fiber-Reinforced-Plastic
577
for Concrete Structures: Properties and Applications, A. Nanni, ed., Elsevier, Amsterdam, pp. 578
13-58. 579
Bakis, C. E., Freimanis, A. J., Gremel, D., and Nanni, A. (1998) “Effect of resin material on 580
bond and tensile properties of unconditioned and conditioned FRP reinforcement rods.” 581
Proceedings of the First International Conference on Durability of Composites for Construction, 582
B. Benmokrane and H. Rahman, eds., Sherbrooke, QC, Canada, pp. 525-535. 583
Bank, L.C. (2006). Composites for construction: Structural design with FRP materials, John 584
Wiley and Sons, Inc., New Jersey. 585
Belarbi, A., and Wang, H. (2012) “Durability of FRP bars embedded in fiber-reinforced-586
concrete,” Journal of Composites for Construction, 16(4), pp. 371-380. 587
Benmokrane, B., and Rahman, H., eds. (1998) “Durability of Fiber Reinforced Polymer (FRP) 588
composites for construction,” Proceedings of the First International Conference (CDCC ’98), 589
QC, Canada, 692 pp. 590
Benmokrane, B., Wang, P., Ton-That, T., Rahman, H., and Robert, J.F. (2002). “Durability of 591
glass fibre reinforcing bars in concrete environment.” Journal of Composites for Construction,
592
27
Benmokrane, B., El-Salakawy, E., El-Ragaby, A., and Lackey, T. (2006). “Designing and testing 594
of concrete bridge decks reinforced with glass FRP bars.” Journal of Bridge Engineering, 11(2), 595
217-229. 596
Benmokrane, B., Elgabbas, F., Ahmed, E., and Cousin, P. (2015). “Characterisation and 597
comparative durability study of glass/vinylester, basalt/vinylester, and basalt/epoxy FRP bars.” 598
Journal of Composites for Construction, 19(6):04015008, 1-12. 599
Canadian Standards Association (CSA). (2010). “Specification for fibre-reinforced polymers.” 600
CAN/CSA-S807, Rexdale, Ontario, Canada. 601
Canadian Standards Association (CSA). (2012). “Design and construction of building structures 602
with fibre-reinforced polymers.” CAN/CSA-S806-12, Rexdale, Ontario, Canada. 603
Canadian Standards Association (CSA). (2006-Edition 2014). “Canadian highway bridge design 604
code—Section 16, updated version for public review.” CAN/CSA-S6-14, Rexdale, Ontario, 605
Canada. 606
Carvelli, V., Giulia, F., and Pisani, M.A. (2009) “Anchor system for tension testing of large 607
diameter GFRP bars.” Journal of Composites for Construction, 13(5), 344-349. 608
Castro, P.F. and Carino, N.J. (1998) “Tensile and non-destructive testing of FRP bars.” Journal
609
of Composites for Construction, 2(1), 17-27. 610
Chen, Y., Davalos, J. F., Ray, I., and Kim, H.-Y. (2007) “Accelerated aging tests for evaluations 611
of durability performance of FRP reinforcing bars for concrete structures.” Composite
612
Structures, 78(1), 101-111. 613
Cinquin, J., and Medda, B. (2009) “Influence of laminate thickness on composite durability for 614
long term utilisation at intermediate temperature (100 - 150oC).” Composites Science and
615
28
Drouin, B., Latour, G., and Mohamed, H. (2011) “More than 10 years successful field 617
applications of FRP bars in Canada.” CDCC 2011, The Fourth International Conference on
618
Durability & Sustainability of Fiber Reinforced Polymer(FRP) Composites for Construction
619
and Rehabilitation, Quebec City, QC, Canada, 6 pp. 620
fib, (2007) “FRP Reinforcement in RC Structures” Bulletin No. 40, Federal Institute of
621
Technology, Lausanne, Switzerland. 622
Hollaway, L.C. (2008). “Advanced fibre polymer composite structural systems used in bridge 623
engineering.” ICE Manual of Bridge Engineering, 503-529. 624
Hollaway, L.C. (2010). “A review of the present and future utilisation of FRP composites in the 625
civil infrastructure with reference to their important in-service properties.” Construction and
626
Building Materials, 24, 2419-2445. 627
Kamal, A., and Boulfiza, M., (2011) “Durability of GFRP rebars in simulated concrete solutions 628
under accelerated aging conditions.” Journal of Composites for Construction, 15(4), pp. 473-629
481. 630
Kocaoz, S., Samaranayake, V.A., and Nanni, A. (2005). “Tensile characterization of glass FRP 631
bars.” Composites: Part B, 36, 127-134. 632
Koller, R., Chang, S. and Xi, Y. (2007). “Fiber-reinforced bars under freeze-thaw cycles and 633
different loading rates.” Journal of Composite Materials, 41(1), 5-25. 634
Manalo, A.C., Benmokrane, B., Park, K., and Lutze, D. (2014). “Recent developments on FRP 635
bars as internal reinforcement in concrete structures”. Concrete in Australia, 40(2), 46-56. 636
Maranan, G.B., Manalo, A.C., Karunasena, W., Benmokrane, B., and Lutze, D. (2014). “Flexural 637
29
Proc. 23rd Australasian Conference on the Mechanics of Structures and Materials (ACMSM23), 639
Byron Bay, Australia, 187-192. 640
Micelli, F., and Nanni, A. (2004). “Durability of FRP rods for concrete structures.” Construction
641
and Building Materials, 18, 491-503. 642
Mohamed, H.M., and Benmokrane, B. (2014). "Design and Performance of Reinforced Concrete 643
Water Chlorination Tank Totally Reinforced with GFRP Bars." ASCE Journal of Composites for
644
Construction, Vol. 18, No.1, pp. 05013001-1 – 05013001-11 645
Mohamed, H. M., and Benmokrane, B. (2015). "Make the Case: The Use of FRP Bars for Soft-646
Eyes in Construction of Tunnels." Tunnels and Tunneling, The official publication of the
647
Tunneling Association of Canada, Dec.-Jan., pp. 35-40. 648
Nkurunziza, G., Debaiky, A., Cousin, P., and Benmokrane, B. (2005). “Durability of GFRP bars: 649
A critical review of the literature.” Progress in Structural Engineering and Materials, 7(4), 194– 650
209. 651
Park, C., Jang, C., Lee, S., and Won, J. (2008). “Microstructural investigation of long-term 652
degradation mechanisms in GFRP dowel bars for jointed concrete pavement.” Journal of Applied
653
Polymer Science, 108(5), 3128 -3137. 654
Porter, M. L., Mehus, J., Young, K. A., O’Neil, E. F., and Barnes, B. A. (1997) “Aging for Fiber 655
Reinforcement in Concrete,” Proceedings of the Third International Symposium on Non-Metallic
656
(FRP) Reinforcement for Concrete Structures (FRPRCS-3), V. 2, Japan Concrete Institute, 657
Tokyo, Japan, pp. 59-66. 658
Portnov, G. and Bakis, C.E. (2008). “Analysis of stress concentration during tension of round 659
30
Pultrall (2012). V-ROD FRP reinforcing bars data sheet. Website: 661
http://www.vrodcanada.com/sites/default/files/pdfs-uploaded/V-662
ROD%2060GPa%20Grd%20III%20Std%20-%20Oct%202012.pdf
663
Robert, M., and Benmokrane, B. (2013) “Combined effects of saline solution and moist concrete 664
on long-term durability of GFRP reinforcing bars.” Journal of Construction and Building
665
Materials, 38, pp. 274-284. 666
Robert, M., Cousin, P., and Benmokane, B. (2009). “Durability of GFRP reinforcing bars 667
embedded in moist concrete.” Journal of Composites for Construction, 13(2), 66-73. 668
Tannous, F.E. and Saadatmanesh, H. (1999). “Durability of AR glass fibre reinforced plastic 669
bars.” Composites for Construction, 3(1), 12-19. 670
Wisnom, M.R. and Jones, M.I. (1996). “Size effects in interlaminar tensile and shear strength of 671
unidirectional glass fibre/epoxy.” Journal of Reinforced Plastics and Composites, 15 (1), 2-15. 672
Yi, S. and Hilton, H.H. (1998). “Effects of thermo-mechanical properties of composites on 673
viscosity, temperature and degree of cure in thick thermosetting composite laminates during 674
curing process.” Journal of Composite Materials, 32 (7), 600-622. 675
31 List of Tables:
677
Table 1. Summary of the test methods and number of specimens 678
Table 2. Physical properties of the GFRP bars 679
Table 3. Mechanical properties of the GFRP bars before and after conditioning 680
Table 4. Specimen length for the tensile testing of the GFRP bars 681
Table 5. Estimated affected portion of the GFRP bars 682
683
List of Figures: 684
Figure 1 – Tested GFRP bars specimens 685
Figure 2 - Test setup and instrumentation 686
Figure 3 - Load-deflection and failure behavior of GFRP bars in bending 687
Figure 4 - Load–deflection and failure behavior of the GFRP bars under short-beam shear testing 688
Figure 5 - Stress–strain and failure behavior of the GFRP bars in tension 689
Figure 6 - Relationship of water absorption to the shape ratio and bar diameter 690
Figure 7 - Normalized mechanical properties of the GFRP bars 691
Figure 8 - Property retention of GFRP bars with different diameters 692
Figure 9 - SEM micrographs of the reference GFRP bars 693
Figure 10 - SEM micrographs of the conditioned GFRP bars 694
Figure 11. FTIR spectrum of the GFRP bars before and after conditioning. 695
32
Table 1. Summary of the test methods and number of specimens 697
Properties Test Method No. of
Specimens Reference
Conditioned
Physical properties
Cross-sectional area (mm2) CSA-S806, Annex A (2012)
9
√ --
Fiber content by weight (%) ASTM D3171-15 (2015)
9
√ --
Transverse CTE, (x10-6/oC) ASTM E1131-08 (2014)
9 √ --
Void content (%) ASTM D5117-09 (2009)
9 √ --
Water absorption at 24 hours (%)
ASTM D570-98 (2010)
15 √ --
Water absorption at saturation (%)
ASTM D570-98 (2010)
15 √ --
Cure ratio (%) ASTM E 1356-08 (2014)
15 √ --
Tg (°C) ASTM E
1356-08 (2014)
15 √ --
Mechanical properties
Flexure ASTM
D4476/D4476M-14 (20D4476/D4476M-14)
6 √ √
Interlaminar shear ASTM D4475-02 (2016)
6 √ √
Tensile ASTM
D7205/D7205M-06 (2011)
6 √ √
33 Table 2. Physical properties of the GFRP bars 700
Property Bar designation
#3 #4 #5 #6 #8
Nominal diameter (mm) 9.5 12.7 15.9 19.1 25.4 Nominal cross-sectional area (mm2) 70.8 126.6 198.5 286.5 506.7 Actual cross-sectional area by
immersion test (mm2) 83.8 (1.9)
145.0 (1.7)
224.4 (1.2)
317.3 (1.9)
555.7 (5.2) Fiber content by weight (%) 80.9 (0.2) 81.8 (0.1) 82.6 (0.1) 82.7 (0.2) 83.0 (0.2) Transverse CTE, (x10-6/oC) 20.7 (2.3) 20.5 (1.6) 21.5 (1.4) 22.0 (1.8) 21.3 (2.5)
Void content (%) 0 (0) 0 (0) 0 (0) 0 (0) 0 (0) Water absorption at 24 hours (%) 0.15
(0.01)
0.12 (0.02)
0.10 (0.01)
0.02 (0.00)
0.02 (0.00) Water absorption at saturation (%) 0.19
(0.01)
0.15 (0.05)
0.14 (0.01)
0.04 (0.01)
0.04 (0.00) Cure ratio (%) 100 (0) 100 (0) 100 (0) 100 (0) 100 (0)
Tg (°C)
125.8 (1.3)
112.8 (2.5)
109.6 (1.5)
105.2 (1.3)
124.8 (4.9) 701
34
Table 3. Mechanical properties of the GFRP bars before and after conditioning 703
Property Bar Designation
#3 #4 #5 #6 #8
Reference
Flexural strength, fu (MPa)
1623.7 (58.2)
1588.1 (93.5)
1757.5 (66.5)
-- 1406.3 (151.3) Interlaminar shear strength, Su
(MPa) 54.7 (1.1)
52.9 (2.1) 55.8 (1.5) 56.0 (0.1) 47.5 (3.7)
Tensile strength, ft (MPa)
1315.3 (31.1)
1281.5 (35.3)
1237.4 (33.3)
1270.0 (31.4)
1271.0 (29.9) Tensile modulus, E (GPa) 62.5 (0.4) 61.3 (0.4) 60.0 (1.3) 60.5 (0.5) 61.8 (0.3) Tensile strain, e 2.3 (0.1) 2.1 (0.1) 2.1 (0.1) 2.1 (0.1) 2.1 (0.1)
Conditioned
Flexural strength, fu (MPa)
1440.3 (97.3)
1455.6 (96.4)
1660.0 (62.3)
-- 1370.9 (49.9) Interlaminar shear strength, Su
(MPa) 48.2 (1.5)
50.6 (2.1) 50.2 (2.4) 52.1 (1.8) 47.9 (2.4)
Tensile strength, ft (MPa)
1251.8 (34.6)
1114.0 (29.4)
1141.1 (41.5)
1095.9 (55.4)
1119.2 (50.0) Tensile modulus, E (GPa) 63.0 (0.4) 61.9 (0.4) 60.1 (0.2) 60.8 (0.6) 61.7 (0.3) Tensile strain, e 2.2 (0.1) 1.8 (0.1) 1.9 (0.1) 1.8 (0.1) 1.8 (0.1) 704
35
Table 4. Specimen length for the tensile testing of the GFRP bars 706
Bar Size Gauge Length (mm)
Anchor Length (mm)
Specimen Length (mm)
#3 465 400 1265
#4 583 510 1603
#5 713 630 1973
#6 848 740 2328
#8 1166 990 3146
[image:35.612.75.523.287.368.2]707
Table 5. Estimated affected portion of the GFRP bars 708
Affected Portion #3 #4 #5 #6 #8
Area (x 10-3 mm2) 138.2 186.2 270.0 111.7 223.0
Thickness (x 10-3 mm) 4.4 4.7 5.4 1.9 2.8 % of the nominal diameter 0.05 0.04 0.03 0.01 0.01 709
36 711
[image:36.612.157.455.77.202.2]712 713 714 715
Figure 1 – Tested GFRP bars specimens 716
717 718 719 720 721 722
723
[image:36.612.64.528.269.445.2](a) Flexure (b) Short-beam shear (c) Tensile 724
Figure 2 - Test setup and instrumentation 725
37
0 2 4 6 8 10 12 14 16 18 20
0 10 20 30 40
L
o
ad
(
kN)
Deflection (mm)
#3 Reference #3 Conditioned #4 Reference #4 Conditioned #5 Reference #5 Conditioned #8 Reference #8 Conditioned
737
[image:37.612.76.527.79.337.2](a) Load and deflection behavior (c) Failure of #8 bars 738
Figure 3 - Load-deflection and failure behavior of GFRP bars in bending 739
740
0 5 10 15 20 25 30 35 40
0 1 2 3 4 5
L
o
ad (
kN)
Deflection (mm)
#3 Reference #3 Conditioned #4 Reference #4 Conditioned #5 Reference #5 Conditioned #6 Reference #6 Conditioned #8 Reference #8 Conditioned
741
[image:37.612.56.525.94.686.2](a) Load and deflection behavior (c) Failure of #8 bars 742
Figure 4 - Load–deflection and failure behavior of the GFRP bars under short-beam shear testing 743
(b) Failure of #3 bars
38
(c) Failure of #8 bars
0 200 400 600 800 1000 1200 1400 1600 1800 2000 2200 2400 2600
0 0.5 1 1.5 2 2.5
S tr es s (M P a) Strain (%)
#3 Reference #3 Conditioned #4 Reference #4 Conditioned #5 Reference #5 Conditioned #6 Reference #6 Conditioned #8 Reference #8 Conditioned
744 745 746 747 748 749 750 751 752 753
[image:38.612.32.556.49.690.2](a) Stress and strain behavior 754
Figure 5 - Stress–strain and failure behavior of the GFRP bars in tension 755
756
y = 0.603x - 0.079 R² = 0.8793 y = 0.6753x - 0.0679
R² = 0.8693
0 0.05 0.1 0.15 0.2 0.25
0.1 0.2 0.3 0.4 0.5
W ater abso rp tion ( % ) Shape ratio 24 hrs Saturation
y = -0.0151x + 0.518 R² = 0.9199
y = -0.0157x + 0.3564 R² = 0.9003
0 0.1 0.2 0.3 0.4 0.5
8 13 18 23 28
Bar diameter
Shape ratio
Water absorption (%)
757
(a) Water absorption and shape ratio (b) Shape ratio and water absorption with bar diameter 758
Figure 6 - Relationship of water absorption to the shape ratio and bar diameter 759
760 761
[image:38.612.53.550.84.331.2]39 762
763 764
80% 85% 90% 95% 100% 105% 110%
5 10 15 20 25 30
No
rmalise
d
p
ro
p
er
ties
Bar diameter (mm)
ILSS Flexure Tensile Modulus
[image:39.612.88.520.161.356.2]765
Figure 7 - Normalized mechanical properties of the GFRP bars 766