1
Laboratory Assessment and Durability Performance of Vinyl-Ester, Polyester, and Epoxy 1
Glass-FRP Bars for Concrete Structures 2
Brahim Benmokrane,1 Ahmed H. Ali,2 Hamdy M. Mohamed,3 3
Adel ElSafty,4 and Allan Manalo5 4
1Corresponding author. Professor of Civil Engineering and Tier-1 Canada Research Chair in 5
Advanced Composite Materials for Civil Structures and NSERC Chair in FRP Reinforcement for 6
Concrete Structures, Department of Civil Engineering, University of Sherbrooke, Quebec, 7
Canada, J1K 2R1, Tel.: 1-819-821-7758. 8
2PhD candidate 10
Department of Civil Engineering 11
University of Sherbrooke, Quebec, Canada 12
3Postdoctoral fellow 14
Department of Civil Engineering 15
University of Sherbrooke, Quebec, Canada 16
4Professor 18
Civil Engineering, College of Computing, Engineering, and Construction, UNF, Jacksonville, 19
FL, USA 20
2
5Senior Lecturer, Centre for Future Materials, Faculty of Health, Engineering and Sciences, 22
University of Southern Queensland, Toowoomba, Queensland 4350, Australia. 23
Abstract 25
In the last decade, noncorrosive glass fiber-reinforced-polymer (GFRP) bars have become more 26
widely accepted as cost-effective alternatives to steel bars in many applications for concrete 27
structures (bridges, parking garages, and water tanks). Also, these reinforcing bars are valuable 28
for temporary concrete structures such as soft-eyes in tunneling works. The cost of the GFRP 29
bars can be optimized considering the type of resin according the application. Yet limited 30
research seems to have investigated the durability of GFRP bars manufactured with different 31
types of resin. In this study, the physical and mechanical properties of GFRP bars made with 32
vinyl-ester, isophthalic polyester, or epoxy resins were evaluated first. The long-term 33
performance of these bars under alkaline exposure simulating a concrete environment was then 34
assessed in accordance with ASTM D7705. The alkaline exposure consisted in immersing the 35
bars in an alkaline solution for 1000, 3000 and 5,000 h at elevated temperature (60oC) to 36
accelerate the effects. Subsequently, the bar properties were assessed and compared with the 37
values obtained on unconditioned reference specimens. The test results reveal that the vinyl-ester 38
and epoxy GFRP bars had the best physical and mechanical properties and lowest degradation 39
rate after conditioning in alkaline solution, while the polyester GFRP bars evidenced the lowest 40
physical and mechanical properties and exhibited significant degradation of physical and 41
mechanical properties after conditioning. 42
3
Keywords: Glass fiber; vinyl ester, polyester, epoxy; fiber-reinforced polymer (FRP); glass FRP 44
(GFRP) rebars; physical and mechanical properties; durability performance; alkaline; accelerated 45
aging; microstructural, concrete structures. 46
Introduction 47
Fiber-reinforced-polymer (FRP) bars have been well accepted as internal and external 48
reinforcement for concrete structures (ACI 440.1R [ACI 2015]; Benmokrane et al. 2016a; Ali et 49
al. 2016a; Mohamed et al. 2016). This reinforcing material offers better resistance to 50
environmental agents as well as high stiffness-to-weight and strength-to-weight ratios when 51
compared with conventional construction materials such as steel. Extensive research and 52
development efforts have demonstrated that FRP bars are effective reinforcement in concrete 53
members subject to bending (Maranan et al. 2015), shear (Ali et al. 2013 and 2016b), 54
compression (Maranan et al. 2016), and impact (Goldston et al. 2016). Material specifications 55
and design guidelines (ACI 440.6M [ACI 2008]; CAN/CSA S807 [CSA 2010]) have also been 56
developed to encourage the construction industry to use FRP bars. This has resulted in many 57
demonstration projects and field applications, such as bridges (Benmokrane et al. 2004), parking 58
garages (Benmokrane et al. 2012), water-treatment plants (Mohamed and Benmokrane 2014), 59
bridge barriers (El-Salakawy et al. 2005), concrete pavement (Benmokrane et al. 2008), and 60
jetties (Manalo et al. 2014). 61
Different types of fibers are used in manufacturing FRP bars such as carbon, glass, 62
aramid, and basalt. Many studies have been carried out on the performance and use of FRP bars 63
made with these different fibers, providing good insight into their physical and mechanical 64
properties as well as their durability characteristics (Kocaoz et al. 2005; Banibayat and Patnaik 65
4
Alsayed et al. 2012; Al-Salloum et al. 2013; Hassan et al. 2016; Tanks et al. 2016). Glass is the 67
most commonly used fiber type in manufacturing FRP bars due to their relatively low 68
comparative cost (ACI 2015). Similarly, Castro et al. (1998) highlighted the importance of the 69
resin system used in manufacturing FRP bars to achieve the desired mechanical properties and 70
durability characteristics. The resin system is important as it acts as a matrix bonding the fibers 71
together and spreading the load applied to the composite between each of the individual fibers. 72
The resin system also protects the fibers from abrasion and impact damage as well as from 73
severe environmental conditions—such as water, salts, and alkalis—which affect the durability 74
of FRP products (SP System 1998). A deterioration of this interface reduces the transfer of the 75
loads between fibers and thus weakens the composite materials (Almusallam et al. 2013). The 76
interface between the fiber and matrix is a nonhomogeneous region about 1 µm thick. This layer 77
is weakly bonded and most vulnerable to deterioration. The three dominant deterioration 78
mechanisms include matrix osmotic cracking, interfacial debonding, and delamination (Chen et 79
al., 2007). Moisture diffusion into FRP composites could be influenced by the material’s 80
anisotropic and heterogeneous character. Along with diffusion into the matrix, wicking through 81
the fiber/matrix interface in the fiber direction could be a predominant mechanism of moisture 82
ingress (Apicella et al., 1982). Nonvisible dissociation between fibers and matrix could lead to 83
rapid losses of interfacial shear strength (Ferrier et al. 2016; Ashbee and Wyatt, 1969). 84
Unfortunately, limited research attention has been paid to the effect of the resin-system type on 85
the physical and mechanical properties as well as the durability characteristics of GFRP bars. 86
Most of the glass-fiber-reinforced polymer (GFRP) bars available are manufactured with 87
E or ECR glass fibers that are normally wetted with a thermosetting resin such as epoxy or 88
5
determine the effect of environmental conditions (water, salts, alkalis) on their physical and 90
mechanical properties (Mouritz et al. 2004; Wang 2005; Zou et al. 2008; Robert et al. 2009; 91
Robert and Benmokrane 2013; Benmokrane et al. 2014, 2015, 2016b, 2016c). Similarly, Soles et 92
al. (1998); Amaro et al. 2013; Ali et al. 2015; and Benmokrane et al. (2016a) are some of the 93
numerous researchers who have investigated the durability performance of FRP bars made with 94
epoxy resins. GFRP bars made with these resin systems are the most commonly used as 95
reinforcement for concrete structures given their high performance and very good durability 96
characteristics. Studies into the behavior of fiber-reinforced isophthalic polyester-resin 97
composites have primarily addressed industrial and nonstructural products such as natural-fiber 98
composites (Manalo et al. 2015). GFRP bars manufactured with isophthalic polyester resin are 99
normally used for temporary structures such as soft-eyes in underground excavations and 100
tunneling works (Schurch and Jost 2006). In these proprietary applications, GFRP-bar durability 101
is not a concern. The key advantage of GFRP bars is the low cost of polyester resin and the fact 102
that GFRP bars can be cut without damaging the drilling equipment’s cutter heads. Comparisons 103
performed by some researchers [Ashbee et al, 1967; Ashbee and Wyatt, 1969; Abeysinghe et al., 104
1982] have indicated that the matrix formed by vinyl ester, which contains many fewer ester 105
units compared to polyester, experiences very little deterioration caused by hydroxyl ions 106
compared to a polyester matrix. As a result, CSA S807 (2010) classifies isophthalic polyester-107
based GFRP bars as having moderate durability (D2), while classifying epoxy- and vinyl-ester-108
based GFRP bars as having high durability (D1). Obviously, these classifications were 109
established based on the results obtained by different researchers on GFRP bars manufactured 110
with a specific resin system, i.e., either vinyl esters or epoxies (with very few studies on 111
6
approach is needed to confirm that GFRP bars manufactured with different types of resin will 113
have different physical and mechanical properties as well as different durability characteristics, 114
therefore providing for direct comparison of these important properties. 115
This paper presents an experimental investigation aimed at assessing and comparing the 116
physical and mechanical properties of three different types of GFRP bars made with vinyl-ester, 117
isophthalic polyester, or epoxy resins. The tests findings on the long-term durability of these bars 118
conditioned in an alkaline solution simulating a moist concrete environment at high temperature 119
are also presented. The aim is to further understanding of the various resin options available for 120
GFRP bars and their associated behavioral characteristics, yielding useful information about 121
materials specifications and design standards. 122
Experimental-Program Outline 123
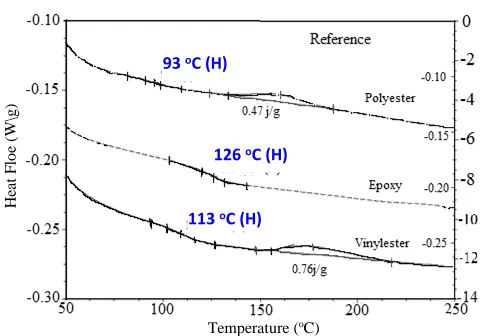
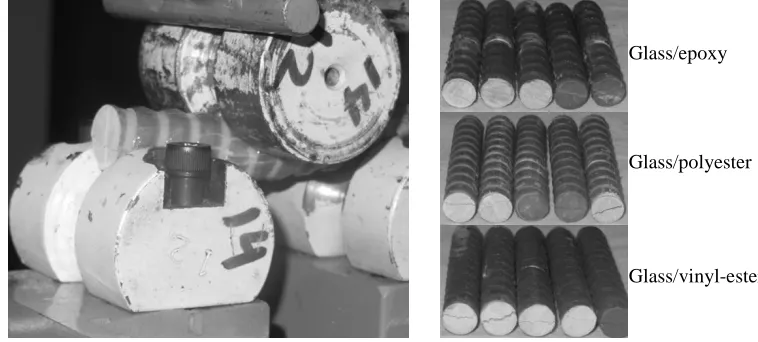
This experimental investigation was conducted on three different GFRP bars that were 12 mm in 124
diameter: glass/polyester, glass/vinyl-ester, and glass/epoxy as shown in Figure 1. The 125
experimental work was divided into three phases. Phase I included the determination of physical 126
properties, which were compared to those obtained after conditioning. Phase II included 127
mechanical characterization, including transverse shear strength, flexural strength, flexural 128
modulus of elasticity (stiffness), and apparent horizontal shear strength (interlaminar-shear 129
strength). The test results also served as references for residual strength after conditioning. Phase 130
III included a preliminary durability assessment and long-term performance assessment of the 131
GFRP bars immersed in alkaline solutions simulating concrete pore solution at 60°C for different 132
times up to 5,000 h. The changes in the physical and mechanical characteristics were assessed by 133
comparing the characteristics of the conditioned bars to those of the reference bars from Phases I 134
7
composition of the materials were also assessed with differential scanning calorimetry (DSC) 136
and Fourier transform infrared spectroscopy (FTIR), respectively. In addition, bar microstructure 137
was investigated using scanning electron microscopy (SEM) for both conditioned and 138
unconditioned bars to assess changes and/or degradation. 139
Material Properties and Test Specimens 140
The glass/polyester, glass/vinyl-ester, and glass/epoxy FRP bars were manufactured with 141
continuous glass fibers impregnated in polyester, vinyl-ester, or epoxy resins using the pultrusion 142
process. Table 1 lists the typical properties of these thermosetting-resin systems as reported by 143
Bank (2006). The three types of GFRP bars (Figure1) were manufactured by Firep International 144
AG (Switzerland) using the same fabrication process and equipment, same glass fiber, and same 145
additives to ensure bar consistency. The GFRP bars had a nominal diameter of 12 mm and were 146
deformed with helical wrapping (Fig. 1). The nominal cross-sectional area of the three GFRP 147
bars was 113 mm2, as reported by the manufacturer. The mechanical properties reported herein 148
were calculated using the nominal cross-sectional area. 149
For this study, the GFRP bars were provided in 170 and 240 mm lengths so that the transverse 150
shear-strength test and flexural test could be performed according to ASTM D7617 (ASTM 151
2011), and ASTM D4476 (ASTM 2009), respectively. In addition, some specimens were cut into 152
83 mm lengths so that the short-beam shear test could be performed according to ASTM D4475 153
(ASTM 2008) on the three types of GFRP bars. 154
Testing, Results, and Discussion 155
8
Physical properties for the reference (unconditioned) GFRP bars were determined according to 157
ACI (2008) and CSA (2010) requirements, including: (1) fiber content, (2) moisture absorption, 158
(3) cure ratio, and (4) glass transition temperature. 159
Fiber content 160
Glass fiber content was determined by thermogravimetry according to ASTM E1131. A very 161
small piece of material (a few tenths milligrams) was cut from the center of the bar, placed in 162
platinum crucible and then heated up to 550°C under inert atmosphere. The weight loss (WL) has 163
been recorded at a temperature equal to 550°C. Since the material only contains carbon fibers 164
and resin, fiber content by weight was then calculated according to the following equation: 165
Fiber content by weight = 100(WT – WL)/WT (1)
166
where, WT is the total weight before burn off. 167
Water-immersion test 168
The moisture uptake at saturation of the GFRP bars was determined according to ASTM D570, 169
except that the immersion was in tap water instead of distilled water. Three 50 mm long 170
specimens were cut, dried, and weighed prior to immersion in water at 50°C for three weeks. The 171
samples were removed from the water after three weeks, surface dried, and weighed. 172
The water content at saturation in weight percent (Ws) was calculated using Equation 2 173
Ws = 100 · (Ps – Pd)/Pd (2)
174
where Ps and Pd are the sample weights in the saturated and dry states, respectively. 175
Cure ratio 176
Cure ratio was determined according to ASTM D5028 and CSA (2010). The enthalpy of 177
polymerization of the sample was measured by DSC and compared to the enthalpy of 178
9
Thirty to fifty milligrams of sample were accurately weighed and placed in an aluminum 180
crucible. The samples were then heated from room temperature to 200°C at a heating rate of 181
20°C/min, and the area of the peak of polymerization was calculated. The measurement was 182
carried out on 3 specimens. 183
Transverse coefficient of thermal expansion 184
The transverse coefficient of thermal expansion was calculated according to ASTM E1131-08 185
(2014). Nine specimens of each type of GFRP bars were tested. The measurements were 186
conducted between -30°C and 60°C at a heating rate of 3°C. A TA Q400 thermomechanical 187
analyzer was used. Cryogenic equipment (liquid nitrogen) was used to reach subzero 188
temperatures. The results show that the coefficients of thermal expansion for the different bar 189
diameters fell between 20.5 × 10⁻⁶/°C and 22.0 × 10⁻⁶/°C, which is only half of the limit of 190
40.0 × 10⁻⁶/°C specified in CSA 807 (2010). 191
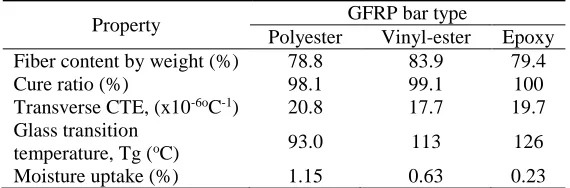
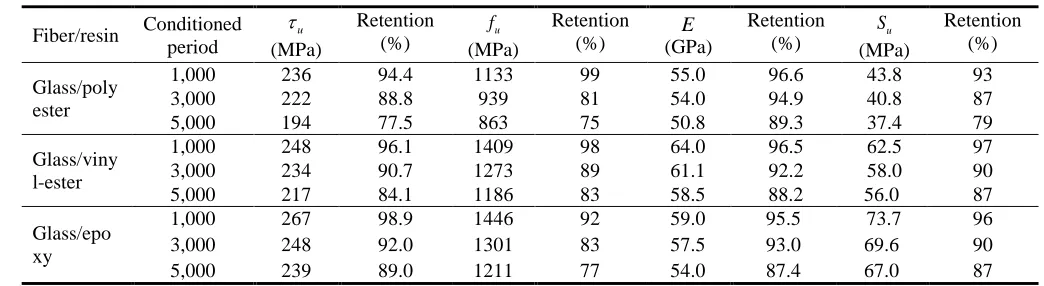
Table 2 lists the physical properties of the unconditioned GFRP bars, where the glass transition 192
temperature (Tg) was determined with differential scanning calorimetry (DSC) [ASTM D3418 193
(ASTM 2012b)] (see Fig. 2). 194
As shown in Table 1, the glass/polyester and glass/epoxy FRP bars had approximately the same 195
fiber content (78.8% and 79.4% by weight, respectively), while the glass/vinyl-ester FRP had the 196
highest fiber–content ratio (83.9% by weight). The average cure ratios and transverse 197
coefficients of thermal expansion of the tested bars were around 99.0±1.0 and 198
19.25±1.55×10⁻⁶°C−1, respectively, without significant differences between the three types of 199
bars tested. On the other hand, significant differences were observed for Tg and moisture uptake. 200
The vinyl-ester and polyester GFRP bars returned Tg values of 113°C and 93.0°C, respectively, 201
10
GFRP bars had water uptake ratios of 0.63% and 1.15%, respectively, while the epoxy GFRP 203
bars had a moisture–uptake ratio of 0.23%. The limits of water absorption of the bars at 204
saturation were <1% and <0.75% for high and medium durability, respectively, as recommended 205
in CSA S807 (2010). The measured water absorption of the polyester GFRP bars was slightly 206
higher than these limits, probably due to the resin-rich deformation pattern on the bar surface, 207
which absorbed most of the moisture. 208
Phase II: Mechanical Characterization 209
The mechanical characterization included testing of representative GFRP bars to determine their 210
transverse shear strength in accordance with ASTM D7617 (ASTM 2011); interlaminar shear 211
(short-beam test) in accordance with ASTM D4475 (ASTM 2008); and flexural strength and 212
flexural modulus of elasticity in accordance with ASTM D4476 (ASTM 2009). These tests were 213
selected as they are primarily related to resin properties and can provide a comparative 214
performance assessment of the three GFRP bars tested herein. Figures 3–5 show the mechanical 215
characterization tests and Table 3 lists the results. The following sections provide brief 216
descriptions and interpretation of the results. 217
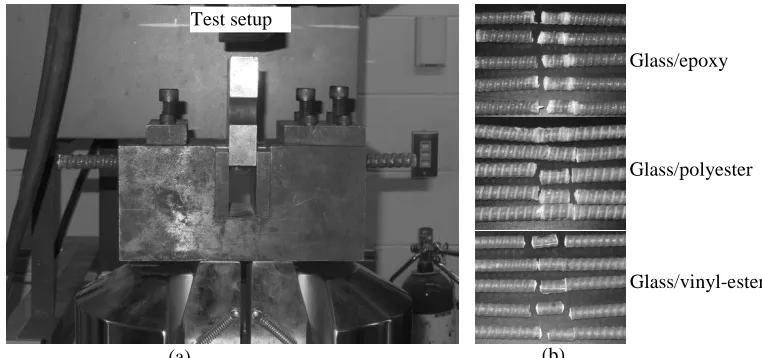
Transverse–Shear Strength Test 218
Transverse shear is the major structural force on dowels in jointed pavements or on stirrups in 219
concrete beams. Transverse-shear tests were conducted according to ASTM D7617 (ASTM 220
2011) to characterize the tested bars. The setup consisted of a 230 × 100 × 110 mm steel base 221
equipped with lower blades spaced at 50 mm face to face, allowing for the double transverse-222
shear failure of the specimen caused by an upper blade, as shown in Fig. 3. For each type of bar 223
tested, six unconditioned specimens measuring 170 mm in length were tested under laboratory 224
11
machine equipped with a 500 kN load cell. A displacement-controlled rate of 1.3 mm/min was 226
used during the test, which yielded between 30 and 60 MPa/min until specimen failure. The 227
loading was done without subjecting the test specimens to any shock. The transverse-shear 228
strength was calculated with Eq. (1) 229
2
s u
P A
(1) 230
where u = transverse-shear strength (MPa); Ps = failure load (N); and A = bar cross-sectional 231
area (mm2). 232
Table 3 shows that the transverse-shear strengths of the polyester and vinyl-ester GFRP bars 233
were 250±33 and 258±32 MPa, respectively. The epoxy GFRP bars had the highest value of 234
transverse-shear strength (270±45 MPa). It is worth mentioning, however, that, although the 235
resin delivers most of the transverse-shear strength, the fiber and the fiber/resin interface also 236
play a role (Montaigu et al. 2013). The ratios between the shear strengths of the polyester and 237
vinyl-ester GFRP bars and that of epoxy bars were 93% and 96%, respectively. The results 238
indicate that the epoxy resin yielded higher transverse-shear strength than the polyester and 239
vinyl-ester resin, although the standard deviation was high. Moreover, these values meet CSA 240
requirements (2010), which specify a minimum transverse-shear strength of 160 MPa for GFRP 241
bars. 242
Three-Point Flexural Test 243
Flexural testing is especially useful for quality control and specification purposes. Flexural 244
properties may vary with specimen diameter, temperature, weather conditions, and differences in 245
rates of straining. The flexural properties obtained with this test method—ASTM D4476 (ASTM 246
2009)—cannot be used for design purposes but are appropriate for the comparative testing of 247
12
supported span equal to 20 times the bar diameter, as shown in Fig. 4. Six unconditioned 249
specimens were tested under laboratory conditions as references for each type on an MTS 810 250
testing machine equipped with a 500 kN load cell. The specimens were loaded at mid-span with 251
a circular nose; the specimen ends rested on two circular supports that allowed the specimens to 252
bend. A displacement-controlled rate of 3.0 mm/min was used during the test. The rate of 253
loading was done without subjecting the test specimen to any shock. The applied load and 254
deflection were recorded during the test on a data-acquisition system monitored by a computer. 255
The flexural strength of tested FRP specimens was calculated with Eq. (2). The flexural modulus 256
of elasticity (stiffness) is the ratio, within the elastic limit, of stress to corresponding strain. It 257
was calculated with Eq. (3) 258
fu PLC/ (4 )I
(2) 259
3
/ (48 )
EPL IY
(3) 260
where fu= flexural strength in the outer fibers at mid-span (N/mm2); P = failure load (N); L= 261
clear span (mm); I = moment of inertia (mm4); C= distance from the centroid to the extremities 262
(mm); E= flexural modulus of elasticity in bending (N/mm2); and Y= mid-span deflection at 263
load P (mm). 264
The maximum outer fiber strain (u) was calculated from Eq. (4) 265
u fu /E
(4) 266
Table 3 provides the three-point flexural strength, flexural modulus of elasticity, and ultimate 267
outer-fiber strain of the tested GFRP bars. The elastic behavior of all the specimens was 268
maintained until flexural failure, at which point the specimens failed due to compression in the 269
top fibers, as shown in Fig. 4. The polyester GFRP bars showed the lowest flexural strength 270
13
ester GFRP bars recorded a flexural strength of 1432±75 MPa. The vinyl-ester and epoxy GFRP 272
bars, however, evidenced no significant differences in flexural modulus of elasticity (66.3 and 273
61.8 GPa, respectively). Lastly, the flexural modulus of elasticity of the polyester resin was 274
lower than that of the vinyl-ester and epoxy resin (86% and 92% of the vinyl-ester and epoxy 275
GFRP bars, respectively). The lower flexural strength and modulus of the polyester GFRP bars is 276
expected since the polyester had the lowest mechanical properties of the thermosetting resins 277
considered (Table 1). Castro and Carino (1998) pointed out that the resin system significantly 278
affected the mechanical properties of FRP bars due to the efficiency of the stress transfer among 279
the fibers. 280
Short-Beam Shear Test 281
In FRP bars manufactured with a pultrusion process in which the fibers are arranged 282
unidirectionally and bonded with the polymer matrix, the horizontal stresses would be more 283
conducive to inducing interface degradation than transverse-shear stresses (Park et al. 2008). The 284
short-beam shear test was conducted according to ASTM D4475 (ASTM 2008) on six specimens 285
of each type of GFRP bar in order to calculate the interlaminar-shear strength, which is governed 286
by the fiber–matrix interface. The tests were carried out with a 500 kN MTS 810 testing 287
machine. The distance between the shear planes was set to 7 times the nominal diameter of the 288
FRP bars. Figure 5 shows the test setup and typical modes of failure of the tested specimens. A 289
displacement-controlled rate of 1.3 mm/min was employed during the test. The applied load was 290
recorded with a computer-monitored data-acquisition system. 291
14
2 0.849 / u
S P d
(5) 293
where Su= interlaminar-shear strength (MPa); P = shear failure load (N); and d = bar diameter 294
(mm). 295
The short-beam shear test revealed that the epoxy GFRP bars had the highest interlaminar-shear 296
strength (77.4±2.7 MPa), followed by the vinyl-ester GFRP bars (64.8±4.5 MPa) and the 297
polyester GFRP bars (47.2±0.4 MPa). The results confirm that the interface between the glass 298
fibers and polyester resin was not as strong as that within the vinyl-ester and epoxy GFRP bars. 299
Table 3 shows the apparent horizontal shear strength of the tested GFRP bars. It is worth 300
mentioning that the high values of the interlaminar-shear strength reveal a strong interface 301
between the resins and reinforcing fibers, which will be clarified in the SEM analysis to follow. 302
Phase III: Durability Study in Alkaline Solution 303
Conditioning of the GFRP Bars in Alkaline Solution 304
Accelerated aging tests were conducted in accordance with ASTM D7705 (ASTM 2012a). The 305
conditioning of the bars included the combined exposure to a harsh alkaline environment and 306
elevated temperature. Immersion in an aqueous media (alkaline solution) at high temperature 307
accelerates degradation. The alkaline solution was prepared with calcium hydroxide, potassium 308
hydroxide, and sodium hydroxide (118.5 g of Ca(OH)2 + 0.9 g of NaOH + 4.2 g of KOH in 1 L 309
of deionized water) according to ASTM D7705 and CSA S806 (CSA 2012) . The pH of the 310
alkali solution was 12.8. The three types of FRP bars—glass/polyester, glass/vinyl-ester, and 311
glass/epoxy—were immersed in this solution at 60°C for up to 5,000 h. The timing of 312
conditioning started once the solution had reached the prescribed temperature. Robert et al. 313
(2009) reported that the degradation reaction rate increased almost linearly between room 314
15
Therefore, to avoid any thermal degradation, the maximum conditioning temperature used in this 316
study was 60°C, as specified in ASTM D7705 (ASTM 2012a). 317
The GFRP specimens were placed in hermetically sealed stainless-steel containers to prevent 318
excessive evaporation and the reaction of atmospheric CO2 with calcium hydroxide. The 319
containers were placed in an environmental chamber adjusted to the prescribed temperature 320
(60°C) under isothermal conditions. The bars were weighed and their diameters measured 321
throughout the conditioning period to monitor water absorption and eventually characterize the 322
mass and diameter changes. Observation revealed no changes in diameter during conditioning. 323
Six specimens of each type of FRP bar were removed from the solution and tested to determine 324
their transverse-shear strength, interlaminar-shear strength, flexural properties, and physical 325
properties after 1,000, 3,000, and 5,000 h at 60°C. Durability was assessed using tests for 326
transverse-shear strength [ASTM D7617 (ASTM2011)], interlaminate shear (short-beam test) 327
[ASTM D4475 (ASTM 2008)], flexural strength, and flexural modulus of elasticity 328
[ASTMD4476 (ASTM 2009)]. Degradation mechanisms in FRP bars are typically denoted as 329
(1) fiber dominated; (2) matrix dominated; and (3) fiber–matrix interface dominated or combined 330
mechanisms. Changes in mechanical properties determined by these tests are indicators of the 331
three specific modes of degradation of the FRP constituent materials given earlier: fibers 332
(flexural tests), resin (transverse and short-beam shear tests), and interface region (short-beam 333
shear and flexural tests). The results for the conditioned specimens were compared to those of 334
the reference ones. 335
Transverse-Shear Strength of the Conditioned GFRP Bars 336
Table 4 shows the transverse-shear strength and strength-retention ratios of the tested bars after 337
16
the polyester GFRP bars were highly affected by accelerated aging with a transverse-shear 339
strength reduction of 22.5% after 5,000 h of immersion, while the vinyl-ester and epoxy bars had 340
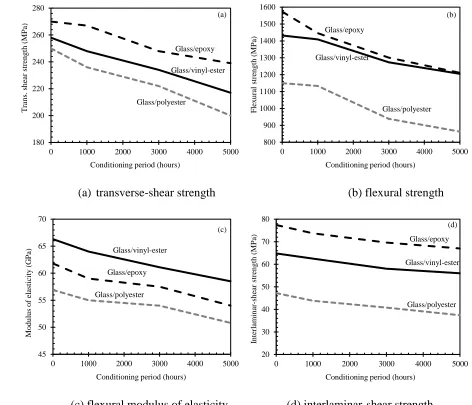
transverse-shear strength reductions of 15.9% and 11%, respectively. Figure 6(a) shows the 341
effect of the alkaline solution on the transverse shear strength after different exposure times. 342
Contrary to the polyester bars, the vinyl-ester and epoxy GFRP bars exhibited no significant 343
reductions in the early stages (less than 3,000 h). 344
Flexural Strength of the Conditioned FRP Bars 345
Table 4 provides the flexural strength and strength-retention ratios of the tested FRP bars after 346
1,000, 3,000, and 5,000 h of immersion. Both the polyester and epoxy GFRP bars had similar 347
flexural-strength reductions after 5,000 h (25 and 23%, respectively), while the vinyl-ester GFRP 348
bars showed a lower reduction of 17%. These observations confirm that the bond between the 349
GFRP fibers and polyester resin—before and after conditioning—was lower than that between 350
the glass fibers in the vinyl-ester or epoxy resin. Consequently, debonding occurring at the fiber– 351
matrix interface caused the fibers to separate from the resin. Figure 6(b) shows the effect of the 352
alkaline solution on flexural strength. The lowest reduction rate was observed with the vinyl-353
ester GFRP bars, which yielded the lowest degradation at the interface. The high degradation of 354
the epoxy GFRP bars after 1,000 h of conditioning resulted from the ingress of the alkaline 355
solution through the initial voids. The polyester GFRP bars, however, returned an almost steady 356
degradation rate between 1,000 and 5,000 h. 357
Flexural Modulus of Elasticity of the Conditioned GFRP Bars 358
Table 4 gives the flexural modulus of elasticity and the retention ratio of the tested FRP bars 359
after 1,000, 3,000, and 5,000 h of immersion. The three bar types had no significant differences 360
17
comparison to the references. Figure 6(c) illustrates the effect of the alkaline solution on the 362
flexural modulus of elasticity, with all types of bar specimens exhibiting a steady reduction rate. 363
Interlaminar-shear strength of the Conditioned GFRP Bars 364
Table 4 also shows the apparent horizontal shear (interlaminar shear) strength and strength-365
retention ratios of the tested FRP bars after 1,000, 3,000, and 5,000 h of immersion. As for 366
flexural testing, the vinyl-ester and epoxy GFRP bars offered excellent stability and durability 367
after immersion in the alkaline solution, followed by the polyester GFRP bars. The reduction 368
ratios for the vinyl-ester, epoxy, and polyester GFRP bars after 5,000 h were 13%, 13%, and 369
21%, respectively. Again, this observation confirms the strong fiber–resin interface in the vinyl-370
ester GFRP bars, followed by the epoxy and polyester GFRP bars. As evidenced from these 371
results, the fiber–resin interface stands out as one of the most important issues in manufacturing 372
glass FRP. Figure 6(d) shows the effect of the alkaline solution on the interlaminar-shear 373
strength, with the vinyl-ester GFRP bars exhibiting the lowest rate of degradation. Interestingly, 374
the 21% reduction in the interlaminar-shear strength of the polyester GFRP bars in this study is 375
significantly lower than with the polyester E-glass composite rods tested by Micelli and Nanni 376
(2004), who observed a more than 90% reduction in interlaminar-shear strength. This indicates 377
that the development of new material systems and advanced manufacturing methods now yield 378
high-quality FRP bar products. 379
Microstructural Analysis of the Reference and Conditioned GFRP Bars 380
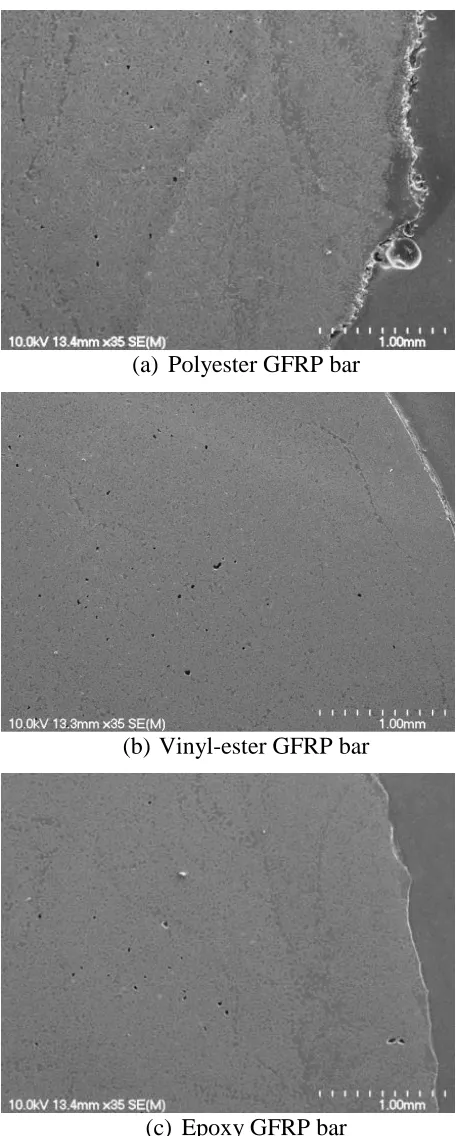
SEM observations were performed to investigate microstructural changes in the GFRP bars 381
before and after conditioning. The specimens were cut, polished, and coated with a thin layer of 382
gold/palladium in a vapor-deposit process. The analysis was carried out on a JEOL JSM-840 A 383
18
section of the reference GFRP bars, while Figs. 8 to 10 provide the SEM micrographs of the 385
5,000 h conditioned specimens. 386
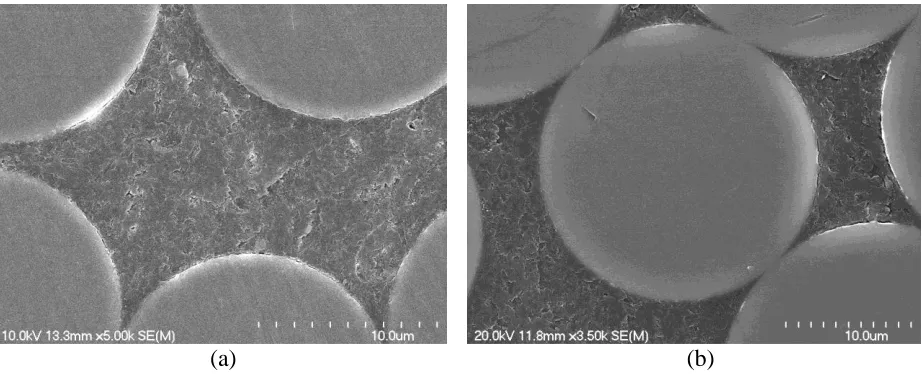
SEM analysis of the reference and conditioned specimens (Figs. 7 to 10) indicates that the GFRP 387
bars made with vinyl-ester and epoxy evidenced no significant changes, but presented a slight 388
debonding at the interface between the fibers and vinyl-ester resin. Consequently, the vinyl-ester 389
GFRP bars evidenced higher moisture uptake measured at saturation compared to the epoxy 390
GFRP bars. On the other hand, the GFRP bars containing the polyester resin evidenced 391
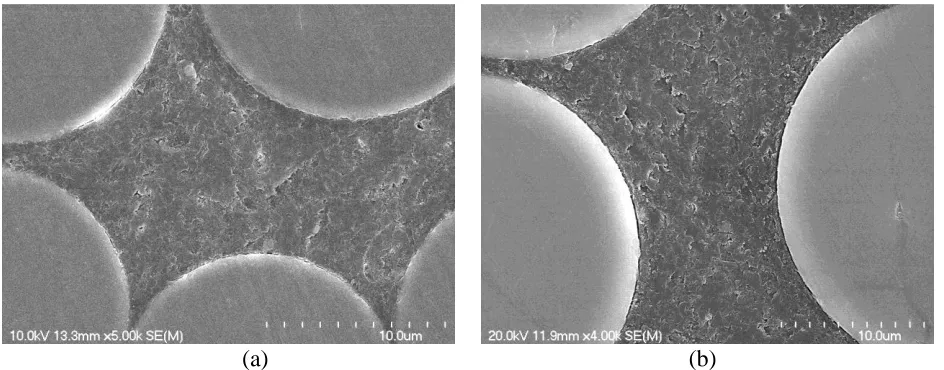
significant impact on the coating with the 5000 h conditioning. Moreover, these bars experienced 392
greater debonding at the fiber–resin interface than did the vinyl-ester and epoxy GFRP bars. 393
Accordingly, the polyester GFRP bars had higher moisture uptake measured at saturation and 394
higher degradation rate of mechanical properties after conditioning. 395
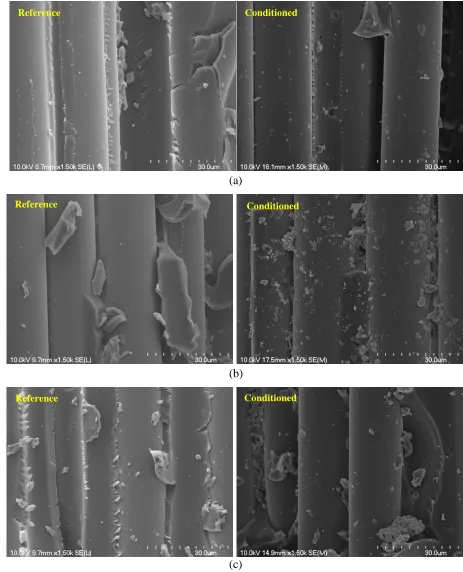
SEM was also performed on the fracture zones of the 1,000 h specimens after short-beam testing 396
(Fig. 11) to investigate the mechanisms of failure at the interface fiber–matrix. The fiber surface 397
of the vinyl-ester and epoxy GFRP bars had more resin coverage (Fig. 11 [b and c]) than the 398
polyester GFRP bars (Fig. 11[a]). This observation corroborates the reduction ratio of the 399
interlaminar-shear strength and flexural strength after conditioning in the alkaline solution and 400
characterizes the higher bonding of the glass fiber to the vinyl-ester and epoxy resins than the 401
polyester resin. 402
Glass Transition Temperature and Cure Ratio of the Conditioned GFRP Bars 403
Differential scanning calorimetry (DSC) is used to obtain information about the thermal behavior 404
and characteristics of polymeric materials and composites, such as the glass transition 405
temperature (Tg) and curing process. In this study, 30–50 mg specimens from both unconditioned 406
19
Castle, Delaware) DSC Q10 calorimeter to 200°C at a rate of 20°C/min. The glass transition 408
temperature (Tg) was determined in accordance with ASTM D3418 (ASTM 2012b). 409
Table 5 presents the Tg values for the reference and specimens conditioned for 5,000 h. The Tg of 410
the conditioned polyester GFRP bars were slightly higher than that of the reference specimens, 411
as a result of post-curing at high temperature. The vinyl-ester and epoxy GFRP bars were almost 412
fully cured (99.1% and 100%, respectively); their Tg values were lower than that of the reference 413
specimens by 11.5% and 10.3%, respectively. Epoxy resin is known to lower Tg when water is 414
absorbed (plasticizing effect). The water absorption of the epoxy GFRP bars was 0.2%. 415
Chemical Changes in the Conditioned GFRP Bars 416
Fourier transform infrared spectroscopy (FTIR) was used to identify any chemical 417
change/degradation after 5,000 h of conditioning at 60oC. FTIR spectra of the surface and core of 418
the material specimens were recorded using a Jasco 4600 spectrometer equipped with an 419
attenuated total-reflectance device. Five hundred and twelve scans were routinely acquired at a 420
resolution of 4 cm−1. Chemical degradation in the alkaline solution is mainly due to a hydrolysis 421
reaction, which forms new hydroxyl (-OH) groups from sensitive units, such as ester groups. 422
Hydroxyl groups appeared as a broad peak between 3200 and 3650 cm−1, which corresponds to 423
the stretching mode of the hydroxyl groups in the polyester, vinyl-ester, and epoxy resins. 424
Figure 12 shows the FTIR spectra of the unconditioned and conditioned polyester, vinyl-ester, 425
and epoxy GFRP specimens conditioned in the alkaline solution for 5,000 h at 60°C. For each 426
specimen—reference and conditioned—spectra of the surface and core of the specimen were 427
recorded and the areas of the O–H and C–H peaks calculated as presented in Fig. 13. Table 6 428
presents the ratio of the (OH–) peak to the resin’s carbon–hydrogen (C–H) stretching peak. The 429
20
specimens evidenced any significant changes, which equates to no increase in the amount of 431
hydroxyl groups in the resins. This observation shows that the vinyl-ester and epoxy resins used 432
did not degrade chemically while the specimens were immersed at 60oC for 5,000 h. On the other 433
hand, the polyester resin showed significant differences on the surface and in the core of the 434
tested specimens (see Table 6). The experimental O–H/C–H for the core and surface of the vinyl-435
ester and epoxy GFRP bars immersed for 5,000 h were 1.5, 1.8, 1.2, and 1.5, respectively, 436
compared to 1.80, 2.40, 1.25, and 1.6 for the unconditioned specimens, while the experimental 437
ratios for the core and surface of the polyester GFRP bars immersed for 5,000 h at 60oC were 3.5 438
and 14.30, respectively. These results led to the conclusion that chemical degradation of the 439
polymer occurred on the surface of the polyester bars, which was in direct contact with the 440
solution during immersion. This observation explains the losses in mechanical properties of the 441
polyester GFRP bars. 442
Moisture Uptake at Saturation of the Conditioned GFRP Bars 443
The moisture uptake at saturation of the reference and conditioned FRP bars was determined 444
according to ASTM D570 (ASTM 2010). The gain in mass was corrected to account for 445
specimen mass loss due to possible dissolution phenomena. This correction was achieved by 446
completely drying the immersed specimens in an oven at 100°C for 24 h and comparing their 447
masses to their initial masses. The mass loss may have occurred due to several causes: 448
dissolution of soluble chemicals present on the surface; sand debonding in the case of sand-449
coated bars; and chemical degradation of one of the components, such as resin hydrolysis. In this 450
study, the moisture-uptake ratios at saturation for the reference specimens were 1.15%, 0.63%, 451
and 0.23% for the polyester, vinyl-ester, and epoxy GFRP, respectively, while these ratios for the 452
21
GFRP bars, respectively. The epoxy GFRP bars had the lowest water uptake, which is consistent 454
with the lowest degradation of the fiber–resin interface as determined by DSC analysis and SEM 455
observations. 456
Summary and Conclusions 457
This study investigated glass-fiber-reinforced polymers (GFRPs) with polyester, vinyl-ester, and 458
epoxy resins. Based on the results, the following conclusions concerning the glass FRP bars 459
made with polyester, vinyl-ester and epoxy resins tested herein can be drawn: 460
1. The epoxy and vinyl-ester GFRP bars exhibited higher fiber–resin bond; flexural strength; 461
flexural modulus of elasticity; and interlaminar-shear strength, which is governed by the fiber– 462
matrix interface. In addition, they showed lower moisture uptake. 463
2. Both the polyester and epoxy GFRP bars had similar flexural-strength reductions after 5,000 h 464
of immersion (25% and 23%, respectively), while the vinyl-ester GFRP bars returned a lower 465
reduction of 17%. These observations confirm that the bond between the GFRP fibers and 466
polyester resin—before and after conditioning—was lower than that between the glass fibers and 467
the vinyl-ester or epoxy resin. 468
3. The unconditioned polyester GFRP bars exhibited lower transverse-shear strength, flexural 469
strength, interlaminar-shear strength, and the weakest fiber–resin interface. The transverse-shear 470
strength of the polyester GFRP bars was significantly affected by accelerated aging (22.5% 471
reduction after 5,000 h), while the epoxy and vinyl-ester GFRP bars were slightly affected by 472
accelerated aging (11% and 15.9 % reductions, respectively, after 5,000 h). 473
4. The flexural strength of the polyester GFRP bars was significantly affected by accelerated 474
aging (25% reduction after 5,000 h), while the vinyl-ester and epoxy GFRP bars were affected 475
22
5. The interlaminar-shear strength of the polyester GFRP bars was highly affected by accelerated 477
aging (21% reduction after 5,000 h), while the vinyl-ester and epoxy GFRP bars were slightly 478
affected by accelerated aging (13% reduction each after 5,000 h). The fiber–resin interface plays 479
a significant role in controlling the degradation due to conditioning. 480
6. The microstructural observations revealed that GFRP bars made with vinyl-ester or epoxy 481
resin were not significantly changed, but presented a slight debonding at the interface between 482
the fibers and vinyl-ester resin. Consequently, the vinyl-ester GFRP bars evidenced higher 483
moisture uptake measured at saturation compared to the epoxy GFRP bars. 484
7. The debonding at the interface between the fibers and polyester resin was higher than in the 485
vinyl-ester and epoxy GFRP bars. Accordingly, the polyester GFRP bars evidenced higher 486
moisture uptake measured at saturation and a higher degradation rate of mechanical properties 487
after conditioning. 488
8. The polyester GFRP bars showed an increase in Tg of about 5°C after conditioning due to 489
post-curing (cure ratio of the reference specimens was 98.1%). The vinyl-ester and epoxy GFRP 490
bars, however, experienced a decrease in Tg after conditioning. 491
9. The polyester GFRP bars absorbed 18% more water than the vinyl-ester and epoxy GFRP bars 492
after conditioning compared to the reference specimen. 493
23
Acknowledgments 495
The authors wish to acknowledge the financial support of the Natural Sciences and Engineering 496
Research Council of Canada (NSERC), the NSERC Research Chair in Innovative FRP 497
Reinforcement for Concrete Structures, the Fonds de la recherche du Quebec en nature et 498
technologies (FRQ-NT), the Florida Department of Transportation, and the University of North 499
Florida. The authors would like to thank Firep International AG (Switzerland) for donating the 500
GFRP materials and the technical staff of the structural & materials lab in the Department of 501
Civil Engineering at the University of Sherbrooke. 502
References 503
Abbasi, A., and Hogg, P. J. (2005). “Temperature and Environmental Effects on Glass Fiber 504
Rebar: Modulus, Strength and Interfacial Bond Strength with Concrete.” Composites Part B:
505
Engineering, 36(5), 394-404. 506
Abeysinghe, H., Edwards, W., Pritchard, G., and Swampillai, G., J. (1982). “Degradation of 507
crosslinked resins in water and electrolyte solutions.” Polymer, 23(12), 1785–1790. 508
ACI (American Concrete Institute). (2008). “Specification for carbon and glass fiber-reinforced 509
polymer bar materials for concrete reinforcement.” ACI 440.6M-08, Farmington Hills, MI. 510
ACI (American Concrete Institute). (2015). “Guide for the design and construction of structural 511
concrete reinforced with FRP bars.” ACI 440.1R-15, Farmington Hills, MI. 512
Ali, A. H., Mohamed, H. M., and Benmokrane, B. (2013). “Shear resistance of circular concrete 513
members reinforced with FRP bars: Code predictions and numerical analysis.” Proc., CSCE
514
24
Ali, A. H., Mohamed, H. M., and Benmokrane, B. (2016a). “Shear behavior of circular concrete 516
members reinforced with GFRP bars and spirals at shear span-to-depth ratios between 1.5 and 517
3.0.” J. Compos. Constr., 10.1061/(ASCE)CC.1943-5614.0000707, 04016055. 518
Ali, A. H., Mohamed, H. M., and Benmokrane, B. (2016b). “Strength and Behavior of Circular 519
FRP-Reinforced Concrete Sections without Web Reinforcement in Shear.” J. Struct.
520
Eng., 10.1061/(ASCE)ST.1943-541X.0001684 , 04016196. 521
Ali, A. H., Mohamed, H. M., ElSafty, A., and Benmokrane, B. (2015). “Long-term durability 522
testing of Tokyo rope carbon cables.” 20th International Conference on Composite Materials, 523
(ICCM20), Copenhagen, Denmark, 19-24th July, 2015. 524
Almusallam, T. H., Al-Salloum, Y.A., Alsayed, S., H., El-Gamal, S., and Aqel, M. (2013). 525
“Tensile properties of glass fiber-reinforced polymer bars embedded in concrete under severe 526
laboratory and field environmental conditions.” J. Compos. Mater., 47(4), 393-407. 527
Al-Salloum, Y., El-Gamal, S., Almusallam, T., Alsayed, S., and Aqel, M. (2013). “Effect of 528
harsh environmental conditions on the tensile properties of GFRP bars.” Composites Part B:
529
Engineering, 45(1), 835–844. 530
Alsayed, S., Al-Salloum, Y., Almusallam, T., El-Gamal, S., and Aqel, M. (2012). 531
“Performance of glass fiber reinforced polymer bars under elevated temperatures.” Composites
532
Part B : Engineering, 43, 2265-2271. 533
Amaro, A.M., Reis, P.N.B., Neto, M.A., and Louro, C. (2013). “Effects of Alkaline and Acid 534
Solutions on Glass/Epoxy Composites.” Polymer Degradation and Stability, 98(4), 853-862.
535
25
Apicella A., Migliaresi C., Nicodemo L., Nicolais L., Iaccarino L., and Roccotelli S. (1982). 537
“Water sorption and mechanical properties of a glass-reinforced polyester resin.” Composites,
538
13(4), 406–410. 539
Ashbee, K., and Wyatt, R. (1969). “Water damage in glass fibre/resin composites.” Proc. Roy.
540
Soc. Lond, Ser. A, 312(1511), 553–564. 541
Ashbee, K., Frank F., and Wyatt, R. (1967). “Water damage in polyester resins.” Proc. Roy. Soc. 542
Lond, Ser. A, 300(1463), 415–419. 543
ASTM. (2008). “Standard test method for apparent horizontal shear strength of pultruded 544
reinforced plastic rods by the short beam method.” ASTM D4475, West Conshohocken, PA. 545
ASTM. (2009). “Standard test method for flexural properties of fiber reinforced pultruded plastic 546
rods.” ASTM D4476, West Conshohocken, PA. 547
ASTM. (2010). “Water absorption of plastics.” ASTM D570, West Conshohocken, PA. 548
ASTM. (2011). “Standard test method for transverse shear strength of fiber-reinforced polymer 549
matrix composite bars.” ASTM D7617, West Conshohocken, PA. 550
ASTM. (2012a). “Standard test method for alkali resistance of fiber reinforced polymer (FRP) 551
matrix composite bars used in concrete construction.” ASTM D7705, West Conshohocken, PA. 552
ASTM. (2012b). “Standard test method for transition temperatures and enthalpies of fusion and 553
crystallization of polymers by differential scanning calorimetry.” ASTM D3418, West 554
Conshohocken, PA. 555
Banibayat, P., and Patnaik, A. (2014). “Variability of mechanical properties of basalt fiber 556
reinforced polymer bars manufactured by wet lay-up method.” Materials and Design, 56, 898– 557
26
Bank, L. C. (2006). “Composites for Construction: Structural Design with FRP Materials.” 559
Wiley, Hoboken, DOI: 10.1002/9780470121429. 560
Benmokrane, B. Ali, A. H., Mohamed, H. M. and Safty, A. (2014). “Long-Term Tensile 561
Properties of Carbon FRP Cable.” 15th International European Bridge Conference, London, UK 562
8-10th, July 2014. 563
Benmokrane, B., Ahmed, E., Dulude, C., and Boucher, E. (2012). “Design, construction, and 564
monitoring of the first worldwide two-way flat slab parking garage reinforced with GFRP bars.” 565
Proc., 6th Int. Conf. on FRP Composites in Civil Engineering, International Institute for FRP in 566
Construction, Kingston, ON, Canada 567
Benmokrane, B., Eisa, M., El-Gamal, S., Thébeau, D., and El-Salakawy, E. (2008). “Pavement 568
system suiting local conditions: Québec studies continuously reinforced concrete pavement with 569
glass fiber-reinforced polymer bars.” J. Am. Concr. Inst., 30(11), 34–39. 570
Benmokrane, B., El-Salakawy, E., Desgagné, G., and Lackey, T. (2004). “FRP bars for bridges.” 571
Concr. Int., 26(8), 84–90. 572
Benmokrane, B., Ali, A. H., Mohamed, H.M., Robert, M., and ElSafty, A. (2016a). “Durability 573
Performance and Service Life of CFCC Tendons Exposed to Elevated Temperature and Alkaline 574
Environment.” J. Compos. Constr., 10.1061/(ASCE)CC.1943-5614.0000606, 04015043. 575
Benmokrane, B., Mohamed, H., Manalo, A., and Cousin, P. (2016c). “Evaluation of Physical and 576
Durability Characteristics of New Headed Glass Fiber–Reinforced Polymer Bars for Concrete 577
Structures.” J. Compos. Constr., 10.1061/(ASCE)CC.1943-5614.0000738, 04016081. 578
Benmokrane, B., Elgabbas, F., Ahmed, E., and Cousin, P. (2015). “Characterization and 579
Comparative Durability Study of Glass/Vinylester, Basalt/Vinylester, and Basalt/Epoxy FRP 580
27
Benmokrane, B., Robert, M., Mohamed, H., Ali, A. H., and Cousin, P. (2016b). “Durability 582
Assessment of Glass FRP Solid and Hollow Bars (Rock Bolts) for Application in Ground 583
Control of Jurong Rock Caverns in Singapore.” J. Compos. Constr., 10.1061/(ASCE)CC.1943-584
5614.0000775, 06016002. 585
Canadian Standards Association (CSA). (2010). “Specification for fibre reinforced polymers.” 586
CAN/CSA S807-10, Rexdale, Ontario, Canada.
587
Canadian Standards Association (CSA). (2012). “Design and construction of building 588
components with fibre-reinforced polymers.” CAN/CSA S806-12, Rexdale, Ontario, Canada. 589
Castro, P.F. and Carino, N.J. (1998) “Tensile and non-destructive testing of FRP bars.” J.
590
Compos. Constr., 2(1), 17-27. 591
Chen, Y., Davalos, J.F., Ray, I. and Kim, H.Y. (2007). “Accelerated Aging Tests for Evaluation 592
of Durability Performance of FRP Reinforcing Bars Reinforcing Bars for Concrete Structures.” 593
Composite Structures, 78(1), 101-111.
594
El-Salakawy, E.F., Benmokrane, B. and Brière, F. (2005). “Glass FRP composite bars for 595
concrete bridge barriers.” Journal of Science and Eng. of Composite Materials, 12(3), 167-192. 596
Ferrier, E., Rabinovitch, O., and Michel, L. (2016). “Mechanical behavior of concrete 597
resin/adhesive–FRP structural assemblies under low and high temperatures.” Construction and
598
Building Materials, 127, 1017-1028.
599
Goldston, M., Remennikov, A., and Neaz Sheikh, M. (2016). “Experimental investigation of the 600
behavior of concrete beams reinforced with GFRP bars under static and impact loading.” 601
28
Hassan, M., Benmokrane, B., ElSafty, A., and Fam, A. (2016) “Bond durability of basalt-fiber-603
reinforced-polymer (BFRP) bars embedded in concrete in aggressive environments.” Composites
604
Part B : Engineering, 106, 262-272. 605
Kocaoz, S., Samaranayake, V.A., and Nanni, A. (2005). “Tensile characterization of glass FRP 606
bars.” Composites: Part B : Engineering, 36, 127-134. 607
Li, G., Wu, J., and Ge, W. (2015). “Effect of loading rate and chemical corrosion on the 608
mechanical properties of large diameter glass/basalt-glass FRP bars.” Construction and Building
609
Materials, 93, 1059-1066. 610
Manalo, A.C., Benmokrane, B., Park, K., and Lutze, D. (2014). “Recent developments on FRP 611
bars as internal reinforcement in concrete structures.” Concrete in Australia, 40(2), 46-56. 612
Manalo, A.C., Wani, E., Zukarnain, N.A., Karunasena, K., and Lau, K.T. (2015). “Effects of 613
alkali treatment and elevated temperature on the mechanical properties of bamboo fibre– 614
polyester composites.” Composites Part B: Engineering, 80, 73–83. 615
Maranan, G., Manalo, A. C., Benmokrane, B. and Karunasena, W. and Mendis, P. (2015). 616
“Evaluation of the flexural strength and serviceability of geopolymer concrete beams reinforced 617
with glass-fibre-reinforced polymer (GFRP) bars.” Engineering Structures, 101, 529-541. 618
Maranan, G.B., Manalo, A.C., Benmokrane, B., Karunasena, W., and Mendis, P. (2016). 619
“Behavior of concentrically loaded geopolymer-concrete columns reinforced longitudinally and 620
transversely with GFRP bars.” Engineering Structures, 117, 422–436. 621
Micelli, F., and Nanni, A. (2004). “Durability of FRP rods for concrete structures.” Construction
622
29
Mohamed, H. M., and Benmokrane, B. (2014). “Design and performance of reinforced concrete 624
water chlorination tank totally reinforced with GFRP bars: Case study.” J. Compos. Constr.,
625
10.1061/(ASCE)CC.1943-5614.0000429, 05013001-1–05013001-11. 626
Mohamed, H. M., Ali, A. H., and Benmokrane, B. (2016). “Behavior of Circular Concrete 627
Members Reinforced with Carbon-FRP Bars and Spirals under Shear.” J. Compos.
628
Constr., 10.1061/(ASCE)CC.1943-5614.0000746 , 04016090.
629
Montaigu, M., Robert, M., Ahmed, E., and Benmokrane, B. (2013). “Laboratory characterization 630
and evaluation of durability performance of new polyester and vinyl-ester e-glass GFRP dowels 631
for jointed concrete pavement.” J. Compos. Constr., 10.1061/(ASCE)CC.1943-5614.0000317, 632
176–187. 633
Mouritz, A. P., Kootsookos, A., and Mathys, G. (2004). “Stability of polyester- and vinyl-ester-634
based composites in seawater.” J. Mater. Sci., 39(19), 6073–6077. 635
Park, C., Jang, C., Lee, S., and Won, J. (2008). “Microstructural investigation of long-term 636
degradation mechanisms in GFRP dowel bars for jointed concrete pavement.” J. Appl. Polym. 637
Sci., 108(5), 3128–3137. 638
Robert, M., and Benmokrane, B., (2013). “Combined effects of saline solution and moist 639
concrete on long-term durability of GFRP reinforcing bars.” Construction and Building
640
Materials, 38: 274-284.
641
Robert, M., Cousin, P., and Benmokrane, B. (2009). “Durability of GFRP reinforcing bars 642
embedded in moist concrete.” J. Compos. Constr., 10.1061/(ASCE)1090-0268(2009)13:2(66), 643
30
Schurch, M., and Jost, P. (2006). “GFRP soft-eye for TBM Breakthrough: Possibilities with a 645
modern construction material.” Proc. International Symposium on Underground Excavation and
646
Tunnelling, Bangkok, Thailand, 397-404. 647
Soles C. L., Chang, F. T., Bolan, B. A., Hristov, H. A., Gidley, D. W., and Yee, A. F. (1998). 648
“Contributions of the nanovoid structure to the moisture absorption properties of epoxy resins.” J
649
Polym. Sci. Part B: Poly. Phys., 36(17), 3035–3048. 650
SP System. (1998). “Structural polymer system—Composite engineering material.” Clause 651
“Guide to Resin Systems for Composites, GTRS-1- 1098”, Newport, Isle of Wight, U.K., 1–15. 652
Tanks, J. D., Harris, D. K., and Sharp, S. R. (2016) “Mechanical response of unidirectional 653
composite bars loaded in transverse compression.” Composites Part B : Engineering, Vol. 97,
654
18-25. 655
Wang, P. (2005). “Effect of moisture, temperature, and alkaline on durability of E-glass/vinyl-656
ester reinforcing bars.” Ph.D. thesis, Univ. of Sherbrooke, Sherbrooke, Canada. 657
Zou, C., Fothergill, J. C., and Rowe, S. W. (2008). “The effect of water absorption on the 658
dielectric properties of epoxy nanocomposites.” IEEE Trans. Dielectr. Electr. Insul., 15(1), 106– 659
117. 660
31
[image:31.612.129.485.320.394.2]List of Tables 662
[image:31.612.164.449.438.532.2]Table 1. Typical properties of the thermosetting resins (Bank, 2006) 663
[image:31.612.150.467.579.656.2]Table 2. Physical properties of the reference GFRP bars 664
Table 3. Mechanical properties of the reference GFRP bars 665
Table 4. Retention of mechanical properties of the conditioned GFRP bars 666
Table 5. Cure ratio,Tg, and moisture uptake of the reference and conditioned GFRP bars 667
Table 6. Ratio of the FTIR peaks 668
669
Table 1. Typical properties of the thermosetting resins (Bank, 2006) 670
Property Resin system
Polyester Vinyl-ester Epoxy
Glass transition temperature (Tg), oC 100 110 120
Tensile modulus, GPa 4.0 3.5 3.0
Tensile strength, MPa 65 82 90
Elongation at break, % 2.5 6.0 8.0
671
Table 2. Physical properties of the reference GFRP bars 672
Property GFRP bar type
Polyester Vinyl-ester Epoxy
Fiber content by weight (%) 78.8 83.9 79.4
Cure ratio (%) 98.1 99.1 100
Transverse CTE, (x10-6oC-1) 20.8 17.7 19.7 Glass transition
temperature, Tg (oC) 93.0 113 126
Moisture uptake (%) 1.15 0.63 0.23
673
Table 3. Mechanical properties of the reference GFRP bars 674
Bar type u
(MPa) fu
(MPa) E(GPa) u(%) u
S (MPa) Glass/polyester 250±33 1150±59 56.9±2.4 2.02±0.16 47.2±0.4
Glass/vinyl-ester
258±32 1432±75 66.3±2.2 2.16±0.089 64.8±4.5
Glass/epoxy 270±45 1573±135 61.8±1.5 2.54±0.015 77.4±2.7
675
32
Table 4. Retention of mechanical properties of the conditioned GFRP bars 677
Fiber/resin Conditioned period
u
(MPa)
Retention
(%) u
f
(MPa)
Retention
(%) (GPa) E
Retention
(%) u
S
(MPa)
Retention (%)
Glass/poly ester
1,000 236 94.4 1133 99 55.0 96.6 43.8 93
3,000 222 88.8 939 81 54.0 94.9 40.8 87
5,000 194 77.5 863 75 50.8 89.3 37.4 79
Glass/viny l-ester
1,000 248 96.1 1409 98 64.0 96.5 62.5 97
3,000 234 90.7 1273 89 61.1 92.2 58.0 90
5,000 217 84.1 1186 83 58.5 88.2 56.0 87
Glass/epo xy
1,000 267 98.9 1446 92 59.0 95.5 73.7 96
3,000 248 92.0 1301 83 57.5 93.0 69.6 90
5,000 239 89.0 1211 77 54.0 87.4 67.0 87
[image:32.612.117.496.278.360.2]678
Table 5. Cure ratio,Tg, and moisture uptake of the reference and conditioned GFRP bars 679
Property
GFRP bar type
Polyester Vinyl-ester Epoxy
Reference 5,000 h Reference 5,000 h Reference 5,000 h
Cure ratio (%) 98 100 99 99 100 100
Tg (oC) 93 98 113 100 126 112
Moisture uptake
(%) 1.15 1.36 0.63 0.38 0.23 0.20
680
681
Table 6. Ratio of the FTIR peaks 682
Test location
OH/CH ratio
Polyester Vinyl-ester Epoxy
Reference 5,000 h Reference 5,000 h Reference 5,000 h
Surface 2.60 14.3 2.40 1.80 1.60 1.50
Core 1.60 3.50 1.80 1.50 1.25 1.20
683
684
685
33
List of Figures 687
Figure 1. Tested GFRP bars 688
Figure 2. DSC scans for glass transition temperature (Tg) 689
Figure 3. Setup for transverse-shear test and typical shear failure mode: (a) test setup; (b) failure 690
mode 691
Figure 4. Setup for flexural testing and typical failure mode: (a) test setup; (b) failure mode 692
Figure 5. Setup for short-beam testing and typical failure mode: (a) test setup; (b) failure mode 693
Figure 6. Effect of conditioning in the alkaline solution at 60°C on mechanical properties: 694
(a) transverse-shear strength; (b) flexural strength; (c) flexural modulus of elasticity; 695
(d) interlaminar-shear strength 696
Figure 7. Micrographs of the cross section of the reference FRP bars 697
Figure 8. Micrographs of the fiber/matrix interface of a glass/epoxy bar before and after 698
conditioning: (a) before conditioning; (b) after conditioning 699
Figure 9. Micrographs of the fiber–matrix interface of a glass/polyester bar before and after 700
conditioning: (a) before conditioning; (b) after conditioning 701
Figure 10. Micrographs of the fiber–matrix interface of a glass/vinyl-ester bar before and after 702
conditioning: (a) before conditioning; (b) after conditioning 703
Figure 11. Micrographs of bars conditioned in the alkaline solution for 1,000 h at 60oC (after 704
interlaminar shear failure): (a) glass/epoxy; (b) glass/polyester; (c) glass/vinyl-ester 705
Figure 12. FTIR spectra of reference and specimens conditioned for 5,000 h 706
Figure 13. Peak areas used to calculate a O–H/C–H 707
34 709
Figure 1. Tested GFRP bars 710
711
712
Figure 2. DSC scans for glass transition temperature (Tg) 713
714
715
716
717
718
Temperature (oC)
H
ea
t
F
lo
e
(W
\g)
Epoxy GFRP bars
Vinyl-ester GFRP bars
Polyester GFRP bars
93 oC (H)
126 oC (H)
[image:34.612.188.429.291.459.2]35
719
[image:35.612.148.529.70.249.2]720
Figure 3. Setup for transverse-shear test and typical shear failure mode: (a) test setup; (b) failure 721
mode 722
723
Figure 4. Setup for flexural testing and typical failure mode: (a) test setup; (b) failure mode 724
725
726
727
728
729
730
731
Test setup
(a) (b)
Glass/epoxy
Glass/vinyl-ester Glass/polyester
Glass/epoxy
Glass/polyester
Glass/vinyl-ester
(a) (b)
[image:35.612.125.548.309.490.2]36 732
733
734
[image:36.612.147.526.156.327.2]735
Figure 5. Setup for short-beam testing and typical failure mode: (a) test setup; (b) failure mode 736
737
738
739
740
741
742
743
744
745
746
747
748
749
Glass/epoxy
Glass/polyester
37 750
(a) transverse-shear strength (b) flexural strength 751
752
[image:37.612.54.526.71.476.2](c) flexural modulus of elasticity (d) interlaminar-shear strength 753
Figure 6. Effect of conditioning in the alkaline solution at 60°C on mechanical properties: 754 755 756 180 200 220 240 260 280
0 1000 2000 3000 4000 5000
T ra n s. sh ea r st re n g th ( M P a)
Conditioning period (hours)
Glass/epoxy Glass/vinyl-ester Glass/polyester (a) 800 900 1000 1100 1200 1300 1400 1500 1600
0 1000 2000 3000 4000 5000
F le x u ra l st re n g th ( M P a)
Conditioning period (hours) Glass/epoxy Glass/polyester Glass/vinyl-ester (b) 45 50 55 60 65 70
0 1000 2000 3000 4000 5000
M o d u lu s o f el ast ic it y ( G P a)
Conditioning period (hours) Glass/epoxy Glass/polyester Glass/vinyl-ester (c) 20 30 40 50 60 70 80
0 1000 2000 3000 4000 5000
In te rl ami n ar -sh ea r st re n g th ( M P a)
Conditioning period (hours)
Glass/epoxy
Glass/polyester Glass/vinyl-ester
38 757
(a) Polyester GFRP bar 758
759
(b) Vinyl-ester GFRP bar 760
761
[image:38.612.192.420.67.635.2](c) Epoxy GFRP bar 762
Figure 7. Micrographs of the cross section of the reference GFRP bars 763
764
39 766
767
[image:39.612.75.536.96.283.2](a) (b) 768
Figure 8. Micrographs of the fiber–matrix interface of an epoxy GFRP bar before and after 769
conditioning: (a) before conditioning; (b) after conditioning 770
771
772
773
774
775
776
777
778
779
40
781
[image:40.612.73.537.72.265.2](a) (b) 782
Figure 9. Micrographs of the fiber–matrix interface of a polyester GFRP bar before and after 783
conditioning: (a) before conditioning; (b) after conditioning 784
785
786
(a) (b) 787
Figure 10. Micrographs of the fiber/matrix interface of a vinyl-ester GFRP bar before and after 788
conditioning: (a) before conditioning; (b) after conditioning 789
790
791
792
[image:40.612.71.543.338.523.2]41 794
(a) 795
796
(b) 797
798
[image:41.612.77.540.71.643.2](c) 799
Figure 11. Micrographs of bars conditioned in the alkaline solution for 1,000 h at 60oC (after 800
interlaminar shear failure): (a) polyester G