David Duffy
John FitzGerald
Kevin Timoney
David Byrne
Spring 2014
The
Economic Research
Institute
was
founded
in
Dublin
in
1960,
with
the
assistance
of
a
grant
from
the
Ford
Foundation
of
New
York.
In
1966
the
remit
of
the
Institute
was
expanded
to
include
social
research,
resulting
in
the
Institute
being
renamed
The
Economic
and
Social
Research
Institute
(ESRI).
In
2010
the
Institute
entered
into
a
strategic
research
alliance
with
Trinity
College
Dublin,
while
retaining
its
status
as
an
independent
research
institute.
The
ESRI
is
governed
by
an
independent
Council
which
acts
as
the
board
of
the
Institute
with
responsibility
for
guaranteeing
its
independence
and
integrity.
The
Institute’s
research
strategy
is
determined
by
the
Council
in
association
with
the
Director
and
staff.
The
research
agenda
seeks
to
contribute
to
three
overarching
and
interconnected
goals,
namely,
economic
growth,
social
progress
and
environmental
sustainability.
The
Institute’s
research
is
disseminated
through
international
and
national
peer
reviewed
journals
and
books,
in
reports
and
books
published
directly
by
the
Institute
itself
and
in
the
Institute’s
working
paper
series.
Researchers
are
responsible
for
the
accuracy
of
their
research.
All
ESRI
books
and
reports
are
peer
reviewed
and
these
publications
and
the
ESRI’s
working
papers
can
be
downloaded
from
the
ESRI
website
at
www.esri.ie
The
Institute’s
research
is
funded
from
a
variety
of
sources
including:
an
annual
grant
‐
in
‐
aid
from
the
Irish
Government;
competitive
research
grants
(both
Irish
and
international);
support
for
agreed
programmes
from
government
departments/agencies
and
commissioned
research
projects
from
public
sector
bodies.
Sponsorship
of
the
Institute’s
activities
by
Irish
business
and
membership
subscriptions
provide
a
minor
source
of
additional
income.
Quarterly
Economic
Commentary
The
Quarterly
Economic
Commentary
analyses
current
economic
trends
and
provides
macro
‐
economic
forecasts
for
the
current
and
following
year.
It
assesses
international
economic
prospects
and
provides
short
‐
term
forecasts
in
the
framework
of
a
consistent
set
of
national
accounts
for
Ireland.
Its
wide
range
of
users
includes
government
departments,
policy
‐
makers,
social
partners,
international
organisations,
academics
and
the
national
and
international
financial
sectors.
Research
Bulletin
The
Research
Bulletin
provides
short
summaries
of
work
published
by
ESRI
staff
and
overviews
of
thematic
areas
covered
by
ESRI
programmes
of
research.
Bulletin
articles
are
designed
to
be
easily
accessible
to
a
wide
readership.
A
reference
or
references
to
the
full
publication
is
included
at
the
end
of
each
Bulletin
article.
An
archive
of
bulletin
articles
will
be
found
at
www.esri.ie/bulletin
Quarterly Economic
Commentary
David Duffy John FitzGerald Kevin Timoney David Byrne
Spring 2014
Research Notes
Special Articles
Research Bulletins
Authors
David Duffy is a Senior Research Officer and Editor of the Commentary, John FitzGerald is a Research Professor, and Kevin Timoney and David Byrne are Research Assistants at the Economic and Social Research Institute (ESRI).
The Commentary, Research Notes, Special Articles and Research Bulletins contained within have been accepted for publication by the Institute, which is not responsible for either the content or the views expressed.
Research Bulletins
The following research bulletins have been published on our website:
• Fiscal Forecast Errors: Governments Versus Independent Agencies?
by Rossana Merola and Javier J. Pérez
• Fiscal Consolidation and Implications of Social Spending for Long-Term Fiscal Sustainability
by Rossana Merola and Douglas Sutherland (OECD)
• The Value of Domestic Building Energy Efficiency – Evidence from Ireland
by Marie Hyland, Ronan C. Lyons, Seán Lyons
• When to Invest in Carbon Capture and Storage Technology: A Mathematical Model
by D.M. Walsh, K. O’Sullivan (MACSI, UL), W.T. Lee (MACSI, UL), M.T. Devine (MACSI, UL)
• Does Bank Market Power Affect SME Financing Constraints?
by Conor M. O'Toole, Robert Ryan (TCD), Fergal McCann (Central Bank of Ireland)
• Did the Economic Crisis have Impacts on the Health and Well-being of Ireland’s Older People?
by Alan Barrett and Vincent O’Sullivan (TCD)
• Climate Policy, Interconnection and Carbon Leakage: The Effect of Unilateral UK Policy on Electricity and GHG Emissions in Ireland
by John Curtis, Valeria Di Cosmo and Paul Deane (UCC)
All Bulletins can be found on our website at
Table of Contents
Summary Table ... ii
Summary ... iii
National Accounts Tables 2013, 2014, 2015 ... iv
CHAPTERS 1. The International Economy ... 1
2. Growth and Output ... 6
3. Exports of Goods and Services ... 13
4. Investment ... 14
5. Prices, Consumption and Incomes ... 16
6. Public Finances ... 21
7. The Labour Market ... 24
8. Imports and the Balance of Payments ... 28
9. Monetary Sector Developments ... 31
Box 1: Additional Data Needed to Understand Developments in the Economy ... 34
10. General Assessment of the Irish Economy ... 36
Summary Forecast Tables are contained within the main text. Detailed Forecast Tables are contained in an Appendix... 39
SPECIAL ARTICLES ... 43
Alternative Scenarios for New Household Formation in Ireland – David Duffy, David Byrne, John FitzGerald The Structural Balance for Ireland – Adele Bergin, John FitzGerald RESEARCH NOTES ... 79 A Survey-based Analysis of Irish Savings Behaviour by Age
Summary Table
12011 2012 2013 2014 2015
Output (Real Annual Growth %)
Private Consumer Expenditure -1.6 -0.3 -1.2 1.5 2.0
Public Net Current Expenditure -2.8 -3.7 -0.5 -0.5 0.0
Investment -9.5 -1.0 4.4 9.6 10.4
Exports 5.4 1.6 0.1 3.7 4.0
Imports -0.4 0.0 1.0 3.6 3.9
Gross Domestic Product (GDP) 2.2 0.2 -0.4 2.6 3.5
Gross National Product (GNP) -1.6 1.8 3.3 3.5 3.7
Prices (Annual Growth %)
Consumer Price Index (CPI) 2.6 1.7 0.5 0.3 1.0
Growth in Average Hourly Earnings 0.4 0.9 0.0 0.0 1.0
Labour Market
Employment Levels (ILO basis (000s)) 1,849 1,838 1,881 1,933 1,985
Unemployment Levels (ILO basis (000s)) 317 316 282 249 222
Unemployment Rate (as % of Labour Force) 14.6 14.7 13.1 11.4 10.1
Public Finance
General Government Balance (€bn) -21.3 -13.5 -11.5 -7.7 -5.0
General Government Balance (% of GDP) -13.1 -8.2 -7.0 -4.5 -2.8
General Government Debt (% of GDP) 104.8 116.4 124.5 120.5 116.1
External Trade
Balance of Payments Current Account (€bn) 2.0 7.3 10.9 13.3 15.0
Current Account (% of GNP) 1.5 5.5 7.9 9.3 9.9
Demand
Final Demand 2.2 0.2 0.0 3.1 3.7
Domestic Demand -1.8 -1.6 -0.1 2.3 3.2
Domestic Demand (excl. Stocks) -3.0 -1.1 -0.3 2.3 2.9
Note: Detailed forecast tables are contained in an Appendix to this Commentary.
1 There are some minor differences between the numbers for 2012 and 2013 in this Commentary and the latest CSO
Summary
GNP, which provides the best measure of the standard of living (and output) of
Irish residents, is estimated to have grown by 3.3 per cent2 in 2013. This shows an
economy that is recovering quite vigorously. The continuing improvement in the current account of the balance of payments, the rapid growth in employment and the signs of a pick-up in investment all point to a continuation of the recovery into 2014. As a result, on the basis of the information available to us today, we expect growth in GNP in 2014 of 3.5 per cent and that this pattern will continue into 2015, resulting in growth in GNP next year of 3.7 per cent.
A consequence of this significant growth in output and employment will be a further fall in unemployment. The unemployment rate should be down to an average of 10 per cent of the labour force in 2015. However, this would still be a long way short of the long-term equilibrium rate of unemployment.
The continuing increase in the surplus on the current account of the balance of payments is also a sign that the economy has not returned to long-run equilibrium; households and companies are continuing to deleverage at an exceptional rate. While this process continues growth in domestic demand will remain weak. However, there are signs of incipient growth in private investment and, as this trend develops, it will contribute to further growth in output and employment. Demand for accommodation in the Dublin area is now running ahead of supply and, until supply responds, this will put upward pressure on rents and prices.
The public finances are improving more rapidly than envisaged in the government’s plan. If the forecast in this Commentary proves to be correct, government borrowing in 2015 is likely to come in below the target (3 per cent of GDP) once again, even without the substantial further cuts envisaged for the 2015 Budget. However, in formulating fiscal policy it is best to err on the side of caution to ensure that budgetary targets are met in 2015. Nonetheless, these developments suggest that, after a long period of attrition, we are approaching the end of the very painful period of fiscal adjustment. However, there still remains the possibility of new shocks to the economy.
Finally, there are major problems with the data available on trends in the Irish economy and there is a need to provide additional data that clarify the contribution to GNP of individual sectors of the economy.
2 Due to limited coverage in the CSO’s preliminary 2013 national accounts, our numbers are based on data from
National Accounts 2013
A: Expenditure on Gross National Product
2012 2013 % Change in 2013
€bn €bn Value Price Volume
Private Consumer Expenditure 82.6 83.0 0.5 1.7 -1.2
Public Net Current Expenditure 25.1 25.1 -0.2 0.4 -0.5
Gross Fixed Capital Formation 17.4 18.4 5.6 1.2 4.4
Exports of Goods and Services 176.7 177.1 0.2 0.1 0.1
Physical Changes in Stocks 0.4 0.5
Final Demand 302.3 304.1 0.6 0.6 0.0
less:
Imports of Goods and Services (M) 137.0 138.7 1.3 0.3 1.0
Statistical Discrepancy -1.3 -1.4
GDP at Market Prices 163.9 163.9 0.0 0.4 -0.4
Net Factor Payments (F) -31.3 -26.1
GNP at Market Prices 132.6 137.9 3.9 0.6 3.3
B: Gross National Product by Origin
2012 2013 Change in 2013
€bn €bn €bn %
Agriculture 2.9 3.0 0.1 3.0
Non-Agriculture: Wages, etc. 68.4 69.3 0.9 1.3
Other 59.8 57.5 -2.3 -3.8
Adjustments: Stock Appreciation -0.1 -0.1
Statistical Discrepancy 1.3 1.4
Net Domestic Product 132.3 131.0 -1.2 -0.9
Net Factor Payments -31.3 -26.1 5.2 -16.6
National Income 101.0 105.0 4.0 3.9
Depreciation 16.4 16.7 0.3 2.0
GNP at Factor Cost 117.4 121.7 4.3 3.7
Taxes less Subsidies 15.3 16.2 0.9 5.9
GNP at Market Prices 132.7 137.9 5.2 3.9
C: Balance of Payments on Current Account
2012 2013 Change in 2013
€bn €bn €bn
X – M 39.6 38.2 -1.3
F -31.3 -26.1 5.2
Net Transfers -1.2 -1.4 -0.2
Balance on Current Account 7.3 10.9 3.7
as % of GNP 5.5 7.9
National Accounts 2014
A: Expenditure on Gross National Product
2013 2014 % Change in 2014
€bn €bn Value Price Volume
Private Consumer Expenditure 83.0 84.7 2.0 0.5 1.5
Public Net Current Expenditure 25.1 24.7 -1.2 -0.7 -0.5
Gross Fixed Capital Formation 18.4 20.8 13.2 3.3 9.6
Exports of Goods and Services 177.1 185.7 4.9 1.1 3.7
Physical Changes in Stocks 0.5 0.5
Final Demand 304.1 316.5 4.1 1.0 3.1
less:
Imports of Goods and Services (M) 138.7 145.1 4.6 0.9 3.6
Statistical Discrepancy -1.4 -1.4
GDP at Market Prices 163.9 170.0 3.7 1.0 2.6
Net Factor Payments (F) -26.1 -25.9
GNP at Market Prices 137.9 144.1 4.6 1.0 3.5
B: Gross National Product by Origin
2013 2014 Change in 2014
€bn €bn €bn %
Agriculture 3.0 3.0 0.1 2.5
Non-Agriculture: Wages, etc. 69.3 70.9 1.6 2.3
Other 57.5 60.6 3.1 5.5
Adjustments: Stock Appreciation -0.1 -0.1
Statistical Discrepancy 1.4 1.4
Net Domestic Product 131.0 135.9 4.8 3.7
Net Factor Payments -26.1 -25.9 0.2 -0.9
National Income 105.0 110.0 5.0 4.8
Depreciation 16.7 17.0 0.3 2.0
GNP at Factor Cost 121.7 127.0 5.4 4.4
Taxes less Subsidies 16.2 17.1 0.9 5.7
GNP at Market Prices 137.9 144.1 6.3 4.6
C: Balance of Payments on Current Account
2013 2014 Change in 2014
€bn €bn €bn
X – M 38.2 40.5 2.2
F -26.1 -25.9 0.2
Net Transfers -1.4 -1.4 0.0
Balance on Current Account 10.9 13.3 2.5
National Accounts 2015
A: Expenditure on Gross National Product
2014 2015 % Change in 2015
€bn €bn Value Price Volume
Private Consumer Expenditure 84.7 87.2 3.0 1.0 2.0
Public Net Current Expenditure 24.7 24.2 -2.0 -2.0 0.0
Gross Fixed Capital Formation 20.8 23.8 14.2 3.4 10.4
Exports of Goods and Services 185.7 195.3 5.2 1.1 4.0
Physical Changes in Stocks 0.5 1.0
Final Demand 316.5 331.6 4.8 1.1 3.7
less:
Imports of Goods and Services (M) 145.1 152.2 4.9 1.0 3.9
Statistical Discrepancy -1.4 -1.4
GDP at Market Prices 170.0 178.0 4.7 1.2 3.5
Net Factor Payments (F) -25.9 -26.7
GNP at Market Prices 144.1 151.3 4.9 1.2 3.7
B: Gross National Product by Origin
2014 2015 Change in 2015
€bn €bn €bn %
Agriculture 3.0 3.1 0.1 2.5
Non-Agriculture: Wages, etc. 70.9 73.6 2.8 3.9
Other 60.6 64.7 4.0 6.8
Adjustments: Stock Appreciation -0.1 -0.1
Statistical Discrepancy 1.4 1.4
Net Domestic Product 135.9 142.7 6.0 5.0
Net Factor Payments -25.9 -26.7 -0.8 3.3
National Income 110.0 116.0 6.0 5.4
Depreciation 17.0 17.6 0.5 3.0
GNP at Factor Cost 127.0 133.5 6.5 5.1
Taxes less Subsidies 17.1 17.7 0.6 3.6
GNP at Market Prices 144.1 151.3 7.1 4.9
C: Balance of Payments on Current Account
2014 2015 Change in 2015
€bn €bn €bn
X – M 40.5 42.9 2.5
F -25.9 -26.7 -0.8
Net Transfers -1.4 -1.4 0.0
Balance on Current Account 13.3 15.0 1.6
as % of GNP 9.3 9.9
1
The International Economy
The international economy in 2014 and 2015 is expected to be more favourable to Ireland than it was in 2013. Of particular relevance is growth in Ireland’s main trading partners; the Euro Area, United Kingdom and United States. Following two consecutive years of contraction, Real GDP in the Euro Area is expected to grow by just over 1 per cent this year and 1.5 per cent in 2015. Prospects for the economies in the United States and the United Kingdom are more encouraging, with growth of approximately 2.5 to 3 per cent forecast for the coming two years. As shown in Figure 1, at present there is a wider distribution of forecasts for the Euro Area and the UK than there is for the US.
FIGURE 1 Real GDP Growth (% change, year on year)
Euro Area United States United Kingdom
Sources: FocusEconomics, Eurostat, IMF, OECD, HM Treasury and Federal Reserve.
The Euro Area Economy
The European Central Bank (ECB) has left its main refinancing rate, marginal lending rate and deposit rate unchanged at 0.25 per cent, 0.75 per cent and 0.00 per cent, respectively, since November 2013. In addition, no decision was taken in April on the implementation of a quantitative easing programme. The ECB currently sterilises bond purchases using bank deposits, ensuring that these purchases do not lead to inflation. As measured by the Harmonised Index of
Consumer Prices, annual inflation in the Euro Area was 0.5 per cent in March,
considerably below its target of just under 2 per cent. Furthermore, there was -2 -1 0 1 2 3 4
2011 2012 2013 2014 2015 -2
-1 0 1 2 3 4
2011 2012 2013 2014 2015 -2
-1 0 1 2 3 4
2011 2012 2013 2014 2015
weak growth in money supply in February, with annual growth of 1.3 per cent in the broad monetary aggregate M3. Loans to the private sector also fell by 2.2 per cent in February. The ECB therefore faces challenges in fulfilling its price stability mandate and in supporting recovery in Europe.
Decision was reached in March between the European Parliament and member states relating to the Single Resolution Mechanism (SRM) for dealing with failing banks. The SRM is intended to contribute to breaking the link between failing banks and sovereigns. Supervision by the ECB, rather than by national authorities, of some of Europe’s largest banks plays another part in this. Whether the SRM will fulfil its intended role is an open question. The process needs to be swift to avoid the possibility of damaging bank runs, however the decision-making process outlined in the SRM remains lengthy and requires input from national governments. Since the last Commentary, negotiations have led to greater and quicker mutualisation of the contributions from member states into a single fund, although this will still take eight years to complete.
Euro Area GDP rose by 0.5 per cent year on year in the fourth quarter of 2013. Each of the previous three quarters had registered negative year-on-year growth. GDP grew by 1.1 per cent in the EU28 in the fourth quarter. Employment in the Euro Area rose 0.1 per cent quarter on quarter in Quarter 4, but fell by 0.5 per cent year on year.
The US Economy
Since the last Commentary, the US labour market has displayed relatively weak growth. In the year to November, the Labor Department’s Non-Farm Payrolls survey posted average monthly job creation of 205,000. Record-breaking cold weather in the United States in December and January contributed to lower jobs growth of 84,000 and 144,000, respectively. Stronger employment growth returned in February and March, with 197,000 and 192,000 jobs added in those months. The unemployment rate now stands at 6.7 per cent, down from annual averages of 8.1 per cent and 7.4 per cent for 2012 and 2013 respectively.
cutting its monthly asset purchases by $10 billion to $55 billion. At its height, the programme involved monthly purchases of $85 billion.
GDP growth fell to an annual rate of 2.6 per cent in the fourth quarter, from 4.1 per cent in the previous quarter, despite the strongest growth in consumer spending for three years. The overall weaker performance in the fourth quarter has also been attributed to the severe weather. Performance continued to deteriorate in January but has showed signs of a rebound in February. Retail sales followed a 0.6 per cent fall with growth of 0.3 per cent in February and factory production grew by 0.8 per cent after January’s fall of 0.9 per cent, the largest since May 2009.
The UK Economy
The economy of the United Kingdom grew by 0.7 per cent in volume terms in the fourth quarter of 2013, contributing to GDP growth of 1.7 per cent for 2013. In addition, the Office for National Statistics has revised upward GDP growth rates from the first quarter of 2012 onward. Household consumption has been the biggest driver of the recent recovery in UK GDP growth, rising for the ninth consecutive quarter and by 2.4 per cent year-on-year in Quarter 4 2013. Gross Fixed Capital Formation also played an important role, increasing by 2.4 per cent in the fourth quarter, being driven predominantly by growth in business investment. Net trade provided less of a drag on the UK economy in 2013, with exports rising by 1 per cent and imports rising by 0.5 per cent.
FIGURE 2 United Kingdom Real GDP, 2004-2013
Source: Office for National Statistics, Quarterly National Accounts.
Note: PCE includes expenditure by non-profit institutions, GFCF includes changes in stocks, net trade includes statistical discrepancy.
The labour market recovery in the UK has continued since the last Commentary; employment gains in the fourth quarter were 193,000, pushing the employment rate up 0.3 percentage points to 72.1 per cent. The unemployment rate fell by 0.4 percentage points from the previous quarter to 7.2 per cent in Quarter 4, with the number unemployed falling by 125,000 to 2.34 million. UK unemployment peaked at an annual average of 8.1 per cent in 2011. The labour force participation rate in the UK is currently 76.8 per cent, higher than the US (72.5 per cent) and Ireland (69.8 per cent).
In the year to February 2014, the inflation rate in the UK (as measured by the Consumer Price Index) was 1.7 per cent, down from an annual rate of 1.9 per cent in January 2013. January represented the first time in the previous four years that the inflation rate was below 2 per cent. Real wages have continued to decline despite an increase of 1.3% in average weekly earnings year-on-year between November 2013 and January 2014.
The World Economy
certain economies. While the economic prospects of advanced economies, particularly the US, have continued to improve, there is a weakening outlook for emerging markets such as Russia, India, Brazil, Turkey and China.
The Russian economy is likely to be affected by current international political tensions; following the annexation of Crimea, the Rouble fell to record lows versus the Dollar and Euro. This prompted the Bank of Russia to raise its main borrowing rate from 5.5 to 7 per cent, a move which will not be conducive to the growth of a currently weak economy. Russian stock market indices have also dropped since the start of the crisis, with foreign sanctions causing them to fall further. Fallout from the Ukraine crisis has been noted in the March edition of the Ifo Business Confidence Index, a monthly survey of 7,000 German businesses. The Index fell for the first time in five months, with the drop in business expectations being attributed to the Ukraine crisis in particular.
2
Growth and Output
Over the last two years it has become increasingly difficult to unravel recent trends in the economy, much less to forecast developments in the coming year. The release, in March of this year, of the National Accounts for 2013 raises more questions about what is happening in the economy than it answers. The most striking problem which these data pose for those watching the Irish economy is the dramatically different trajectory of real GDP and real GNP. The standard measure that is focused on internationally, GDP, fell by 0.3 per cent in 2013, while real GNP rose by 3.3 per cent. We know that GNP is the most appropriate measure of the standard of living in Ireland, as it leaves out the profits of multinationals that properly belong to their foreign owners rather than to those living in Ireland (as well as excluding national debt interest paid abroad). However, this is less easily explained to an international audience. The very wide divergence in the trends manifested by the two measures requires explanation.
FIGURE 3 Gap between Growth Rate of Real GNP and Real GDP, Percentage Points
Source: Central Statistics Office and ESRI Forecasts.
Given the relatively large presence of the multi-national sector in the Irish economy, there has always been some difference between the movement of GNP and GDP. However, as Figure 3 reveals, in 2013 this gap was never larger.
-5 -4 -3 -2 -1 0 1 2 3 4 5
1980 1985 1990 1995 2000 2005 2010 2015
Per
cen
ta
ge P
oi
nt
s
Also, as shown by the seven year moving average, while for many years GDP grew more rapidly than GNP, this pattern has reversed. This reflects a change in behaviour by the multinational sector of the economy.
There are a number of factors giving rise to this very large difference between the two measures of output. As discussed in the Autumn 2013 Commentary
(FitzGerald, 2013a) and in Enright and Dalton (2013)3, the ending of patents on
some pharmaceuticals was a major reason for the difference in trend in GDP and GNP in 2012, and the effects of this change have also influenced the figures for 2013.
The so called “patent cliff” has affected the data through its effects on the value of sales and, hence, of exports. In turn this has led to a large drop in profits and value added arising in the pharmaceutical sector in Ireland, with concomitant
knock-on effects on GDP.4 However, when the reduced outflow of profits
abroad is taken into account, there is little effect on GNP.5 For 2014 it would
appear that the effect of drugs dropping out of patent will be much smaller than in 2012 and 2013. Hence, we are forecasting a smaller gap between the growth rates in these two measures of output in 2014 and very little difference between the two measures in 2015.
However, at least one other factor has come into play in recent years, which is further adding to the difference between the two measures of growth. This is
the behaviour of firms in the broad ICT sector6. In 2012 and 2013 there was
significant growth in employment in this sector. However, there has also been a trend increase in the share of the total turnover going abroad to pay royalties on the intellectual property used in the sector, reducing the share of domestic value added in total turnover. Thus, while there has been very rapid growth in exports of IT services in recent years, value added has grown much more slowly. The national accounts data show that in 2012, while the wage bill increased by around 20 per cent, there was no increase in profits. Foreign firms operating in the sector, instead of earning profits in Ireland from the substantial increase in sales in 2012, chose to pay increased royalty payments abroad, reducing their
3 See FitzGerald, J., (2013a), “The Effect on Major Accounting Aggregates of the Ending of Pharmaceutical Patents”, ESRI
Research Note 2013/2/1, published in Quarterly Economic Commentary, Autumn, Dublin: Economic and Social Research Institute, and Dalton, M. and S. Enright, (2013), “The Impact of The Patent Cliff on Pharma-Chem Output in Ireland”, Working Paper no. 1, 2013. Dublin: The Department of Finance.
4 The evidence available suggests that the major impact of the loss of patents has been on profits arising in Ireland
rather than on patent royalties paid abroad. This has maximised the impact on GDP.
5 To the extent that corporation tax payments are reduced consequent on the reduction in profits there would be an
effect on GNP as well. However, with a tax rate of 12.5 per cent, at a maximum the effect on GNP would be one-eighth of the effect on GDP.
profits in Ireland. By paying royalties to an affiliated company abroad they reduce their tax liabilities in Ireland.
In 2013 value added in the distribution and ICT sector7 actually fell by over 2 per
cent in real terms, having a significant negative effect on GDP. This was probably primarily due to the reduction in ICT profits earned in Ireland, as all the evidence would point to a simultaneous increase in employment in the sector. Because virtually all of the profits of these foreign owned IT firms flow back out of the country, the fall in value added has no effect on GNP. In fact, because of the rise in employment and the associated wage bill, the sector may have made a significant positive contribution to the rise in GNP in 2013. While the effects of the patent cliff may be wearing off in 2014, the changing behaviour of the IT sector may have a continuing negative effect on GDP this year. This is reflected in our forecast for GDP in 2014.
This analysis suggests that, when trying to understand underlying movements in real income in Ireland in 2012, 2013 and 2014, it is the trend in GNP rather than GDP which warrants greater attention. On this basis, 2013 marked a very successful return to growth in the Irish economy, something that is not apparent in the headline GDP figure. However, GDP is the measure conventionally used when comparing economic growth across countries. Thus, what is a domestic success story may appear to much of the outside world as continued economic stagnation. The arcane issues underlying developments in the economy are difficult to explain to an international audience.
These unusual developments have a major impact on sectoral GDP on the output side of the national accounts, and also on exports and factor flows on the expenditure side of the accounts. This means that while the short-term indicators used for forecasting may suggest that exports are falling or stagnant, the domestic value added from those exports may actually be rising. Similarly, what may look like a fall in the short-term indicators for manufacturing output may actually translate into an increase in GNP. This difficulty in interpreting key short-term data greatly hampers our ability to track what is happening in the economy in real time.
For these reasons, in developing our forecasts for the economy we place considerable reliance on the changes in the current account of the balance of payments and also on the growth in employment. In the period 2012-15 these
two key aggregates are not likely to be seriously affected by the unusual developments in the Irish economy set out above.
In the case of the current account surplus, it is well known that over the period 2009-12, the effect of redomiciled PLCs moving to Ireland served to artificially
improve the balance on current account (FitzGerald, 2013b).8 However, with
the relocation of these firms to Ireland completed, this factor ceased to affect the trend in the current account surplus in 2012 and 2013. As a result, the big improvement in the current account in 2012 and 2013 represents a real increase in value added accruing to the tradable sector of the economy from its sales abroad. Figure 4 shows the trend in the current account with and without an
adjustment to exclude the effects of the redomiciled PLCs9.
FIGURE 4 Current Account of the Balance of Payments, Adjusting for Redomiciled PLCs
Source: Central Statistics Office and ESRI Forecasts.
The increase in the current account surplus in 2013 amounted to 2.4 percentage points of GNP, a large proportion of the total increase in real GNP of 3.3 per cent. Thus, sales of goods and services to the outside world by the Irish tradable sector accounted for much of the growth in GNP in 2013.
8 See FitzGerald, J., (2013b), "The Effect of Re-domiciled PLCs on Irish Output Measures and the Balance of Payments,"
QEC Research Notes 2013/1/2, published in Quarterly Economic Commentary, Spring, Dublin: Economic and Social Research Institute.
9 It is assumed that the inflow of profits to these companies in 2013-2015 remains the same as in 2012.
-8 -6 -4 -2 0 2 4 6 8 10 12
2005 2006 2007 2008 2009 2010 2011 2012 2013 2014 2015
Per
cen
ta
ge o
f G
N
P
However, with the data currently available it is not easy to allocate this growth in GNP to individual production sectors in the economy, given the major problems that exist with the traditional national accounting data.
The Irish economy remains very competitive and the external environment in 2014 and 2015 for firms in Ireland will be more favourable than it was in 2013. Hence we anticipate further significant demand from abroad this year and next year for the goods and services produced by the tradable sector. The effect on GNP arising in the tradable sector should be at least as high as it was in 2013.
In terms of the current account of the balance of payments, as discussed later in this Commentary, for 2014 and 2015, we anticipate a further improvement in the surplus. However, the improvement will not be as great as it was in 2013 as the return to growth in domestic demand will result in a substantially greater volume of imports which will, to some extent, offset the effect of growing world demand for Irish goods and services.
FIGURE 5 Productivity Measured as the Growth in GNP less the Growth in Employment
Source: Central Statistics Office and ESRI Forecasts.
The other key factor in arriving at our forecast for GNP is the pattern of growth in employment. Total employment has been growing very vigorously since the last quarter of 2012. In the second half of 2013 the growth in employment was particularly strong and there is a substantial carryover effect into 2014. As
-4 -2 0 2 4 6 8
1960 1965 1970 1975 1980 1985 1990 1995 2000 2005 2010 2015
Per
C
en
t
discussed later in this Commentary, we expect employment to grow by 2.7 per cent a year in both 2014 and 2015, following on growth of 2.4 per cent in 2013. As discussed in a Box 1 in the Winter 2013 Commentary, the bulk of the employment growth is for those with third level qualifications. This reflects the pattern of growth in the economy to date; much of the growth has been in high skilled sectors with little employment growth in the building and construction and related sectors.
In arriving at our forecast for GNP we take account of our projections for employment and add to that an estimate of the likely growth in productivity, measured in terms of GNP. Figure 5 shows the pattern of growth over the last forty years in productivity measured in this way. It also shows a seven year moving average of the growth rate in this aggregate. By this measure, productivity grew by over 3 per cent a year during the 1960s and the 1970s and again in the 1990s and the early years of the last decade. However, it had fallen back to around one per cent a year before the recession hit. Since 2005 it has stabilised at around that level. As a result, we are assuming in this Commentary a similar rate of growth in productivity to that experienced in recent years: one per cent a year in 2014 and 2015. This results in a forecast for GNP growth of 3.5 per cent in 2014 and 3.7 per cent in 2015.
Because of the complications affecting the national accounts, outlined above, it is much more difficult to forecast the growth of GDP. We anticipate that while the effects of the patent cliff on the national accounts will be more muted in 2014 than in 2012 or 2013, the continuing changes in behaviour in the ICT sector will have some negative effect on measured GDP in 2014. Hence, we are forecasting that GDP in 2014 will rise by only 2.6 per cent. In 2015 we anticipate that these special factors will have fully played out and the growth in GDP of 3.5 per cent will be close to the forecast growth in GNP.
However, the particular uncertainty associated with the GDP forecast must be emphasised. Depending on the accounting behaviour of relatively few multinational firms the growth in GDP could prove to be much lower than we are forecasting. By contrast a reasonable margin of error around our GNP forecast for 2014 and 2015 would be ±0.75 percentage points.
Output
Agriculture saw very rapid growth in output in 2013 (Table 1). However, this was a recovery after a very bad year in 2012. Our forecast for 2014 and 2015 is for a return to relatively low growth of just over 1 per cent a year.
TABLE 1 Industry and Output
2012 2012 2013 2014 2015
Value Volume Change
€ billion % % % %
Agriculture 3.6 -12.6 7.1 1.2 1.2
Industry 38.1 -0.4 -3.8 -1.0 0.0
Distribution, Transport, Software
and Communications 36.2 -0.6 -2.7 1.0 3.0
Public Administration and Defence 6.0 -6.3 -3.3 -2.0 -2.0
Other Services 61.1 2.7 2.1 5.1 5.8
GVA at Factor Cost 148.7 0.3 -1.0 2.4 3.6
Source: Central Statistics Office and ESRI Forecasts.
Because of the legacy effects of the patent cliff, we anticipate a small further fall in industrial output this year, with no change next year. However, if firms adopt different accounting practices, there could be more rapid growth in measured output than we are assuming.
The fall in output in distribution and software in 2013 appears to have been primarily due to changing accounting practises by some key multinationals in the IT sector. Once again, we anticipate some legacy effects pulling down growth in 2014 to only one per cent. However, for 2015, with the effects of the “patent cliff” coming to an end, we are assuming that these accounting effects will have played out and that the output of the sector will grow by around 3 per cent.
3
Exports of Goods and Services
The value of goods exports fell in 2013 by 4.6 per cent. To a considerable extent the fall was due to the impact of the pharmaceutical patent cliff, as discussed in
previous Commentaries.10 Detailed trade statistics show that the decline was
concentrated in exports of organic chemicals and medical pharmaceutical products. With annual average merchandise export prices showing a small decline of 0.8 per cent the volume of visible exports fell by 3.9 per cent in 2013. Data in the National Accounts release show that service exports exceeded goods exports again in 2013, growing by 3.9 per cent. Thus, total exports of goods and services were broadly unchanged from their 2012 level, showing a marginal increase of 0.1 per cent in volume and 0.2 per cent in value last year.
With the international environment expected to show continued recovery in 2014 and 2015 we are forecasting an improvement in the volume growth of merchandise exports, although it is important to note that these growth rates remain quite moderate. The main driver of export growth will continue to be the service sector, again aided by recovering economic growth and by increased capacity suggested by the number of service sector FDI projects announced by the IDA in recent years. Thus, service sector exports are forecast to grow by 7 per cent this year. While there may be some moderation in the growth level next year it is likely to remain strong at approximately 5.7 per cent. On the basis of these forecasts we are projecting an increase in the volume of total exports of 3.7 per cent in 2014 and 4 per cent in 2015. While the export price deflator is projected to increase to approximately 1 per cent over the forecast period we are, therefore, forecasting that the value of exports of goods and services will grow by 4.2 per cent in 2014 and by 5.2 per cent in 2015.
TABLE 2 Exports of Goods and Services
2012 2012 2013 2014 2015
Value Volume Change
€ billion % % % %
Merchandise 85.8 -3.6 -3.9 0.0 1.9
Services:
Tourism 3.0 -3.3 9.4 4.0 4.0
Other Services 87.3 7.2 3.7 7.0 5.7
Total Services 90.3 6.9 3.9 6.9 5.6
Exports of Goods and Services 176.7 1.6 0.1 3.7 4.0 Sources: Central Statistics Office and ESRI Forecasts.
10 See FitzGerald, J., (2013), “The Effect on Major Accounting Aggregates of the Ending of Pharmaceutical Patents”, ESRI
4
Investment
The outlook for investment plays an important role in our forecast for domestic growth in 2014 and 2015. National accounts data show that overall investment grew by 4.4 per cent in volume and by 5.6 per cent in value in 2013, implying an investment deflator of 1.2 per cent. There was some variation across components, with building and construction growing by 11.6 per cent, due to growth in non-residential construction. Investment in machinery and equipment declined by 4.8 per cent. Purchase of aeroplanes can cause some volatility in this component and, once account is taken of these purchases, underlying growth in machinery and equipment investment amounted to 16.3 per cent.
It seems likely that there will be a further increase in the volume of building and construction investment growth in 2014. Although, new house completions fell by 2.2 per cent in 2013, employment growth, economic recovery and low interest rates coupled with demographic factors are all contributing to housing demand at present. As outlined in the accompanying Special Article, (Duffy, Byrne and FitzGerald) demographic factors mean that approximately 25,000 new households, on average, will be formed each year between now and 2030. While the number of dwelling units required will ultimately depend on obsolescence and the vacancy rate, the analysis suggests the number of units required is well in excess of current building levels. Indeed, this supply shortage, at a time when we are seeing growth in employment and continued household formation, has contributed to strong growth in Dublin house prices. The shortage of supply is also contributing to a similar picture with regard to private rents, with rental levels in the Dublin area showing strong growth in contrast to more subdued increases in the rest of the country.
CSO data show non-residential construction grew by 17.7 per cent in 2013, while the volume of civil engineering production grew by 4.4 per cent. The improving economic situation, continued FDI flows, and employment growth should result in a higher level of investment in other building and construction both this year and next.
With a more limited set of leading indicators it is more difficult to monitor investment in machinery and equipment. Registrations of new goods vehicles grew by 1.6 per cent in 2013, while imports of capital goods were 12.9 per cent lower in value terms. With machinery and equipment investment responding to some of the same factors as investment in building and construction, such as economic and employment growth, we are forecasting that this component of investment will increase by 2.5 per cent in 2014 and by 2.7 per cent in 2015. The overall volume of investment is forecast to grow by 9.6 per cent this year and by 10.4 per cent in 2015. With activity levels anticipated to grow, we are forecasting an investment price deflator of approximately 3 per cent in each year. In value terms total investment is forecast to increase by 13.2 per cent in 2014 and by 14.2 per cent in 2015.
TABLE 3 Gross Fixed Capital Formation, % Change in Volume
2012 2012 2013 2014 2015
Value Volume Change
€ billion % % % %
Housing 3.1 -21.4 8.9 28.4 25.0
Other Building 5.6 7.2 16.2 8.5 10.3
Total Building and Construction 9.0 -4.0 13.0 15.2 15.8
Machinery and Equipment 8.4 2.6 -4.8 2.5 2.7
Total 17.4 -1.0 4.4 9.6 10.4
5
Prices, Consumption and Incomes
Prices
As measured by the Harmonised Index of Consumer Prices (HICP), the annual rate of inflation in the Euro Area was 0.5 per cent in March. This compares with a rate of 0.7 per cent in the previous month and a rate of 1.7 per cent in March 2013. Falling energy prices have contributed to the low rates of inflation in Europe; annual inflation in energy prices stood at -2.3 per cent in February. The US Energy Information Administration (EIA) forecasts the price per barrel of crude oil to continue to fall over the medium term, suggesting falling energy prices will continue to affect inflation rates worldwide.
In February, annual inflation in Ireland stood at -0.1 per cent as measured by the
Consumer Price Index (CPI) and 0.1 per cent by the HICP. Falls in price were
registered in the transport and housing, water, electricity, gas and other fuels divisions; two of the largest contributors to the Consumer Price Index. In particular, petrol, diesel, motor vehicles, mortgage interest and home heating oil showed falls in price. In addition, both food and non-alcoholic beverages declined in price over the 12 months to February. Table 4 provides our forecasts for the CPI, HICP and personal consumption deflator for 2014 and 2015.
The European Central Bank (ECB) forecasts that inflation in the Euro Area will not rise to its target of just-under 2 per cent until 2017. While the ECB has not altered its monetary policy stance since the previous Commentary, it remains possible that the ECB will cut its main refinancing rate further, impose negative deposit rates or embark on a quantitative easing programme to ensure that it meets its inflation target.
TABLE 4 Inflation Measures
2012 2013 2014 2015
Annual Change
% % % %
Consumer Price Index 1.7 0.5 0.3 1.0
Personal Consumption Deflator 0.6 1.7 0.5 1.0
HICP 1.9 0.5 0.4 1.2
The Central Bank of Ireland’s Quarterly Financial Accounts for the third quarter of 2013 show that household debt declined by €1.6bn to €168bn during the quarter. This continues a deleveraging trend that began in the fourth quarter of 2008, as shown in Figure 6. A measure of sustainability of this household debt can be derived by expressing the debt as a percentage of gross disposable income. This fell for the ninth consecutive quarter and now lies at 196.1 per cent. Both household debt and its percentage of Gross Disposable Income are at their lowest levels since the fourth quarter of 2006. Household debt to gross disposable income remains high by international standards, with the ratios for the United Kingdom and United States approximately 140 per cent and 110 per cent, respectively.
Consumption
The KBC Ireland/ESRI Consumer Sentiment Index fell slightly to 83.1 in March, from 85.5 in February. February’s value was the highest for the index since May 2007. The 3-month moving average, a representation of the trend in the index, has now risen for 11 consecutive months. The Consumer Sentiment Index series also produces sub-indices which focus on respondents’ views of current economic conditions and their expectations for the future. Topics covered by the sub-indices include how consumers feel about their current financial circumstance compared to 12 months ago, the current buying environment for large household purchases, consumers’ views of their future financial situation, the path of unemployment and the economic outlook for the country as a whole. All of the sub-indices have displayed increases in the last year.
FIGURE 6 Household Debt
Source: Central Statistics Office and Central Bank of Ireland.
100 120 140 160 180 200 220 0 35 70 105 140 175 210
2003 Q1 2005 Q1 2007 Q1 2009 Q1 2011 Q1 2013 Q1
% o f d is po sa bl e i nc om e € bi lli on
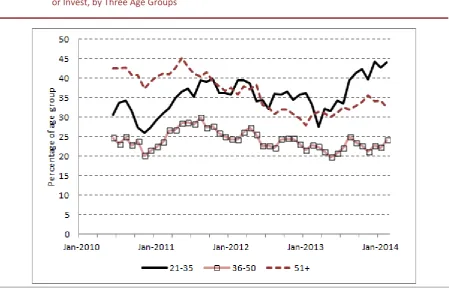
The Nationwide UK (Ireland)/ESRI Savings Index examines savings behaviour and attitudes among Irish consumers. Recent editions of the Index have shown increases in regular saving, decreases in precautionary saving, and increases in the proportion saving to buy or renovate a home. Furthermore, there have been improving assessments of current economic conditions. However, there were also increases in the proportion of respondents who do not save at all, who thought now was a bad time to save and who thought government policy was detrimental to saving, likely reflecting the impact of changes to DIRT in the most recent Budget. In an accompanying Research Note in this Commentary, Timoney (2014) examines data on savings behaviour by age and shows the age group with the highest tendency to save is those aged 21-35. This finding is linked to the housing market and net emigration, whereas a possible explanation for the reduced tendency of older age groups to save is a fall in precautionary savings and the effects of deleveraging and negative equity.
The Retail Sales Index for 2013 rose 0.7 per cent in volume with respect to 2012. There was a value fall of 0.2 per cent, however, reflecting the impact of price changes. Retail sales growth improved significantly during the second half of 2013 and in 2014 to-date, following a weak first half of 2013. The Index showed year-on-year volume increases of 3.5, 9.4 and 5.0 per cent in December, January and February, respectively. The January and February increases were particularly buoyed by the motor trades; there were 3.1 and 2.3 per cent increases with these removed.
Registrations of new private vehicles for the first three months of 2014 were 27 per cent higher than the same period in 2013, with an increase of 51 per cent in new goods vehicles. While 2013 was weak in terms of new vehicles, with a 6 per cent fall, there was growth in the registration of second-hand private and goods vehicles. The growth in goods vehicles in 2013 amounted to 59 per cent and similar growth has been observed thus far in 2014. In January 2013, imports to Ireland from Japan totalled €80 million in value. This increased in January 2014 to €243 million, with imports of Japanese cars likely to have been a contributing factor.
Incomes
earnings were unchanged in the year to the fourth quarter, while public sector earnings fell by 1.5 per cent. Average weekly paid hours increased by 0.3 per cent for the economy as a whole, reflecting a 1.6 per cent increase in hours worked in the public sector with no change in private sector hours. Average hourly earnings fell by 0.9 per cent over the year; from €21.89 in the fourth quarter of 2012 to €21.69 in the fourth quarter of 2013.
FIGURE 7 Real Wages, “Skilled” Real Wages and “Unskilled” Real Wages
Source: Central Statistics Office, own calculations.
The EHECS provides nominal wage data which can be used in conjunction with measure of inflation to determine the path of real wages, as depicted in Figure 7. Using the 2011 CPI as a deflator, real wages fell annually in each year since 2009, with a fall of 1.1 per cent in 2013. Broadly grouping NACE sectors into “skilled” and “unskilled”, it appears that “skilled” real wage growth of -1.6 per cent in 2013 drove this decline. The Quarterly National Household Survey for the fourth quarter of 2013 showed annual employment growth of 3.3 per cent. As discussed in the last Commentary, the recent employment growth has been predominantly among those with third-level education. This may suggest that while many jobs being created are highly educated or “skilled”, the wage rates involved are lower than in the past. However, negative growth in real public-sector wages over this period is also a possible contributing factor.
Table 5 shows our forecasts for incomes and consumption. The continuing improvement in the labour market will contribute to falling transfers and to growth in total income received. As mentioned above, it is the growth in
15 18 21 24 27 30
Q1 Q2 Q3 Q4 Q1 Q2 Q3 Q4 Q1 Q2 Q3 Q4 Q1 Q2 Q3 Q4 Q1 Q2 Q3 Q4 Q1 Q2 Q3 Q4
2008 2009 2010 2011 2012 2013
Re
al
Av
er
ag
e H
ou
rly
E
ar
nin
gs
, €
[image:29.595.74.525.203.477.2]employment rather than particularly strong growth in earnings which will drive the increase in income. Personal disposable income, which is income net of direct personal taxes, is forecast to grow by €1.2 billion to €91.2 billion in 2014, and further to €94.7 billion in 2015. The volume of consumption is thus forecast to grow by 1.5 per cent in 2014 and by 2 per cent in 2015, underscored by the improvement in sentiment and retail sales discussed above.
TABLE 5 Personal Disposable Income
2012 2013 2014 2015
€bn €bn €bn €bn
Agriculture etc. 2.9 3.0 3.0 3.1
Non-Agricultural Wages 68.4 69.3 70.9 73.6
Other Non-Agricultural Income 15.9 17.9 19.7 21.1
Total Income Received 87.1 90.1 93.6 97.9
Current Transfers 25.0 24.2 23.7 23.8
Gross Personal Income 112.2 114.3 117.3 121.6
Direct Personal Taxes 23.1 24.3 26.2 27.2
Personal Disposable Income 89.1 90.0 91.2 94.4
Consumption 82.6 83.0 84.7 87.2
Personal Savings 6.5 7.0 6.5 7.2
Savings Ratio 7.3 7.8 7.1 7.6
Average Tax Rate (%) 20.6 21.2 22.2 22.3
6
Public Finances
Since the then government put in place a medium-term adjustment programme in November 2010 the public finances each year have come in ahead of target. This has happened in spite of the fact that the rate of growth in the economy in 2011 and 2012 was lower than had been anticipated at the time the plan was drawn up. The ability to outperform on the public finances, while the economy was underperforming, reflected the conservative nature of the public finance assumptions in the original plan and in subsequent Budgets. As a result of the outperformance, credibility has been rebuilt, both domestically and externally. Following on the crucial statement by ECB President Mario Draghi in the summer of 2012, that the ECB would “do whatever it takes” to preserve the euro, the gain in credibility of Irish policy has also seen the risk premium on Irish borrowing fall dramatically so that it is well below the levels anticipated even a year ago. This has had knock-on benefits, enabling the sovereign to successfully return to financial markets for funding purposes, following on the end of the EU/IMF programme, and also reducing the cost of the new borrowing. Thus, in planning for 2015 it would be wise to maintain this policy and to allow for unpleasant surprises along the way.
Our estimate for 2013 is that general government borrowing was around 7 per cent of GDP. Based on our forecast for the economy in 2014 and on the assumptions set out in the Budget for this year, we anticipate that government borrowing will come in slightly below target in 2014 at 4.5 per cent of GDP (see Table 6).
cliff on the profits of the pharmaceutical sector. If the progress seen in the March exchequer returns was to be maintained throughout the year our current forecast fall in borrowing could prove unduly conservative.
TABLE 6 Public Finances
2013 2014 2014 2015 2015
€bn €bn % change €bn % change
Income
Taxes on income incl. Social insurance 28.7 30.4 5.9 31.6 4.1
Taxes on expenditure 18.7 19.6 4.8 20.2 2.9
Gross trading and investment income 3.4 3.0 -11.5 3.2 7.7
Other Income 3.4 3.3 -0.9 3.8 15.0
Total receipts : Current 54.1 56.3 4.0 58.9 4.5
Total receipts : Capital 1.1 1.1 -0.9 1.3 12.6
Total receipts - Current and Capital 55.3 57.4 3.9 60.1 4.7
Expenditure
Sudsidies 1.3 1.3 -1.5 1.3 -3.8
National debt interest 7.6 7.8 3.6 8.0 1.8
Transfer payments 26.9 26.4 -2.0 26.4 0.2
Expenditure on Goods and Services 26.4 26.0 -1.3 26.0 0.0
Total expenditure - Current 62.1 61.5 -1.0 61.7 0.2
Total expenditure - Capital 4.7 3.6 -22.6 3.4 -4.7
Total expenditure - Current and Capital 66.8 65.1 -2.5 65.1 0.0
General Govt. Balance -11.5 -7.7 -5.0
As % of GDP -7.0 -4.5 -2.8
Source: Department of Finance and ESRI Forecasts.
This Commentary sets out our first forecast for 2015. With two exceptions, we
have assumed indexation of the main tax and expenditure aggregates.11
The first exception involves an assumption that new water charges will bring in an additional €500 million from households and companies in 2015. Until Irish Water is set up as a fully capitalised self-financing entity these charges are included under government miscellaneous revenue in the national accounts. For national accounting purposes they are then netted off government consumption on the expenditure side of the national accounts. In turn, this is reflected in a fall in the price deflator for this aggregate.12
The second exception to the indexation rule is that we have assumed that, under the Haddington Road Agreement, there is no increase in public service pay rates in 2015, in spite of the fact that private sector pay rates are forecast to
11 The details of the indexation assumptions are set out in an Appendix to the Special Article in this Commentary on the
structural deficit.
rise by 1 per cent. We have also assumed a small volume fall in this aggregate, due to carryover effects from the cuts implemented this year.
The forecast for national debt interest in 2014 and 2015 is taken from our model of the dynamics of the national debt.
The indexation assumption is applied to government transfers so that all rates of transfer payment are assumed to be increased by 1 per cent in 2015. In estimating total expenditure on transfers we use our Demographic Model (Byrne, FitzGerald and Žnuderl, 2012) to take into account the effects of rising numbers of children and older people in increasing demand. However, the fall in the numbers unemployed in 2015 will more than offset these demographic pressures. The net result of these different assumptions is a forecast that transfers will increase by around 0.2 per cent in 2015.
In the case of tax revenue we assume that the average tax rate on all personal income remains unchanged in 2015, due to indexation of tax allowances and bands. We use the equations for indirect taxes from the HERMES model (Bergin
et al., 2013) to forecast VAT and excise taxes. The significant increase in new
dwellings forecast to be constructed in 2015 will also add to revenue from VAT.
7
The Labour Market
For the first quarter of 2014 the Irish labour market has continued to improve. Monthly reductions have continued for the Live Register, while current indicators
point to a broad-based expansion across many sectors and regions13. Annual
employment growth has been positive for the past five quarters, while unemployment has been reducing for the past six. The standardised unemployment rate has fallen by over three percentage points from its latest peak of 15.1 per cent in the first quarter of 2012. Employment grew by 2.4 per cent for the full year in 2013, representing the strongest annual growth rate since 2007.
For the past three quarters, the Quarterly National Household Survey (QNHS) has shown a larger increase in employment than the fall in unemployment. The labour force participation rate has been rising over the same period. Encouragingly, the vast majority of employment gains have been in full-time positions, and the number of underemployed part-time workers has decreased. The gains to employment have taken place despite an ongoing reduction in public-sector employment. For the full year in 2013, public-sector employment fell by 1.3 per cent, more than compensated by 3.2 per cent growth in positions for the private sector.
Analysis of annual data by age shows that the unemployment rate fell across all groups of the working-age population in 2013, with the exception of those aged 60-64 (as shown in Figure 8). However, the reduction in the unemployment rate for those aged 15-34 is accompanied by falling employment and participation rates. Large net emigration and increased educational participation may be important factors for this cohort. As discussed in a Box 1 in the previous
Commentary, the highest educational attainment of individuals who are
employed and in the labour force has been steadily increasing since the onset of the crisis. Despite a modest increase of just 9,400 in the overall labour force for the full year in 2013, the number with at least a third-level qualification increased by approximately 40,000. Given the recent trend, this year will see as many people in the labour market with third-level education as with Leaving Cert/PLCs.
13 A recent report by IrishJobs.ie reports 5 per cent annual growth of job advertisements for Quarter 1, 2014:
FIGURE 8 Unemployment Rates by Age
Source: Central Statistics Office, Quarterly National Household Survey.
Employment grew in 10 out of 14 NACE sectors in 2013. However, as discussed in the Winter 2013 Commentary, a caveat applies to the statistics for employment by sector due to adjustments to the sample of the QNHS. These adjustments were completed in the fourth quarter of 2013. The large growth in agriculture, forestry and fishing is thought to be particularly affected by this adjustments process, implying that the employment growth in other sectors is likely to be higher than what has been officially published. Accommodation and food services, and professional, scientific and technical activities also showed large increases. Taken together, these sectors added 41,000 jobs for 2013 compared to 2012. The four NACE sectors with declines were public administration and defence, administrative and support service activities, transportation and storage, and financial, insurance and real estate activities. These sectors combined accounted for a loss of 10,000 positions.
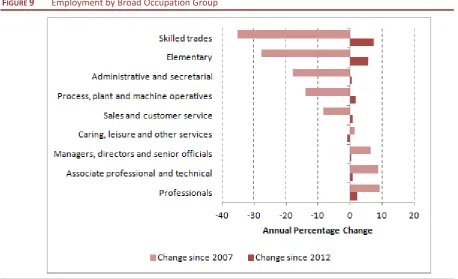
The occupational groups that have been most severely affected since 2007 have begun to recover in terms of employment levels. As shown in Figure 9, the largest growth in employment in 2013 was in skilled trades, where there was 7.2 per cent growth in employment (19,300 jobs). However, there are still 155,600 fewer people employed in skilled trades than in 2007. Elementary occupations (i.e., low-skill requirement positions) increased by 11,100 last year (5.6 per cent) and professional employment grew by 7,600 (2.2 per cent). The only group that did not experience an increase in employment was caring, leisure and other services. Employment in this occupation group has seen little change since 2007.
0 100 200 300 400 500 600
Total 15-24
(Youths) 25-34 35-44 45-54 55-59 60-64
Th
ou
sa
nd
s
FIGURE 9 Employment by Broad Occupation Group
Source: Central Statistics Office, Quarterly National Household Survey.
[image:36.595.70.529.76.355.2]