This is a repository copy of
Identification of aeroelastic forces and static drag coefficients
of a twin cable bridge stay from full-scale ambient vibration measurements
.
White Rose Research Online URL for this paper:
http://eprints.whiterose.ac.uk/80836/
Version: Accepted Version
Article:
Acampora, A, Macdonald, JHG, Georgakis, CT et al. (1 more author) (2014) Identification
of aeroelastic forces and static drag coefficients of a twin cable bridge stay from full-scale
ambient vibration measurements. Journal of Wind Engineering and Industrial
Aerodynamics, 124. 90 - 98. ISSN 0167-6105
https://doi.org/10.1016/j.jweia.2013.10.009
© 2013, Elsevier. Licensed under the Creative Commons
Attribution-NonCommercial-NoDerivatives 4.0 International
http://creativecommons.org/licenses/by-nc-nd/4.0/
[email protected] https://eprints.whiterose.ac.uk/
Reuse
Unless indicated otherwise, fulltext items are protected by copyright with all rights reserved. The copyright exception in section 29 of the Copyright, Designs and Patents Act 1988 allows the making of a single copy solely for the purpose of non-commercial research or private study within the limits of fair dealing. The publisher or other rights-holder may allow further reproduction and re-use of this version - refer to the White Rose Research Online record for this item. Where records identify the publisher as the copyright holder, users can verify any specific terms of use on the publisher’s website.
Takedown
If you consider content in White Rose Research Online to be in breach of UK law, please notify us by
Identification of aeroelastic forces and static drag coefficients of a twin stay
bridge cable from full-scale ambient vibration measurements
A. Acampora(a,d), J.H.G. Macdonald(b);C.T. Georgakis(a);N. Nikitas(c)
(a)Department of Civil Engineering, Technical University of Denmark, Building 118, Brovej, 2800 Kgs. Lyngby, Denmark (b)Department of Civil Engineering, University of Bristol, Bristol, UK.
(c)School of Civil Engineering, University of Leeds, Leeds, UK. (d)IPU product development, 2800 Kgs. Lyngby, Denmark
Abstract
Despite much research in recent years, large amplitude vibrations of inclined cables continue to be of concern for cable-stayed bridges. Various excitation mechanisms have been suggested, including rain-wind excitation, dry inclined cable galloping, high reduced velocity vortex shedding and excitation from the deck and/or towers. Although there have been many observations of large cable vibrations on bridges, there are relatively few cases of direct full-scale cable vibration and wind measurements, and most research has been based on wind tunnel tests and theoretical modelling.
This paper presents results from full-scale measurements on the special arrangement of twin cables adopted for the Øresund Bridge. The monitoring system records wind and weather conditions, as well as
accelerations of certain cables and a few locations on the deck and tower. Using theEigenvalue Realization Algorithm (ERA), the damping and stiffness matrices are identified for different vibration modes of the cables, with sufficient accuracy to identify changes in the total effective damping and stiffness matrices due to the aeroelastic forces acting on the cables. The damping matrices identified from the full-scale
measurements are compared with the theoretical damping matrices based on quasi-steady theory, using three different sets of wind tunnel measurements of static force coefficients on similar shaped twin or single cables, with good agreement. The damping terms are found to be dependent on Reynolds number rather than reduced velocity, indicating that Reynolds number governs the aeroelastic effects in these conditions. There is a significant drop in the aerodynamic damping in the critical Reynolds number range, which is believed to be related to the large amplitude cable vibrations observed on some bridges in dry conditions.
Finally, static drag coefficients are back-calculated from the full-scale vibration measurements, for first time, with reasonable agreement with direct wind tunnel measurements. The remaining discrepancies are believed to be due to the higher turbulence intensity on site than in the wind tunnel.
Keywords:twin cable, cable vibrations; dry inclined cable galloping; cable aerodynamics; system identification; ambient vibrations; full-scale measurements; aerodynamic damping; critical Reynolds number; quasi-steady theory
1. Introduction
Large amplitude wind-induced vibrations of inclined cables are common. Various mechanisms could be responsible, including von Kármán vortex shedding, rain-wind excitations, cable-deck-tower interaction, high reduced velocity vortex shedding and dry inclined cable galloping. The aerodynamic mechanisms acting on inclined cables are complicated by the three-dimensional environment and the fact that typical sized bridge cable stays in moderate to strong winds sit in the critical Reynolds number region, where there is a rapid drop in the drag coefficient and potentially changes in the lift coefficient (Larose & Zan 2001).
Despite many reports of large amplitude vibrations of cables on various bridges, there have been relatively few direct measurements of the behaviour at full scale and most of the research in this area has been based on wind tunnel tests (Matsumoto et al. 1990, Cheng et al. 2005, Flamand & Boujard 2009, Jakobsen et al. 2012, Nikitas et al. 2012). Excessive wind-induced vibrations of inclined cables were
measured with a long-term full-scale monitoring system by Zuo & Jones (2010) on the Fred Hartman Bridge. It was observed that the three-dimensional nature of the cable-wind environment inherently affects the mechanisms associated with the vibrations of inclined cables. Different types of cable vibrations were identified, including von Kármán vortex induced vibration, rain-wind induced vibration and large amplitude
*Manuscript
dry cable vibrations. Matsumoto et al. (2003) observed various vibrations of a 30 m long inclined test cable which were classified in a similar way. It has, however, been suggested that the mechanisms of rain-wind-induced vibrations and large amplitude dry cable vibrations may be similar (Macdonald & Larose 2008b, Flamand & Boujard 2009, Matsumoto et al. 2010).
Macdonald (2002) measured the aerodynamic damping of cables on the Second Severn Crossing, which was found to often be dominant over the structural damping, even in quite light winds for low frequency modes. The results from the full-scale measurements agreed well with the theoretical quasi-steady aerodynamic damping derived for single degree-of-freedom (1DOF) vibrations of inclined cables in skew winds in the sub-critical Reynolds number range. Later the theoretical framework was generalised to include variations of the static force coefficients with Reynolds number, fully considering the 3-dimensional
geometry and allowing for aeroelastic coupling in 2 degrees-of-freedom (2DOF) for in-plane and out-of-plane vibrations (Macdonald & Larose 2006, 2008a,b). Boujard & Grillaud (2007) measured both rain-wind induced vibrations and similar vibrations of dry cables during a 3-year measurement campaign on the Iroise Bridge, and for the dry case they compared the results with predicted instability regions based on the same 2DOF quasi-steady model and wind tunnel data on a static inclined model in the critical Reynolds number range.
On the Øresund Bridge, where a side by side twin cable arrangement is used for each stay, large amplitude cable vibrations have been reported, both in the presence of ice on the cables, believed to be caused by galloping, and in conditions significantly above freezing (Svensson et al. 2004). More recently a long-term monitoring system has been installed and vibrations under rain-wind conditions have been reported (Acampora & Georgakis, 2011). At the accelerometer positions, 20m from the lower end of the cables, filtering and numerical integration of the accelerations found the cable vibrations generally having amplitudes below 0.1 diameters. The relatively small amplitudes were believed to be due to the presence of different damping systems used to suppress previous events of larger amplitude reported after the opening of the bridge (Svensson et al. 2004). The maximum cable vibration amplitude was around 0.6 diameters, which occurred in association with rainfall, and the maximum amplitude without rain was about 0.4 diameters, which occurred for wind normal to the vertical cable plane with speeds between 5 and 15 m/s.
Most of the measurements of cable vibrations on full-scale bridges in the past have concentrated on the characteristics of the vibrations, the conditions under which they occur, and possibly their comparison with wind tunnel or theoretical predictions. The aim of this paper is to perform system identification on the full-scale cable vibration measurements to identify aeroelastic effects in terms of variations in the total stiffness and total damping matrices in relation to the wind velocity and hence Reynolds number. This is the first time that two-degree-of-freedom system identification has been attempted on such data and that dependence of the behaviour on Reynolds number has been identified on full-scale cables. Measured data were available for10-minute mean wind velocities up to 18m/s, corresponding to Reynolds numbers up to 3.0x10⁵. For simplicity the analysis is limited to the condition of wind normal to the cables in dry conditions. The results of the identified damping matrix are compared with theoretical aerodynamic values based on quasi-steady theory, using mean force coefficients measured in wind tunnel tests. Furthermore the static drag coefficient of the full-scale cables was back-calculated from the measured vibrations.
2. Description of the bridge and monitoring system
The current investigation is based on the data collected from monitoring of the Øresund Bridge. The cable-stayed bridge provides the main navigational span for an 8km bridge link from Denmark to Sweden. The bridge has a main span of 490m and an orientation of WNW to ESE. The deck carries both road and rail traffic and is supported by 4 independent pylons, 204m tall, and 80 twin cable stays, all with an inclination of
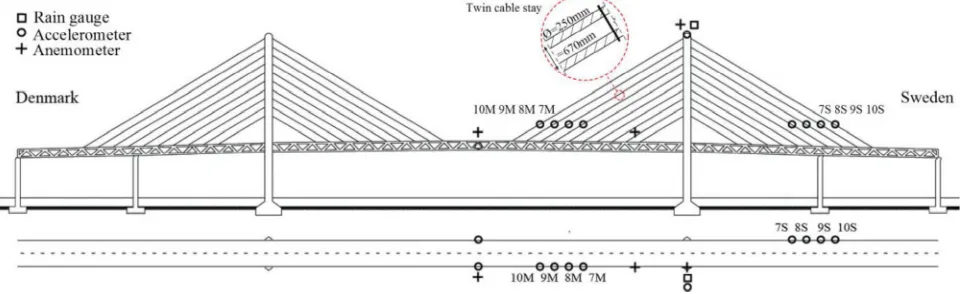
same outer diameter of 250mm and with double helical fillets on the surface (dimensions 2.1mm high x 3.0mm wide with a rounded top and pitch of 550mm). Similar multi-cable stays can be found in many cable stayed bridges and also in the hangers of suspension and arch bridges (Gimsing & Georgakis, 2012). Tuned mass dampers are installed on the first and second longest cable pairs (10M, 9M, 9S, 10S, Figure 1). The current monitoring system was installed in 2009. The instrument locations are shown in Figure 1. Various different configurations of accelerometers have been installed on the four longest twin cable stays in the main span (cable stays 10M, 9M, 8M, 7M) and side span (cable stays 10S, 9S, 8S, 7S) at the Swedish end of the bridge on the south and north side of the deck respectively. The accelerometers are oriented to record the components of the cable vibrations normal to the cable axis in the in-plane (i.e. in the vertical plane) and out-of-plane (i.e. lateral) directions. Ultrasonic anemometers are positioned at the top of the east pylon (on a 4m pole) and on the deck (on the south side on poles 7m above the deck) at mid-span and between cables pairs 1M and 2M, west of the pylon. A rain gauge is positioned close to the anemometer on the top of the pylon. Further data collected include atmospheric temperature, pressure and humidity. The monitoring system samples all channels at a frequency of 30Hz and saves files 10 min long, chosen to be consistent with the averaging period for mean wind speeds in Eurocode 1 (British Standards Institution, 2005). The twin cable stay studied in this paper is designated as 8M, and is the third longest stay in the main span (Figure 1), with length of 216m, mass per unit length of 99kg/m and first natural frequency of 0.56Hz. This cable was chosen since it is the longest one that does not have a tuned mass damper and will subsequently produce for a certain range of wind speeds the highest values of reduced wind speeds.
Figure 1.Elevation view of Øresund Bridge showing locations of instruments.
The data for this paper were collected continuously from October 2010 to August 2012. Records for dry conditions and wind directions within ±5° of normal to the vertical cable plane were selected, giving a total of 2101 10 min records (i.e. 4% of the total recording time) that have been analyzed herewith. No significant difference was found in the measurements or results between winds from the north or south sides of the bridge, so they have been treated together here. The wind speed was taken to be the mean of the measured wind speeds at the top of the pylon and on the deck at mid-span, which would be representative of the mean wind experienced by the cable (assuming a linear wind speed distribution, which is the only option for the two instruments in place). The largest differences recorded between the two anemometers were of the order of 20%. Records were grouped together in bins at 1 m/s intervals to enable averaging of results at each wind speed, from 0 to 18m/s, i.e. Reynolds numbers 0 to 3.0x10⁵at intervals of 1.67x10⁴. The distribution of records in each bin is shown Figure 2. Apart from the 0m/s bin (i.e. 0-0.5m/s), there were at least 27 records in each wind speed bin for the averaging. For wind speeds above 6 m/s (i.e. Re = 1.0x10⁵) the mean
longitudinal turbulence intensity (Iu) (as measured at the top of the tower, away from the influence of the bridge deck and passing traffic) was 3.8% and the mean longitudinal length scale (xL
Figure 2.Distribution of number of records vs. Reynolds number
3. System identification
The aim here is to identify the damping and stiffness matrices of the cable vibrations as a function of Reynolds number and to compare them with the theoretical values according to quasi-steady theory using wind tunnel data of the static force coefficients.
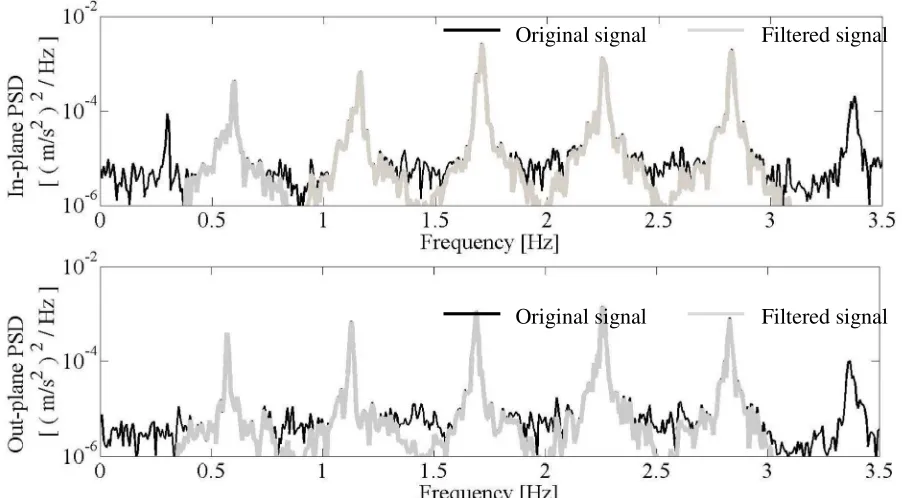
Figure 3.Typical PSDs of in-plane (top) and out-of-plane (bottom) accelerations for Cable 8M. Vibrations in the first five pairs of modes were isolated by filtering.
The Power Spectral Densities (PSDs) of measured accelerations in the two planes are shown for a typical record in Figure 3. The cables exhibit vibrations in multiple modes, which are almost a pure harmonic series, in accordance with taut string theory, and the accelerations measured on the cables, also contain components of global vibration modes of the whole bridge (e.g. the peak in the in-plane PSD at approx 0.3Hz in Figure 3 (top). The focus here is on the local cable vibrations and for simplicity one pair of modes (one mode in each plane with almost identical natural frequencies) is considered at a time. Macdonald & Larose (2008a) showed that, for a linear aerodynamic damping matrix (per unit length of cable), each pair of modes can be
Filtered signal Original signal
[image:5.595.69.520.359.608.2]considered independently. Therefore the raw accelerations were filtered with 15thorder high-pass and low-pass filters to isolate the vibrations of a single mode in each plane, taking care not to distort the signals for the modes in question themselves (Figure 3). In general the aeroelastic forces can couple the modes with virtually the same natural frequencies in the two planes, so the filtered signals are considered as the response of a 2 translation degree-of-freedom (2DOF) system. Since the measurements did not detect any rotation of the twin cables, any influence of this effect is neglected. The equations of motion of the 2DOF system (assumed to be linear) can be written in the following form:
Y X . . .. ..
F
F
M
Y
X
M
Y
X
M
Y
X
C
K
1
(1)
whereXandYare the generalised displacements of the out-of-plane and in-plane mode, respectively, dots represent derivatives with respect to time,Mis the generalised mass of the modes (assumed to be the same for vibrations in each plane), andFXandFYare the external generalised forces in the two planes due to wind (excluding aeroelastic effects) and cable end motion.Kis the total generalised stiffness matrix, given by the sum of the structural stiffness matrix,Ks, and the aerodynamic stiffness matrix,Ka:
a s
K
K
K
YY YX XY XXK
K
K
K
where 2 20
0
Y,i X,iM
M
sK
KScan potentially change due to changes in the tension of the cable, for example due to thermal effects or traffic loads.Cis the total generalised damping matrix, given by the sum of the structural,Cs, and
aerodynamic part,Ca:
a s
C
C
C
YY YX XY XXC
C
C
C
where Y,i Y,i X,i X,iM
M
2
0
0
2
sC
X,i and Y,i are respectively the circular natural frequencies of theithout-of-plane and in-plane modes of the cable (in the absence of wind), and X,iand Y,iare the corresponding structural damping ratios.
From output-only measurements alone it is not possible to identifyMand the matricesCandK
themselves, but it is possible to identifyC/MandK/Min Eq. (1). Also it is not possible to explicitly separate the structural and aerodynamic components from a single record, but the variation ofC/MandK/Mwith wind conditions can be identified from multiple records in different conditions. Restricting analysis to small amplitude oscillations can effectively discard any implications for non-constant structural damping and stiffness.
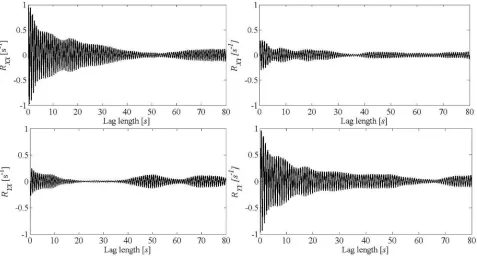
For each 10-min record (corresponding to at least 336 vibration cycles), the auto- and cross-covariance functions of the out-of-plane and in-plane filtered accelerations were computed. Examples are plotted in Figure 4, from a typical record with mean wind speed 7.1m/s (Re = 1.2x10⁵) andI
displacement and velocity, as in Eq. (1). The white noise assumption seems rational for the case in hand. There is no concentrated harmonic loading as in vortex shedding (i.e. see broad reduced wind speed range, helical fillets acting as vortex suppression measure and turbulent/non-smooth flow) and locally around the cable frequencies any colouring effect of the loading spectrum may be considered small.
Figure 4.Typical example of auto- and cross-covariance functions for the combined 2DOF system, for the second mode pair, plotted against time lag (from 10-min record with mean wind speed 7.1 m/s, i.e. Re = 1.2x10⁵).
An important parameter in the analysis is the choice of the maximum lag length of the covariance functions used (c.f. Figure 4). If too short, useful information is discarded, but if too long, random
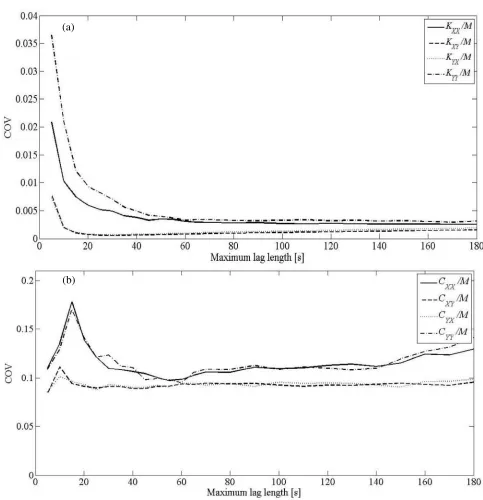
fluctuations are included and can increase the variance of the results. In the absence of any theoretical basis for the choice of the maximum lag length, it was aimed to minimise the variance of the outputs from statistical analysis of the results from a representative wind speed bin (6m/s, i.e. Re = 1.0x10⁵) for the modes of interest. For a whole series of different maximum lag lengths the system identification procedure was carried out on all records in the bin. For each maximum lag length the coefficient of variation (COV, i.e. standard deviation / mean) of each of the 8 extracted parameters (KXX/M, KXY/M, etc.,CXX/M, CXY/M, etc.) was computed. The results for the second mode pair are plotted against maximum lag length in Figure
5
. As can be seen, the COVs for the stiffness terms are much lower than for the damping terms, which is consistent with the well-known fact that natural frequencies can be identified quite accurately from ambient vibration measurements but that damping values are more difficult to identify reliably. The stiffness terms areThe system identification was performed on each selected record for the first five pairs of modes, after separately filtering the responses in each pair of modes. The average results for each wind speed bin for each mode are presented and discussed in Section 6.
Figure 5.Coefficient of variance of results as a function of maximum lag length included in the analysis, for the second mode pair. (a) for each element of the stiffness matrix; (b) for each element of the damping matrix.
4. Theoretical
aerodynamic damping matrix
For comparison with the results obtained from the full-scale measurements, theoretical values of the aerodynamic damping matrix were calculated. Based on the quasi-steady assumption that the aerodynamic forces on a moving cable are given by the forces on a stationary cable experiencing the same relative wind velocity, the generalised 2DOF aerodynamic damping matrix, allowing for three-dimensional geometry and
changes in the aerodynamic force coefficients with Reynolds number, was given by Macdonald & Larose (2008a) (assuming variations of the force coefficients are smooth functions and linearising for small cable velocity compared to the wind velocity). For a uniform cable in a uniform wind normal to the cable axis, the theoretical quasi-steady aerodynamic matrix normalized by mass simplifies to:
L D L L D L D D C C C C C C C C m M Re Re 2 Re Re 2 2 a C (2)
where is the density of air,Dis the reference dimension (cable diameter),Uthe wind speed,mthe mass per unit length,CDandCLrespectively the drag and lift coefficients, the angle of attack about the cable axis, and Re the Reynolds number (= , where is the absolute viscosity of air). In the case of angle of attack = 0 (i.e.Xalong-wind andYacross-wind and the wind velocity in the plane of symmetry), assuming thatCL,
Re L C and 0 D C
are zero for a symmetric section, the generalised damping matrix (2) simplifies
to: 0 0 0 Re Re 2 2 L D D D C C C C m M a C (3)
5. Wind tunnel measurement of static force coefficients
To obtain the drag and lift coefficients to use in the matrix (3), static wind tunnel tests were performed in the DTU/Force Technology 2 m x 2 m cross-section closed circuit Climatic Wind Tunnel in Kgs. Lyngby, Denmark. The wind tunnel has a maximum wind speed of 31 m/s and typical turbulence intensity of 0.64% for smooth flow. The other technical specifications of the wind tunnel were reported by Georgakis et al. (2009).
A sectional cable model was manufactured scaling the dimensions of the twin cables of the Øresund Bridge (full-scale diameter 250mm) by a factor of 2.2. This scale was chosen as a compromise considering the Reynolds number range of interest and the blockage ratio. The maximum Reynolds number achievable was then 2.3x10⁵and the blockage ratio was 8.5%, which is in accordance with blockage in previous aerodynamics studies on staggered smooth circular cylinder arrangements (see Table 1, Sumner et al. 2000). The double helical fillet, which is expected to govern the Reynolds transitional behaviour, was reproduced at scale using a steel wire attached with double-sided tape (full-scale fillet 2.1mm high x 3.0mm wide, helix angle 55°, pitch 550mm). The length of the model was 1490mm. The PVC surface was polished to match the scaled target surface roughness of the Øresund cables (made of HDPE). Measured values of the average surface roughness Ra of the model were in the range of 0.5- (much below the fillet thickness). The actual roughness of the bridge cables on site is 0.7-1 (Matteoni & Georgakis 2012). The model setup in the wind tunnel is seen in Figure 6.
The test programme consisted of wind velocity sweeps between 1 and 31m/s, corresponding to Reynolds numbers of 3x10⁴ 2.3x10⁵, based on a reference dimension of 1D(single diameter), for angles of attack = 0
°
and 30°
(Acampora & Georgakis 2011), where = 0°
is defined as wind normal to the plane containing the two cable axes, as seen in Figure 6.configuration was opted to avoiding the effects of leakage flow. End effects on a static model normal to the flow, where static force coefficients are measured are not expected to encompass the distorting features that were previously recorded for the dynamic models in Matsumoto et al. (2001) or Yagi et al. (2009). For example in the seminal work by Delany and Sorenson 1953, despite the leakage end flow the recovered drag evolution with Reynolds number seems undistorted. The mean force coefficients were found by averaging the measurements over 1 minute at each wind speed. The drag and lift coefficients are defined here on the basis of the total force on the twin cable setup and the reference dimension of 1D. Therefore, when both cables are exposed to the wind the drag and lift coefficients are expected to be approximately twice the value for a single cylinder. The drag coefficients from the wind tunnel test, corrected for blockage using the Maskell III method (Cooper et al. 1999) are shown in Figure 7 for = 0
°
. Note that the static forceFigure 6. Wind tunnel test setup with the force transducers placed on the top and bottom of the cable ensemble measuring the global twin cable forces.
[image:11.595.59.532.468.710.2]6. Results and discussion
The results of the system identification from the full-scale data give the modal properties of each pair of cable modes in terms of the stiffness and damping matrices for the coupled 2DOF system. The first five pairs of modes were considered. The outputs are presented as the mean results within each wind speed bin,
represented in terms of Reynolds number.
6.1 Identified stiffness matrices and natural frequencies
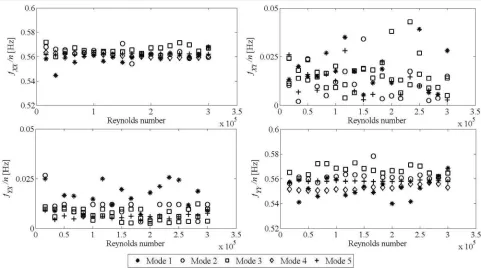
The identified elements of the total stiffness matrix for each of the first five mode pairs are shown in Figure 8. The diagonal terms show distinct values for the five modes, with little variation with Reynolds number. In all cases the off-diagonal terms of the total stiffness (or mass) matrix are virtually zero, indicating negligible stiffness coupling between out-of-plane and in-plane vibrations. These results are as expected since,
according to quasi-steady theory, there is no aerodynamic stiffness for translational vibrations, although there could be changes in cable tension, and hence the stiffness matrices, due to the static wind load on the
structure.
In order to compare the results between the modes in more detail, the values of stiffness matrix were converted to frequencies (e.g.
f
XXK
XX/
M
2
) and normalised by mode number,n, as shown in Figure 9. The diagonal terms then show very consistent results indicating natural frequencies in both planes of approximately 0.56 Hz, with variations of up to about 3%. There is no consistent variation with Reynolds number, indicating no significant aerodynamic stiffness effect. There are slight differences between the results for each mode, particularly in theY(vertical plane) direction, indicating that they are close to but not quite a pure harmonic series. This slight difference in the behaviour from that for a fixed-ended taut string is believed to be due to coupling with vibrations of the bridge deck and tower, so the ends are not fully fixed.The cross-terms were in all cases close to zero, with the magnitude in the variations comparable with the magnitude of the variations of the diagonal terms. Again there was no discernable aerodynamic effect and only marginal differences between the different modes.
Temperature was also considered as a possible cause of variations in the stiffness matrix, potentially due to changes in the cable tension. However, no significant differences in the stiffness matrix were found with temperature, for the measured air temperatures in the range -5°to +20°C. Varying traffic mass could
Figure 8.Identified total stiffness matrix for Cable 8M vs. Reynolds number for the first 5 pairs of modes
Figure 9. Identified total stiffness matrix for Cable 8M converted to frequencies and normalised by mode number vs. Reynolds number for the first 5 pairs of modes
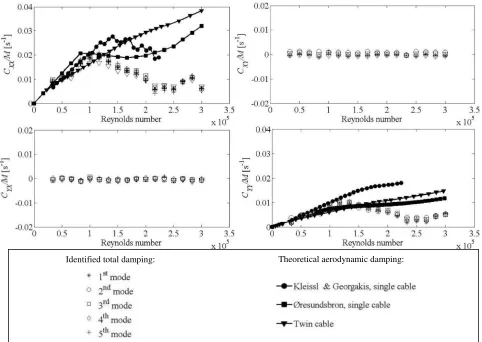
[image:13.595.57.538.404.675.2]The identified elements of the total damping matrix for each of the first five mode pairs are shown as discrete symbols in
Figure 10. Also shown, as points linked with lines, are the theoretical values for the diagonal terms,CXX/M andCYY/M, based on Eq. (3) using the static force coefficients obtained from the three different sets of wind tunnel tests. There are clear trends of the identified results with Reynolds number, indicating aerodynamic damping. The identified values are for the total damping matrix, including the structural damping, whereas the theoretical values are for the aerodynamic damping only. However, the trends of the identified values at low wind speeds indicate that the structural damping (i.e. the extrapolated value for zero wind speed) is negligible in relation to the aerodynamic damping.
The cross-terms of the damping matrix
,
C
XY/M
and
C
YX/M
,
are virtually zero in all cases. This indicates no aerodynamic damping coupling between vibrations in the two planes, in agreement with quasi-steady theory for the chosen wind direction (normal to the cable) (Eq. 3), although for other wind directions coupling is expected (Macdonald & Larose 2008a).The identified results from the five different modes are remarkably consistent. This not only gives more confidence in the results but also strongly indicates that the aerodynamic damping matrix is a function of the Reynolds number (simply proportional to wind speed) and not of the reduced wind velocity, which is the other commonly-used non-dimensional group based on the wind speed, but is inversely proportional to the frequency of vibration, which is very different for the five modes. For reference, the wind speed range 0 -18m/s (Re = 0 - 3.0x10⁵) corresponds to reduced velocities of 0 - 128 for the first mode down to 0 - 26 for the fifth mode.
The diagonal terms of the damping matrix show linear trends up to about Re = 1x10⁵(i.e. 6m/s at full scale). This implies that this can be
considered as the end of the sub-critical Reynolds number region.
This is in agreement with Simiu & Scanlan (1996) who state that for circular cylinders with a smooth surface if the wind is not turbulent, the sub-critical Reynolds number region corresponds to a range of 0 to about 2 x 10⁵, but if the wind is turbulent or if the cable surface is rough, the upper bound of the subcritical region will be lower. Recent investigations indicated that for a smooth-surfaced cylinder, with a wind turbulence
intensity of 2.6% in the wind tunnel, the upper bound of the sub-critical region occurs for a Reynolds number of about 1.6 x 10⁵(Zasso et al. 2005). Similarly, a critical Reynolds number of 1.5 x 10⁵is estimated for a single smooth circular cylinder (i.e. without fillets) with two-dimensional flow, based on the empirical equations provided by ESDU (1986), using the mean values of the longitudinal turbulence intensity and length scale estimated from the site measurements for wind speeds above 6m/s (Section 2).
In the sub-critical range, the identified results agree very well with the theoretical results from quasi-steady theory for all three sets of wind tunnel data used, for vibrations in both planes. This is consistent with the measurements on the cables of the Second Severn Crossing (single smooth circular cables) in the sub-critical Reynolds number range, where the damping (of in-plane modes only) was measured by free-decay tests rather than ambient vibrations, agreeing well with quasi-steady theory (Macdonald 2002).
For Reynolds numbers above 1.2x10⁵the diagonal terms of the damping matrices show a reduction, due to effects in the critical Reynolds number range. The theoretical and experimental values differ in this region, although, as stated, the actual geometry of the cables on the bridge is slightly different than in the previous wind tunnel tests (Øresundsbron 2003, Kleissl & Georgakis 2011). Nevertheless, qualitatively the full-scale and theoretical results show similar features. Based on the twin cable wind tunnel data, the theoretical results forCXX/Mcontinue a linear trend up to about Re = 1.4x10⁵, after which there is a drop in the aerodynamic damping, corresponding with the drop in the measured drag coefficient (Figure 7). The quantitative difference from the full-scale data could be explained by different turbulence characteristics causing the critical Reynolds number to be lower in the natural wind on site than in the wind tunnel.
the cable in these conditions, in line with the observation of no large amplitude vibrations. However, this drop in damping is believed to be related to the large amplitude vibrations of dry cables observed on some bridges in some conditions. Such large amplitude vibrations have been observed in large scale dynamic wind tunnel tests, in which it was also identified that they are related to effects in the Reynolds number range and that the aerodynamic forcing causing the instability appears to act as negative aerodynamic damping (Jakobsen et al. 2012, Nikitas et al. 2012).
Figure 10.Damping matrix for cable 8M vs. Reynolds number for the first 5 pairs of modes from system identification from full-scale data, together with theoretical quasi-steady values from Eq. (3) using force coefficients from 3 different sets of wind tunnel tests.
7. Back-calculation of static drag coefficient from full-scale vibration data
Having identified the damping matrix values from the full-scale measurements and having shown that quasi-steady theory seems to give reasonable results, it was possible to back-calculate the static drag coefficient of the actual twin cable on the bridge from the full-scale vibration data. From Eq. (3), based on quasi-steady theory (Macdonald & Larose 2008a), and neglecting the structural damping, the relationship between the CXX/Mterm of the damping matrix and the drag coefficient and Reynolds number can be expressed as:
DU
m
M
C
C
XXD
2
Re
Re
d
d
Re
1
2 (4)i.e.
m M C
C XX
D
2 Re
Re d
d 2
(5)
Hence, noting thatCDRe2= 0 for Re = 0, the drag coefficient can be back-calculated from the values of CXX/Midentified from the full-scale data, as:
Re
0
2
d
Re
Re
2
M
C
m
C
XXD (6)
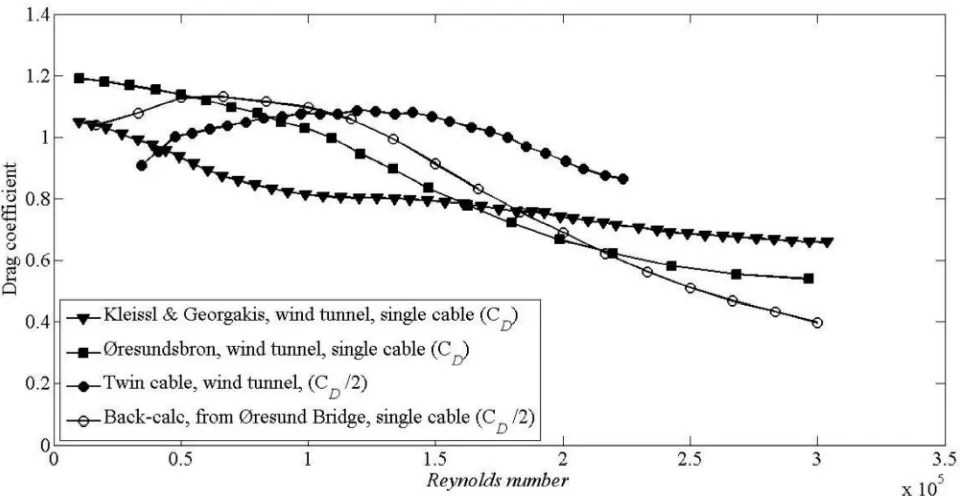
[image:16.595.58.538.290.538.2]Given that the identified values ofCXX/Mwere very consistent for the five different modes, the mean value from the five modes at each Reynolds number was used in the calculations. The results of the back-calculated drag coefficient from the Øresund Bridge cable are shown in Figure 11, along with the values directly measured in the three different sets of static wind tunnel tests.
Figure 11. Comparison of the back-calculated mean drag coefficient from the Øresund Bridge cable vibrations with the values obtained directly from static wind tunnel tests.
The back-calculated drag coefficient agrees well with the direct measurements from the wind tunnel tests. In particular, the shape of the curve and the maximum value agree very well with the wind tunnel results for the twin cable with the same geometry (Section 5). The curve from the full-scale vibration measurements is shifted to lower Reynolds numbers relative to the wind tunnel measurements, but this discrepancy could well be accounted for by the greater turbulence intensity on site causing a drop in the critical Reynolds number (ESDU 1986).
8. Conclusions
The stiffness matrix shows near constant values for the range of wind velocities and temperatures
experienced, indicating no discernable aerodynamic effect and only minor changes in cable tension, possibly due to variable traffic loading .The damping matrix for this wind direction is diagonal and, based on the very consistent results from all five mode pairs, has been shown to be a function of Reynolds number rather than reduced velocity. This is a significant result that demonstrates that within the critical Reynolds number range, the Reynolds number itself is the dominant non-dimensional parameter in the fluid-structure
interaction. Hence, aerodynamic instabilities of dry cables in strong winds are very likely to be governed by critical Reynolds number effects.
The damping values identified from the full-scale data agree well with the theoretical aerodynamic damping matrix based on quasi-steady theory. In particular, up to about 6 m/s (Re = 1.0 x 10⁵), which is believed to be the end of the sub-critical Reynolds number region, there is excellent agreement. For higher Reynolds numbers the quantitative results differ, but qualitatively they exhibit similar features, with a relative drop in the total damping for both in-plane and out-of-plane vibrations, believed to be due to critical Reynolds number effects. Hence it seems that quasi-steady theory gives a reasonable description of the actual behaviour. The minimum damping in each plane occurs at about Re = 2.4 x 10⁵(14m/s) from the site measurements. The total damping remains positive, hence there was no dynamic instability of the cable in the conditions considered, but the large vibrations of some cables on some bridges in strong winds in dry conditions are believed to be related to the drop in the total damping identified.
The quantitative difference in the damping matrix between the identified values and the quasi-steady theoretical values may be because of the higher turbulence intensity on site..The real cable also experiences variable wind velocity along its length.
The identified values of damping matrix have been used to back-calculate the drag coefficient of the Øresund twin cable, assuming quasi-steady theory applies. It is believed that this is the first time that static force coefficients have been estimated from full-scale vibrations measurements. The back-calculated values show good agreement with the directly measured drag coefficients from wind tunnel tests, except that the full-scale results are shifted to lower Reynolds numbers relative to the results for the twin cable model, which is believed to be likely due to the greater wind turbulence on site. A further similar study on other bridges and more cable stays can unveil more on-site aerodynamic characteristics of this type of stay.
Acknowledgments
The authors would like to thank Femern A/S and Storebælt A/S for their financial support, without which this work would not have been possible, and Øresundsbron for their help with installing the monitoring system. They would also like to thank Jasna Jakobsen, University of Stavanger, for the system identification routines.
References
Acampora A -wind induced cable
rdam.
-cable vibrations: confrontation of full-scale measurements and quasi-steady analysis of
wind- stralia, 1-6 July, pp. 927-934.
British Standards Institution, 2005, Eurocode 1: Actions on structures Part 1-4; General actions Wind actions. EN 1991-1-4:2005 Cheng S., Larose G.L., Savage M.G., Tanaka H., 2003, Aerodynamic behaviour o Wind Struct., 6,
197-208.
Cooper, E. Mercker, J. Wiedemann, 1999, "Improved blockage corrections for bluff bodies in closed and open wind tunnels", Proc. 10th Int. Conf. Wind Engineering, Copenhagen, Denmark, pp. 1627-1634.
-cylinder galloping and rain- th Euro.
Afr. Conf. Wind Engineering, Florence, Italy.
Georgakis, C.T., Koss, H.H., Ricciardelli, F., 2009. Design specifications for a novel climatic wind tunnel for testing of structural cables Cable Dynamics, Paris, pp. 333-340.
Jakobsen J.B., Hjorth- a Wind Eng. Ind. Aerodyn., 57, 295-305.
Jakobsen J.B., Andersen T.L., Macdonald J.H.G., Nikitas N., Larose G.L., Savage M.G., McAuliffe B.R., Wind-induced response and excitation characteristics of an inclined cable in the critical Reynolds number range , J. Wind Eng. Ind. Aerodyn., 110, 100-112.
Gimsing N. J., Georgakis C.T., 2012, Cable Supported Bridges: Concept and Design. John Wiley & Sons Inc; 3rdedition, 2012.
Kleissl K., Georgakis C.T., 2012 Comparison of the aerodynamics of bridge cables with helical fillets and a pattern-indented surface J. Wind Eng. Ind. Aerodyn. 104 106 (2012) 166 175.
Larose G. L., Smitt L. W., 1999, Rain/wind induced vibrations of the parallel stay cables for the Öresund High Bridge , IABSE Conference - Cable-stayed bridges. Past, present and future, Malmö, 2-4 June, 301-311
-stayed bridges in the critical Rey Proc. 4th Int. Symp. Cable Dynamics, Montreal, 28-30 May, pp. 77 84.
i Wind Eng. Ind. Aerodyn., 90, 19 39.
Macdonald J.H.G., Larose G.L., 2006, A unified approach to aerodynamic damping and drag/lift instabilities, and its application to , J. Fluids and Structures, 22, 229-252.
Macdonald J.H.G., Larose G.L., 2008a, -degree-of-freedom inclined cable galloping - Part 1: General formulation and solution 307.
Macdonald J.H.G., Larose G.L., 2008b, Two-degree-of-freedom inclined cable galloping - Part 2: Analysis and prevention for , J. Wind Eng. Ind. Aerodyn., 96, 308 326.
Matsumoto M.,
circular cylinders cable aerodynamics J. Wind Eng. Ind. Aerodyn. 33, 63-72.
-induced cable vibration of cable-stayed bridges at high reduced -8), 633-647
-induced cable vibrations using
large- ring, Lubbock, USA, 2-5 June, pp. 2149-2156.
Matsumoto M., Yagi T., Hatsuda H., Shima T., Tanaka M., Naito H., 2010, Dry galloping characteristics and its mechanism of J. Wind Eng. Ind. Aerodyn. 98, 317 327.
Matteoni G., Georgakis C.T. Effects of bridge cable surface roughness and cross-sectional distortion on aerodynamic force coefficients J. Wind Eng. Ind. Aerodyn. 104 106, 176 187.
-scale ambient vibration
measurements of the Cli -238.
Nikitas N., Macdonald J.H.G., Jakobsen J.B., Andersen T.L. Critical Reynolds number and galloping instabilities Experiments on circular cylinders , Expts. Fluids, 52, 1295 1306.
Øresundsbron, 2003, Cable oscillations: Diagnosis, future actions. Internal report. Simiu E., Scanlan, R.H., 1996, Wind effects on structures, Wiley, New York.
-pattern identification for two staggered circular cylinders in cross-Fluid Mech., 411, 263-303
Cable system Vibration incidents, mechanisms and rence, Copenhagen, 16-19 June, pp. 99 108.
- m
10-13 May, pp. 213 233.
orces on inclined cable in consideration of end conditions
ughness on stays of