ISSN 02528266
^ X çfg/SS
EUROSTATISTIK
Daten zur Konjunkturanalyse
EUROSTATISTICS
Data for shortterm economic analysis
EUROSTATISTIQUES
ΕΞ
eurostat
STATISTISCHES A M T DER EUROPÄISCHEN GEMEINSCHAFTEN
STATISTICAL OFFICE OF THE EUROPEAN COMMUNITIES
OFFICE STATISTIQUE DES COMMUNAUTÉS EUROPÉENNES
L2920 Luxembourg — Tél. 43011, Télex : Comeur Lu 3423
EUROSTATISTIK
Daten zur Konjunkturanalyse
EUROSTATISTICS
Data for short-term economic analysis
EUROSTATISTIQUES
Données pour l'analyse de la conjoncture
Luxembourg : Office des publications officielles des Communautés européennes. 1 983
Kat./cat.: CA-BJ-83-007-008-3A-C
Inhaltswiedergabe nur mit Quellennachweis gestattet
Hinweis
Die Veröffentlichung Eurostatistik — Daten zur Konjunkturanalyse ist
eine von drei Schlüsselveröffentlichungen des Eurostat, die dem Leser
einen Überblick über die wichtigsten quantitativen Daten geben sollen,
die für die Gemeinschaft und die Mitgliedstaaten zur Verfügung stehen.
Die anderen Veröffentlichungen in dieser Reihe sind Statistische
Grundzahlen mit Daten für ein bestimmtes Jahr sowie Eurostat-Revue
mit einem Zehnjahresüberblick über die Gemeinschaft in Zahlen.
Eine monatliche Veröffentlichung mit laufenden Wirtschaftsdaten muß
ständig angepaßt und auf den neuesten Stand gebracht werden. Zu
Beginn des Jahres 1982 wurde mit der Einbeziehung von Daten für
Griechenland und der Abwandlung der Aufmachung eine bedeutende
Änderung vorgenommen. Im Laufe des Jahres 1982 werden nach und
nach Gesamtzahlen für die 10 Mitgliedstaaten der Gemeinschaft
aufgenommen. Sobald genügend Daten zur Verfügung stehen, wird das
Basisjahr 19 75, das die Grundlage für diese Veröffentlichung bildet,
durch das Jahr 1980 ersetzt werden. Zu einem späteren Zeitpunkt ist
vorgesehen. Daten für die beiden beitrittswilligen Länder Portugal und
Spanien sowie für die Vereinigten Staaten und Japan hinzuzufügen.
Es werden vier Arten von Daten in Eurostatistik veröffentlicht. Auf den
Seiten 5 und 6 findet sich ein Artikel .Kurz notiert", der sich mit den
jüngsten Tendenzen bei den verfügbaren Daten befaßt. Die Seiten 15
bis 20 enthalten eine schematische Darstellung der wichtigsten
wirtschaftlichen Reihen für die Gemeinschaft und die Mitgliedstaaten.
Die Seite 23 ist die erste von 56 Seiten mit .Gemeinschaftstabellen".
Dieser Abschnitt enthält von Eurostat auf der Grundlage von
Gemeinschaftskriterien harmonisierte Daten. Die neuesten Daten sind
vorläufig und in einigen Fällen von Eurostat geschätzt. Schließlich
enthält die Veröffentlichung noch einen Abschnitt . Ländertabellen ". der
eine Auswahl der in jedem Land am häufigsten verwendeten
Konjunkturindikatoren enthält. Hierbei handelt es sich um nationale
Reihen auf der Grundlage nationaler Definitionen. Zu Vergleichszwecken
ist auch eine Tabelle für die Vereinigten Staaten enthalten.
In allen Fällen stehen auf Anfrage Zeitreihen über die Cronos-Datenbank
des Eurostat zur Verfügung. Es werden außerdem statistische Bulletins
über Arbeitslosigkeit, Preise, industrielle Produktion, Zahlungsbilanzen,
Außenhandel und Energie monatlich oder vierteljährlich veröffentlicht. In
Eurostatistik selbst ist ein absolutes Minimum an Erläuterungen zur
Methodik enthalten. Ausführliche Informationen über Definitionen und
Methodik sind bei Eurostat erhältlich.
Eurostatistik wird am Ende eines jeden Monats in einer gemeinsamen
Ausgabe für Deutsch. Englisch und Französisch veröffentlicht. Darüber
hinaus steht auf Anfrage eine Ergänzung mit Übersetzung der Titel und
der Erläuterungen ins Dänische, Griechische, Italienische und
Inhaltsverzeichnis
Zeichen und Abkürzungen
Seite
.Kurz notiert"
Schaubilder
GEMEINSCHAFTSTABELLEN
1 . Volkswirtschaftliche
Gesamtrechnungen
ESVG
Veränderung des Volumens
Veränderung der Preise
2 . Beschäftigung
Bevölkerung
Beschäftigung
3. Arbeitslosigkeit
4. Indizes der industriellen Produktion
Industrie, Baugewerbe
Erzeugung nach Kategorien
Erzeugung nach Produktionsbereichen
Konjunkturempfindliche Bereiche
5. Meinungsumfrage in der Industrie (1j
6. Produktionsstatistik
Industrieerzeugnisse
Landwirtschaftliche Erzeugnisse
7. Außenhandel
Hauptindikatoren
Handel mit Drittländern
Innergemeinschaftlicher Handel
Handel nach Ländern
8. Preise
Indizes der Verbraucherpreise
Indizes der Erzeugerpreise
Indizes der Löhne und Gehälter in der Industrie .
9. Finanzstatistik
Wechselkurse
Wichtigste Finanzstatistiken
1 0 . Zahlungsbilanz
Wichtigste Salden
LÄNDERTABELLEN
Belgique/België
Danmark
BR Deutschland
ΕΛΛΑΔΑ
France
Ireland
Italia
Luxembourg
Nederland
United Kingdom
United States
5
15
21
23
23
2 4
0
14
6
+
8
%,T4/T0
"/.,T12/T
25
25
26
28
31
31
32
33
35
3 /
41
41
45
46
46
49
55
61
65
65
68
69
/O
70
7?
74
/ 4
79
85
86
87
8 8
89
90
91
92
93
94
95
·/., SALDO
*
1975=100
EUR 9 = 100
EUR 10=100
MIO
MRD
Τ
TROEE
GWH
M3
DM
FF
UT HFL
BFR
LFR
UKL
IRL
DKR
USD
ECU
SZR
EG
Eurostat
EUR 9
EUR 10
UEBL/BLEU
ACP
ESVG
NACE
SITC
Nichts
Weniger als die Hälfte der verwendeten Einheit
Kein Nachweis vorhanden
Von 1 bis 4
6 und 8
Prozent
Prozentualer Zuwachs eines Vierteljahres
gegenüber dem entsprechenden Vierteljahr des
Vorjahres
Prozentualer Zuwachs eines Monats gegenüber
dem entsprechenden Monat des Vorjahres
Saldo zwischen den positiven Antworten
(Zunahme, Verbesserung der Situation) und den
negativen Antworten (Abnahme.
Verschlechterung der Situation) der
Konjunkturbefragung bei den Unternehmern in
der Gemeinschaft
Saisonbereinigt (Ländertabellen)
Basisjahr
Prozentuale Angaben im Verhältnis zur
Gemeinschaft der 9 ( = 1 00)
Prozentuale Angaben im Verhältnis zur
Gemeinschaft der 1 0 ( = 1 00)
Million
Milliarde
Metrische Tonne
Tonne Rohöleinheiten
Gigawattstunde = 1 0
6kWh
Kubikmeter
Deutsche Mark
Französischer Franc
Italienische Lira
Holländischer Gulden
Belgischer Franc
Luxemburgischer Franc
Pfund Sterling
Irisches Pfund
Dänische Krone
USDollar
Europäische Währungseinheit
Sonderziehungsrechte
Europäische Gemeinschaft[en]
Statistisches Amt der Europäischen
Gemeinschaften
Gesamtheit der Mitgliedsländer der
Europäischen Gemeinschaften bis 1 9 8 0
Gesamtheit der Mitgliedsländer der
Europäischen Gemeinschaften ab 1 981
Belgischluxemburgische Wirtschaftsunion
Länder Afrikas, der Karibik und des Pazifiks —
Abkommen von Lome
Europäisches System Volkswirtschaftlicher
Gesamtrechnungen
Allgemeine Systematik der Wirtschaftszweige in
den Europäischen Gemeinschaften
Eurostatistiken : Kurz notiert
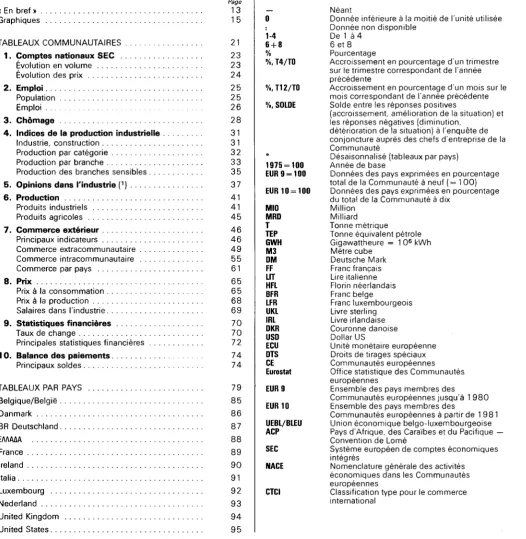
1. Arbeitslosigkeit — die berichtigten Zahlen deuten auf
eine Stabilisierung hin
Ende Juni 1983 gab es 11,4 Millionen bei den staatlichen
Arbeitsämtern der Neuner-Gemeinschaft eingeschriebene
Arbeitslose. Somit beträgt die Arbeitslosenquote 1 0 , 2 % der
zivilen Erwerbspersonen.
Wie in den beiden Vormonaten ist der Rückgang der
einge-schriebenen Arbeitslosen in der Neuner-Gemeinschaft um
0 , 8 % teilweise auf saisonale Faktoren zurückzuführen. Die
saisonbereinigten Arbeitslosenzahlen weisen insgesamt in den
letzten drei Monaten kaum Veränderungen auf. Es sind
Auzei-chen für einen leichten zahlenmässigen Rückgang der
Männer-arbeitslosigkeit vorhanden, während die Zahl der weiblichen
Arbeitslosen wiederum leicht gestiegen ist.
Ende Juni 1983 gab es in der Neuner-Gemeinschaft 4,3
Millionen Arbeitslose unter 25 Jahren, das entspricht 3 7 . 6 %
aller Arbeitslosen. Währendjedoch die Zahl der Arbeitslosen
unter 25 Jahren in den meisten anderen Mitgliedstaaten
gegenüber dem Vormonat stabil blieb oder gar fiel, stieg die
Zahl der jungen Arbeitslosen in den Niederlanden infolge der
Einschreibung der ersten Schulabgänger bei den staatlichen
Arbeitsämtern abrupt an.
Auch in Irland ist bei dieser Gruppe eine leichte Zunahme zu
erkennen. Im Vereinigten Königreich würden die Zahlen für
Arbeitslose unter 25 Jahren vermutlich ebenfalls ansteigen,
wenn die Schulabgänger zu den Arbeitslosen gezählt würden.
Nach ersten Schätzungen dürfte die Zahl der Schulabgänger in
der Gemeinschaft der Neun in diesem Jahr nicht höher sein als
im letzten (knapp über 4 Mio), sie könnte infolge leicht
abneh-mender Bevölkerungszahlen in den entsprechenden Jahrgängen
und durch Verlängerung des Schulbesuchs sogar etwas
niedri-ger liegen.
2. Verbraucherpreisindex — Juni 1 9 8 3
Zwischen Mai und Juni stieg der Verbraucherpreisindex der
Gemeinschaft um 0.4%, das entspricht einem
Zwölfmonatsmit-tel von 8,2%. Die Inflationsrate liegt damit wieder auf dem
Stand vor der zweiten Oelkrise.
Die Bundesrepublik Deutschland und die Niederlande
verzeich-nen gegenwärtig mit 2 , 4 % sehr niedrige Inflationsraten, gefolgt
vom Vereinigten Königreich mit 3.7%. In Belgien und
Däne-mark ging die Inflation auf 7.3%. in Luxemburg auf 7,6%
zurück. Die französische Inflationsrate liegt bei 8,8%. d.h. 5%
inter der ?????? von vor einem Jahr. Auch in Irland, wo die
Preise zwischen mittel Februar und mittel Mai 1983 um nur
2 , 7 % stiegen, fiel die Jahresrate auf eine einstellige Zahl
(9,2%). Aus Italien (15,5%) und Griechenland (19,1%)
wer-den ebenfalls ???kene Inflationsrate gemeldet, obwohl diese
Zahlen noch weit über denen der anderen Mitgliedstaaten
liegen.
Die beiden Beitrittskandidaten Spanien und Portugal
verzeich-nen Inflationsraten von 1 1,7% bzw 21,3%. In Amerika beträgt
die Inflationsrate 3,5%. in Japan 1.9%.
3. Die Industrieproduktion im Mai 1 9 8 3
Der vorläufige Gemeinschaftsindex (EUR 10) betrug im Mai
1983 114,9, das entspricht einem Rückgang gegenüber Mai
1 982 um 2,4%.
Saisonbereinigt belief sich der EUR-10-lndex auf 111,4, das
entspricht einem Zuwachs von 0 , 7 % gegenüber April 1983
bzw. um 0 . 5 % gegenüber den ersten vier Monaten des Jahres.
Der Aufschwung in der gesamten Gemeinschaft hält sich
dem-nach immer noch in Grenzen.
Ein Trendindikator (Gegenüberstellung der letzten drei Monate
und der vorhergehenden drei Monate) zeigt für EUR 10 einen
geringen Zuwachs um 0.2%. Für die USA ergibt dieser
Indika-tor einen Anstieg um 4 , 0 % , was klar auf einen Aufschwung
hindeutet. In der Gemeinschaft kann nur in der BR Deutschland
(Trendindikator: + 2 % ) , den Niederlanden und Dänemark von
einem klaren Aufschwung die Rede sein. Im Vereinigten
König-reich erholte sich die Konjunktur geringfügig, während die
industrielle Produktion Frankreichs seit Ende 1 982 einen
leich-ten Anstieg verzeichnete. Für Italien zeigt der Trendindikator
jedoch einen Rückgang von 3,5% an. In diesem Land liegt der
Index für Mai 1983 um 6,4% unter dem Niveau vom Mai
1982.
4. Eisen und Stahl
Die Rohstahlerzeugung der Gemeinschaft (ohne Griechenland)
¡st im Juni 1 983 gegenüber dem Vormonat — saisonbereinigt
— um 1,3% auf 9,4 Mio.t angestiegen. Das
Produktionsergeb-nis des 1. Halbjahres 1983 liegt um 1 3 . 5 % unter dem
Ergebnis des entsprechenden Vorjahreszeitraums (im 1.
Viertel-jahr 1 983 lag der Rückgang gegenüber dem 1. Vj. 1 982 noch
bei - 1 7 , 3 % ) .
Die Auftragseingänge für Massenstahl sind mit 6.5 Mio.t im
April 1 983 verglichen mit dem Vormonat um — saisonbereinigt
— 1 4 . 6 % zurückgegangen und bleiben auch um 4 . 1 % unter
dem vergleichbaren Vorjahresniveau. Dabei war der Rückgang
auf dem Drittländermarkt stärker ausgeprägt als auf dem
Bin-nenmarkt der Gemeinschaft.
Die Einfuhren aus Drittländern haben sich im 1. Vierteljahr
1983 gegenüber dem gleichen Vorjahreszeitraum um 2 2 . 1 %
verringert, während die Ausfuhren nach Drittländern fast auf
dem gleichen Stand blieben (— 1 %).
5. Energie — Die kohlenwirtschaft im 1. quartal 1983
Berichtsvierteljahr gleichkommt. Negative Einflüsse waren beim
Beschäftigungsstand zu verzeichnen, wo sich die Zahl der
ange-legten Arbeiter unter Tage um 4 OOO verringert hat.
6. EG-Aussenhandel
In den ersten vier Monaten dieses Jahres hielt sich die
Gemein-schaftsausfuhr nach Drittländern auf der Ebene der einzelnen
Mitgliedsländer gegenüber dem vergleichbaren Zeitraum 1 982
in etwa auf dem gleichen Stand. Belgien und Luxemburg
( + 1 8 % ) sowie Irland ( + 1 7 % ) schnitten in diesem Zeitraum
am besten ab, während das Vereinigte Königreich ( — 9%) und
Griechenland ( — 6%) weniger in den aussergemeinschaftlichen
Bereich exportierten als im Vorjahr. Bei den großen Kategorien
von Erzeugnissen fielen die Ergebnisse unterschiedlich aus. Die
SITC-Abteilungen 6 und 7 (nach Ausgangsmaterial klassifizierte
Fertig waren, Maschinen, Beförderungsmittel), auf die im Jahre
1 982 5 8 % der EG-Ausfuhr entfiel, verzeichneten gegenüber
dem Zeitraum Januar-April 1 982 einen Rückgang um 3%. Auf
der anderen Seite erfuhren die SITC-Abteilungen 5 und 8
(chemische Erzeugnisse, verschiedene Waren), auf die 1 982
2 0 % der Ausfuhr entfielen, eine Steigerung um 6%. Die
Energieausfuhr erhöhte sich um 9%, während sie 1982 nur
6 % der Gesamtausfuhr ausmachte. Bei allen übrigen
Ausfuhr-kategorien war ein Rückgang festzustellen.
Die Einfuhr aus Drittländern ging in den ersten vier Monaten
1 983 um 3 % zurück, während für April im Vergleich zum April
1982 ein Rückgang um 7% ausgewiesen wird. Nur Irland
steigerte seine Einfuhren in den ersten vier Monaten des Jahres
1 983. Das Handelsdefizit der Gemeinschaft nimmt weiterhin
ab, obwohl lediglich Deutschland durchwegs
Handelsüber-schüsse mit Nicht-EG-Ländern erzielt.
7. EG-Binnenhandel
Notice
Eurostatistics — data for short-term economic analysis is one of three
key Eurostat publications designed to give the reader an overview of the
most important quantitative information available for the Community and
Member States. The other publications in this series are Basic Statistics
giving data for a specific year, and Eurostat review with its summary of
the Community in figures over the past 10 years.
A monthly publication with current economic data must be continually
adapted and updated. At the beginning of 1982 a major modification
took place with the inclusion of data for Greece and a change in
presentation. Totals for the 10-member Community are being
progressively introduced in 1982. Once sufficient data are available,
the base year 1975 which is fundamental to this publication will be
replaced with 1980. At a later stage it is planned to add data for the
two applicant countries, Portugal and Spain, as well as for the United
States and Japan.
Four kinds of information are published in Eurostatistics. Pages 9 and
10 offer an article 'In brief' which looks at the latest trends in the data
available. Pages 15 to 20 provide the reader with a visual presentation
of the most important economic series for the Community and the
Member States. Starting on page 23 there are 56 pages of 'Community
tables'. This section contains data harmonized by Eurostat on the basis
of common criteria. The most recent data are provisional and in some
cases estimated by Eurostat. Finally there is a section 'Tables by
country' which contains a selection of economic indicators most often
used in each country. These are national series based on national
definitions. For comparison a table for the United States is also
included.
For all series, historical data are available on request from Eurostats
data bank Cronos. Statistical bulletins on unemployment, prices,
industrial production, balance of payments, external trade and energy
are also published monthly or quarterly. Eurostatistics itself contains an
absolute minimum of methodological notes. Detailed information on
definitions and methodology may be obtained from Eurostat.
Contents
Symbols and abbreviations
'In brief'
Graphics
COMMUNITY TABLES
1
.
National accounts ESA
Volume
Price
2. Employment
Population
Employment
3. Unemployment
4. Index of industrial production
Industry, construction
Production by category
Production by branch
Branches in difficulty
5. Opinions in industry 1
6. Output
Industrial products
Agricultural products
7. External trade
Main indicators
ExtraCommunity trade
IntraCommunity trade
Trade by country
8. Prices
Consumer prices
Producer prices
Wages and salaries in industry .
9. Financial statistics
Exchange rates
Main financial statistics
10. Balance of payments
Main balances
TABLES BY COUNTRY
Belgique/België
Danmark
BR Deutschland
ΕΛΛΑΔΑ
France
Ireland
Italia
Luxembourg
Nederland
United Kingdom
United States
9
15
21
23
23
2 4
25
25
26
28
31
31
3 2
33
35
37
41
41
45
4 6
4 6
4 9
5b
61
65
65
68
69
70
70
72
74
74
79
85
86
87
88
89
90
91
92
93
94
95
—
0
14
6
+
8
%
%,T4/T0
%.T12/T0
%, BALANCE
fi
1975 = 100 EUR 9 = 100
EUR 10 = 100
MIO
MRD
Τ
TOE
GWH M3
DM
FF
LIT
HFL
BFR LFR
UKL
IRL
DKR
USD
ECU SDR
EC
Eurostat EUR 9
EUR 10
UEBL/BLEU
ACP
ESA
NACE
SITC
Nil
Data less than half the unit used No data available
from 1 to 4
6 and 8
Per cent
Percentage increase on the corresponding
quarter of the previous year
Percentage increase on the corresponding
month of the previous year
Balance between positive replies (increase,
improvement in the situation) and negative
replies (reduction, worsening of the situation) in
the shorttermtrends enquiry conducted among
heads of enterprises in the Community
Seasonally adjusted (Tables by country)
Reference year
Data for countries expressed as a percentage of
the Community of 9 total
Data for countries expressed as a percentage of
the Community of 1 0 total
Million
Thousand million
Tonne
Tonne of oil equivalent
Gigawatt hour ( = 1 0
6kWh)
Cubic metre
Deutschmark
French franc
Italian lira
Dutch guilder
Belgian franc
Luxembourg franc
Pound sterling
Irish pound
Danish crown
US dollar
European currency unit
Special Drawing Right
European Communities
Statistical Office of the European Communities
Total of the member countries of the EC until
1 9 8 0
Total of the member countries of the EC from
1981
BelgoLuxembourg Economic Union
African, Caribbean and Pacific countries of the
Lomé Convention
European System of Integrated Economic
Accounts
Eurostatistics: In Brief
1. Unemployment — adjusted figures show stabilisation
At the end of June 1 983. there were 1 1,4 million persons
registered as unemployed at the public employment offices in
the Community of the Nine. This represents an unemployment
rate of 1 0 , 2 % of the civilian working population.
As in the previous two months, the fall of 0 , 8 % in the number
of persons registered as unemployed in the Community of the
Nine was due partly to seasonal factors. The
seasonally-adjusted figures for unemployment as a whole show hardly any
change over the past three months. There are signs of a slight
reduction in the figure for men. whereas the number of
unem-ployed women has again risen slightly.
At the end of June 1983. there were 4,3 million unemployed
under 25 years of age in the Community of the Nine, which is
equivalent to 3 7 , 6 % of all unemployed. However, although the
number of unemployed under 25 years of age in most other
Member States remained stable or fell once again compared
with the previous month, the number of young unemployed in
the Netherlands rose sharply as a result of the registration of
the first school-leavers at public employment offices. A slight
increase in this group is also evident in Ireland. If the
school-leavers were included in the number of unemployed, the figures
for unemployed under 25 yers of age in the United Kingdom
would probably also increase.
According to initial estimates, the number of school-leavers in
the Community of the Nine this year will not be higher than last
year (just over 4 million), and may even be lower as a result of
a slight decrease in the population figures for the groups
concerned and the tendency towards periods of school
atten-dance.
2. Consumer Price Index — June 1 9 8 3
The consumer price index for the Community rose 0 . 4 %
bet-ween May and June which means that the twelve month
average is at 8.2%. Inflation is thus back to its level before the
second "oil crisis".
Germany and the Netherlands now have a very low rate of
increase with 2 . 4 % followed closely by the UK at 3.7%.
Belgium and Denmark are down to 7.3% and Luxembourg is at
7.6%. The French rate is at 8.8%, five points down from the
equivalent figure a year ago. A deceleration was also recorded
in Ireland where prices rose by only 2 . 7 % between
mid-Febru-ary and mid-May 1983 bringing the annual rate to single
figures at 9.2%. A slow down is also reported in Italy (1 5.5%)
and Greece (19.1 %) though these inflation rates are well above
those for other member states.
The two candidate countries Spain and Portugal show rates of
1 1.7% and 2 1 . 3 % respectively. The American inflation rate is
at 3 . 5 % and the Japanese at 1.9%.
3. Industrial Production in May 1 9 8 3
The provisional index for the Community (EUR 10) in May
1983 comes to 1 14.9 which corresponds to a fall of 2 . 4 %
compared with May 1 982.
After adjustement for seasonal factors, the EUR 10 index is at
1 1 1.4 i.e. an increase of 0 . 7 % compared with April 1 983, or
0 . 5 % when compared with the first four months of the year. At
Community level, therefore, the upturn is still limited.
A trend indicator (last three months compared to the preceding
three months) shows a small increase for EUR 10 of 0.2%. The
same indicator for the USA give a rise of 4 . 0 % which signifies
a very clear upturn. In the Community it is only possible to
speak of a clear upturn in Germany (trend indicator up 2%), the
Netherlands and Denmark. There is a small upturn in the United
Kingdom and industrial production in France has increased
slightly since the end of 1 982. However, the trend indicator for
Italy shows a drop of 3.5%. In Italy, the index for May 1 983 is
6 . 4 % down at the level reported in May 1 982.
4. Iron and Steel
In June 1983 production of crude steel for the Community (ex
Greece), at 9.4 mio.t.. showed a deseasonalized increase of
1.3% compared with May 1983. Taking the 1st six months of
1 983 the figure reached is 1 3.5% down on the 1 st six months
of 1982. (1st quarter 1983 compared with 1st quarter 1982:
- 1 7 . 3 % ) .
At 6.5. mio.t.. new orders (ordinary steels) in April 1983
suffered a drop of 1 4 . 6 % (deseasonalized) compared with the
previous month. The fall was more marked on the third
coun-tries' market than on the intra-Community market — their level
is 4.1 % below that of April 1 982.
It is noteworthy that in the 1 st quarter of 1 983 imports from
third countries declined by 2 2 . 1 % compared with the 1st
quarter of 1 9 8 2 , whereas exports to third countries remained at
nearly the same level (— 1 %).
5. Energy — the Coal Sector in the first quarter of 1983
Trends in the coal economy in the first quarter of 1983
confirmed the sector's sluggishness and lack of buoyancy
recorded in the past few years. Despite a marked downturn in
production, which was two million tonnes down on the same
period in 1982, stocks continued to build up at the pitheads.
At the end of March, these stocks stood at 54 million tonnes
(over half Germany's annual production), 4,5 million tonnes (a
figure roughly equivalent to France's total output during the
reference period) more than in December 1982. There were
also adverse effects on employment and the underground
workforce fell by 4 0 0 0 .
6. Extra-EC Trade
period of 1982. Of the individual member countries Belgium
and Luxembourg ( + 1 8 % ) and Ireland ( + 1 7 % ) have had the
best export performance in this period, whilst the United
King-dom ( — 9%) and Greece ( — 6%) had lower extra-EC exports
than last year. The major categories of products showed a
mixed performance SITC sections 6 and 7 (manufactured goods
classified by material, machines, transport equipment), which
accounted for 5 8 % of EC exports in 1 982, were 3 % down
compared with January-April 1982. On the other hand SITC
sections 5 and 8 (chemicals, miscellaneous manufactured
pro-ducts) which represented 2 0 % of 1982 exports, were up by
6%. Energy exports were up by 9%, though these accounted
for only 6 % of exports in 1982. The other export categories all
showed declines.
Imports from third countries were 3 % down in the first four
months of 1 983, whilst April exhibited a 7% decline compared
with April 1982. Only Ireland increased its imports in the first
four months of 1983. The Community's trade deficit continues
to fall, though only Germany consistently runs a trade surplus
with non-EC countries.
7. Intra-EC Trade
Intra-EC imports rose 5 % in the first four months of 1983
(compared with January-April 1982). Most member countries
had increases near this figure, the exception being Ireland,
which cut imports by 8 %. An analysis by product indicates that
raw materials and fuels rose fastest ( + 9%) followed by
chemi-cals and manufactured products (around + 7 % ) . whilst food,
drink and tobacco showed no change.
Avertissement
Eurostatistiques — données pour l'analyse de la conjoncture
est l'une
des trois publications clés d'Eurostat, destinées à donner au lecteur un
aperçu des informations quantitatives les plus importantes disponibles
concernant la Communauté et les États membres. Les autres
publications de cette série sont les
Statistiques de base
fournissant des
données pour une année spécifique déterminée et la
Revue de
Γ Eu rostat
qui passe en revue dix ans de la Communauté sous forme de
tableaux chiffrés.
Une publication mensuelle contenant des données économiques
conjoncturelles d'actualité doit être continuellement adaptée et mise à
jour. Au début de 1982, une modification importante est intervenue
avec l'inclusion de données concernant la Grèce et un changement de
présentation. Des totaux pour la Communauté de dix membres seront
progressivement introduits en 1982. Lorsque l'on disposera de
données en nombre suffisant, l'année 1975 — année de référence
pour cette publication — sera remplacée par 1980. Il est prévu
ultérieurement d'ajouter les données concernant les deux pays
candidats à l'adhésion — à savoir l'Espagne et le Portugal
—
ainsi que
pour les ÉtatsUnis et le Japon.
Eurostatistiques
publie quatre types d'informations. Les pages 13 et 14
contiennent un article « En bref » dans lequel les dernières tendances
pouvant être dégagées à partir des données disponibles sont
examinées. Les pages 15 à 20 fournissent au lecteur une présentation
visuelle des séries économiques les plus importantes pour la
Communauté et les États membres. Des « tableaux communautaires »
sont présentés sur 56 pages à partir de la page 23. Cette section
contient des données harmonisées par Eurostat sur la base de critères
communs. Les données les plus récentes sont provisoires et, dans
certains cas, estimées par Eurostat. Enfin, la section « tableaux par
pays » contient une sélection des indicateurs économiques les plus
souvent utilisés dans chaque pays. Ce sont des séries nationales
fondées sur des définitions nationales. A des fins de comparaison, un
tableau concernant les ÉtatsUnis est également inclus.
Pour toutes les séries, des données historiques sont disponibles sur
demande auprès de la banque de données d'Eurostat, CRONOS. Les
bulletins statistiques sur le chômage, les prix, la production industrielle,
la balance des paiements, le commerce extérieur et l'énergie sont
également publiés sur une base mensuelle ou trimestrielle. En soi,
Eurostatistiques
contient un minimum de notes méthodologiques. Une
information détaillée concernant les définitions et la méthodologie
peutêtre obtenue auprès d'Eurostat.
Table des matières
Signes et abréviations
« En bref » Graphiques
T A B L E A U X C O M M U N A U T A I R E S
1. C o m p t e s n a t i o n a u x S E C Évolution en v o l u m e Évolution des prix
2 . Emploi Population Emploi
3 . C h ô m a g e
4 . Indices d e la production industrielle Industrie, construction
Production par catégorie Production par branche
Production des branches sensibles . . .
5 . Opinions d a n s l'industrie (1) 6 . Production
Produits industriels Produits agricoles
7 . C o m m e r c e e x t é r i e u r Principaux indicateurs
C o m m e r c e e x t r a c o m m u n a u t a i r e C o m m e r c e i n t r a c o m m u n a u t a i r e C o m m e r c e par pays
8 . Prix
Prix à la c o n s o m m a t i o n Prix à la p r o d u c t i o n Salaires dans l'industrie
9 . S t a t i s t i q u e s financières Taux de change
Principales statistiques financières . . .
1 0 . Balance des p a i e m e n t s Principaux soldes
T A B L E A U X PAR PAYS
B e l g i q u e / B e l g i ë
D a n m a r k
BR Deutschland
ΕΛΛΑΔΑ
France
Ireland
Italia
L u x e m b o u r g
N e d e r l a n d
U n i t e d K i n g d o m
U n i t e d States
Page
13
15
21
23
23
2 4
25
25
26
28
31
31
3 2
33
35
37
41
41
45
46
4 6
4 9
55
61
65
65
68
69
7 0
7 0
72
74
74
79
85
86
87
88
89
9 0
91
92
93
9 4
95
—
0
14
6 + 8
%
%, T4/T0
%,T12/T0
%, SOLDE
#
1975 = 100 EUR 9 = 100
EUR 10 = 100
MIO
MRD
Τ TEP
GWH
M3
DM
FF
UT HFL
BFR
LFR
UKL
IRL
DKR USD
ECU
DTS
CE
Eurostat
EUR 9
EUR 10
UEBL/BLEU
ACP
SEC
NACE
CTCI
Néant
Donnée inférieure à la moitié de l'unité utilisée
Donnée non disponible
De 1 à 4
6 et 8
Pourcentage
Accroissement en pourcentage d'un trimestre
sur le trimestre correspondant de l'année
précédente
Accroissement en pourcentage d'un mois sur le
mois correspondant de l'année précédente
Solde entre les réponses positives
(accroissement, amélioration de la situation) et
les réponses négatives (diminution.
détérioration de la situation) à l'enquête de
conjoncture auprès des chefs d'entreprise de la
Communauté
Désaisonnalisé (tableaux par pays)
Année de base
Données des pays exprimées en pourcentage
total de la Communauté à neuf ( = 1 00)
Données des pays exprimées en pourcentage
du total de la Communauté à dix
Million
Milliard
Tonne métrique
Tonne équivalent pétrole
Gigawattheure = 1 0
6kWh
Mètre cube
Deutsche Mark
Franc français
Lire italienne
Florin néerlandais
Franc belge
Franc luxembourgeois
Livre sterling
Livre irlandaise
Couronne danoise
Dollar US
Unité monétaire européenne
Droits de tirages spéciaux
Communautés européennes
Office statistique des Communautés
européennes
Ensemble des pays membres des
Communautés européennes jusqu'à 1 9 8 0
Ensemble des pays membres des
Communautés européennes à partir de 1 981
Union économique belgoluxembourgeoise
Pays d'Afrique, des Caraïbes et du Pacifique —
Convention de Lomé
Système européen de comptes économiques
intégrés
Nomenclature générale des activités
économiques dans les Communautés
européennes
[image:14.595.49.576.205.745.2]Eurostatistiques : En bref
1. Chômage
bilisation
chiffres désaisonnalisés indiquent une
sta-A la fin du mois de juin 1 983. le nombre de chômeurs inscrits
auprès des bureaux de placement dans la Communauté des
Neuf était de 1 1,4 millions, ce qui correspond à un taux de
chômage de 1 0 , 2 % de la population active civile.
Comme pour les deux mois précédents, le recul de 0 , 8 % du
nombre de chômeurs enregistrés dans la Communauté des
Neuf est partiellement dû à l'effet saisonnier. Les chiffres
corrigés des variations saisonnières ne révèlent guère de
varia-tions du chômage total au cours des trois derniers mois. Chez
les hommes, le chômage semble vouloir diminuer légèrement,
tandis que le chômage féminin a de nouveau tendance à
augmenter quelque peu.
Fin juin 1 983, la Communauté des Neuf comptait 4,3 millions
de chômeurs âgés de moins de 25 ans, soit 3 7 . 6 % du nombre
total de chômeurs. Alors que le nombre de chômeurs de moins
de 25 ans a diminué ou est resté inchangé par rapport au mois
précédent dans la plupart des États membres, les Pays-Bas ont
vu le nombre de leurs jeunes chômeurs augmenter du fait de
l'inscription auprès des bureaux de placement des premières
personnes parvenues à la fin de leur scolarité. En Irlande, on
note également un léger accroissement dans ce groupe. Si les
statistiques du chômage du Royaume-Uni prenaient en compte
les personnes arrivées au terme de leur scolarité, on y
enregis-trerait un phénomène analogue.
Selon des premières estimations, le nombre de personnes
arrivant à la fin de leur scolarité dans la Communauté des Neuf
ne sera pas plus élevé cette année qu'en 1 982 (où il était d'un
peu plus de 4 millions). En raison de la légère diminution des
populations appartenant aux classes d'âge concernées et de
l'augmentation de leur scolarisation, le chiffre pourrait même
être légèrement inférieur à celui de l'année dernière.
2. L'indice des prix à la consommation en juin 1983
L'indice des prix à la consommation pour la Communauté a
augmenté de 0 . 4 % entre mai et juin ce qui met la moyenne sur
douze mois à 8,2%. L'inflation se retrouve donc à son niveau
d'avant la deuxième « crise du pétrole ».
L'Allemagne et les Pays-Bas connaissent maintenant un très bas
taux annuel d'inflation de 2,4% suivi de près par le
Royaume-Uni à 3,7%. La Belgique et le Danemark sont descendus à
7.3% et le Luxembourg est à 7,6%. Le taux français est à
8,8%, en baisse de 5 points par rapport au taux équivalent d'il
y a un an. Une décélération a été enregistrée également en
Irlande où les prix ont augmenté de seulement 2 , 7 % entre la
mi-février et la mi-mai 1983 ramenant ainsi le taux annuel à
9,2%. Un ralentissement est signalé également en Italie
(15.5%) et en Grèce (19,1%) quoique les taux d'inflation de
ces deux derniers se trouvent nettement au-dessus des taux des
autres pays membres.
Les deux pays candidats, l'Espagne et le Portugal, connaissent
des taux de 1 1,7% et 2 1 , 3 % respectivement. Le taux
d'infla-tion américain est de 3,5% et celui du Japon est de 1,9%.
3. L'indice de la production industrielle en mai 1 9 8 3
L'indice provisoire pour la Communauté (EUR 10) du mois de
mai 1 983 s'établit à 1 1 4,9 ce qui correspond à une baisse de
2 , 4 % par rapport au mois de mai 1 982.
Après correction des variations saisonnières, l'indice EUR 10
est au niveau 111,4 c'est-à-dire en hausse de 0 , 7 % par
rapport au niveau d'avril 1983 ou encore en hausse de 0,5%
par rapport aux quatre premiers mois de l'année. Au niveau de
la Communauté la reprise est donc encore limitée.
L'indicateur de tendance (rapport des trois derniers mois aux
trois mois précédents) indique une légère hausse de 0 . 2 % pour
EUR 10. Ce même indicateur pour les États-Unis indique une
hausse de 4 % ce qui correspond à une reprise manifeste. Pour
les pays de la Communauté il ne semble possible de parler de
reprise manifeste de la production industrielle que pour la FR
d'Allemagne (dont l'indicateur de tendance est en hausse de
2%), les Pays-Bas et le Danemark. Il y aurait une certaine
reprise au Royaume-Uni et la production industrielle en France
a légèrement augmenté depuis la fin de 1982. Par contre,
l'indicateur de tendance pour l'Italie est en baisse de 3,5%.
Pour ce dernier pays le niveau de l'indice de mai 1 983 est
inférieur de 6,4% par rapport au niveau de l'indice du mois de
mai 1982.
4. Acier
En juin 1983, la production communautaire d'acier brut (sans
la Grèce) a, avec 9,4 mio.t., enregistré une augmentation
désaisonnalisée de 1,3% par rapport à mai 1983. Le bilan du
1
e rsemestre 1983 se solde par une diminution de 13,5% par
rapport au 1
e rsemestre 1982. ( 1
e rtrimestre 1983 comparé au
1
e rtrimestre 1982 : - 1 7 , 3 % ) .
Les commandes nouvelles (aciers courants) ont en avril 1983,
avec 6.5 mio.t.. subi une baisse de 1 4 , 6 % (désaisonnalisée)
par rapport au mois précédent. La baisse a été plus forte sur le
marché avec les pays tiers que sur le marché
¡ntra-communau-taire — leur niveau est inférieur de 4,1 % à celui d'avril 1982.
A noter qu'au 1
e rtrimestre 1983, les importations en
prove-nance des pays tiers ont diminué de 2 2 . 1 % par rapport au 1
e rtrimestre 1982, alors que les exportations vers les pays tiers
sont restées presque au même niveau (— 1 %).
5. Énergie — L'activité charbonnière au cours du premier
trimestre 1 983
française pendant la période considérée). On observe
égale-ment des répercussions négatives sur le plan de l'emploi qui se
traduisent par une diminution de 4 0 0 0 emplois au fond.
6. Commerce extra-communautaire
Les exportations communautaires vers des pays tiers des quatre
premiers mois de cette année ont peu changé par rapport au
niveau de la même période en 1 9 8 2 . Parmi les pays membres.
Belgique-Luxembourg ( + 1 8 % ) et Irlande ( + 1 7 % ) ont eu les
meilleurs résultats tandis que le Royaume-Uni ( — 9%) et la
Grèce ( — 6%) avaient exporté moins que l'année précédente
vers des pays tiers. Les grandes classes de produits ont connu
des résultats divers. Les secteurs CTCI 6-7 (articles
manufactu-rés, machines et matériel de transport) qui ont couvert 5 8 %
des exportations communautaires en 1 982 avaient diminué de
3 % par rapport à janvier-avril 1 982. Néanmoins les secteurs 5
et 8 (produits chimiques et articles manufacturés divers) qui ont
couvert 2 0 % des exportations en 1982, avaient augmenté de
6%. Les produits énergétiques étaient en hausse de 9 %
quoiqu'ils ne couvraient que 6 % des exportations en 1 982. Les
autres catégories ont connu des baisses.
Les importations des pays tiers avaient diminué de 3 % durant
les mois de janvier-avril entre 1982 et 1983, tandis qu'avril a
enregistré une baisse de 7% par rapport au même mois de
1 982. L'Irlande seule a augmenté ses importations dans cette
période. Le déficit commercial de la Communauté diminue
toujours bien que seule l'Allemagne connaisse un excédent
commercial soutenu avec des pays tiers.
7. Commerce intracommunautaire
Les importations intra-communautaitres ont augmenté de 5%
entre les premiers quatre mois de 1 983 et la même période de
1 9 8 2 . La plupart des pays se trouvent près de cette moyenne à
l'exception de l'Irlande qui avait diminué ses importations de
8%. Une analyse par produit démontre que les matières
premiè-res et les produits énergétiques ont augmenté le plus
rapide-ment (9%), suivis des produits chimiques et des articles
manu-facturés (7%) tandis que les produits alimentaires, boissons et
tabac sont restés inchangés.
R E G I S T R D
ARBEITSLOSIGKEIT
INSGESAMT
INSGESAMT/SAISONBEREINIGT MAENNER/SAISONBEREINIGT FRAUEN/SAISONBEREINIGT
REGISTERED UNEHPLOΥΠΕΝΤ
EUR 10 nio
TOTAL
TOTAL/SEASONALLY ADJUSTED MEN/SEASONALLÏ ADJUSTED WOMEN/SEASONALLÏ ADJUSTED
CHOriAGE ENREGISTRE
TOTAL
TOTAL/DESAISONNALISE HOMMES/DESA ISONNALI SE FEMMES/DESA ISONNALI SE
1 9 1 9
1 9 8 0
1 9 8 1
"1982
1 9 8 3
INDUSTRIELLE PRODUKTION
TENDENZ EUR 10
INDUSTRIAL PRODUCTION
TREND EUR 10 1915=100
PRODUCTION INDUSTRIELLE
TENDANCE EUR 10
INDUSTRIE NACE 1-4 INDUSTRY NACE 1-Ζ GRUNDST. U= PRODUKTIONSGUETER INTERMEDIATE GOODS INI/EST ITI ONSGUETER INUESTMENT GOODS
UERBRAUCHSGUETER CONSUMPTION GOODS
INDUSTRIE NACE 1-4 BIENS INTERMEDIAIRES BIENS D'INVESTISSEMENT BIENS DE CONSOMMATION
150 _
140
130
120 _ .
110 _
100
150
140
130
120
_ 110
90 I ' ' Ι ι ' l ' ' l
1 9 1 9
90
nEINUNGSUnFRAGE
OPINIONS
OPINIONS
IN DER INDUSTRIE (NACE 2 4 ) * SALDO
50 40 30 20 10 O -10 -20 -30 -40 -50 -SO
10
IN INDUSTRY (NACE 2-4) x BALANCE
EUR 10
DANS L'INDUSTRIE (NACE 2-4) x SOLDE
PRODUKTIONSAUSSICHTEN AUFTRAGSBESTAND LAGERBESTAENDE AN
FERTIGERZEUGNISSEN
PRODUCTION EXPECTATIONS PERSPECTIVES DE PRODUCTION
ORDER BOOKS CARNETS DE COMMANDES
STOCKS OF FINISHED PRODUCTS STOCKS DE PRODUITS FINIS
1919
1980
1981
1982
1983
AUSSENHANDEL
SAISONBEREINIGT
EINFUHR EXTRA-EG AUSFUHR EXTRA-EG
EXTERNAL TRADE
SEASONALLY ADJUSTED
EUR 10 MRD ECU
IMPORTS EXTRA-EC EXPORTS EXTRA-EC
COPinERCE EXTERIEUR
DESA I SONNALI SE
IMPORTS EXTRA-CE EXPORTS EXTRA-CE 30 _
28
28
24 _
22
18
16
14
26 24 22
WERBRAUCHERPREISE
UERAENDERUNG
CONSUriER PRICES
VARIATION χ T12/TO
EUR 10
PRIX A LA CONSOCIATION
VARIATION
£
Ι ι ■ I ■ ■ I I ■ ■ I ■ ■ I I ■ ■ I . ■ I I I I 1 I ! I ι : ι ι L15
14
13
1 1
I ■ ■ I ■ ■ I
J
1 9 1 9
1 9 8 0
1 9 8 1
1 9 8 2
1 9 8 3
WECHSELKURSE
EXCHANGE RATES
TAUX DE CHANGE
1 ECU = 1 ECU =
SZR USD
1 ECU = . ° . SDR 1 ECU = . . . USD
1 ECU = . . . DTS 1 ECU = . . . USD
I ■ ■ I ■ ■ I
1 9 1 9
I I ! I I I 1
1 9 8 0
I 1 I I 1 I I
1 9 8 1
I . . I ■ ι I
1 9 8 2
1.5
I I . I I I I
1 9 8 3
1.3
1.2
3500
3000
2500
150
600
500
400
300
250
200
Π 5
150
125
100
15
50
40
30
25
REGΙSTR. ARBEITSLOSIGKEIT
SAISONBEREINIGT
REGISTERED UNEHPLOïnENT
SEASONALLY ADJUSTED 1 000
CHOnAGE ENREGISTRE
DESAISONNALISE
D
■MH++HM+++++ + + + + + + + + ■UK
NL
IRL
DK
GR
+ ++ +++ +++ +*+ '
■++++++++V***
* * + + + + + + + + .
1
«•t.***
,*""
» * ♦ * * '
v^*
,x*
. + + + ■ + + + + + + + . „ . ,
. . ♦ * * * *
3500
3000
2500
2000
1150
1500
1250
150
600
300
250
200
115
150
125
100
_ 15
_ 30
_ 25
150
140
130
120
110
100 _
INDUSTRIELLE PRODUKTION
TENDENZ NACE 1-4
D
INDUSTRIAL PRODUCTION
TREND NACE 1-4 1915=100
+++++++++++++++
EUR 10
PRODUCTION INDUSTRIELLE
TENDANCE NACE 1-4
««--« UK
N i l
J i I I 1 I I I I I I I I I ! 1 I I i L l ■ . I ι . ■ ι,» * * ** ♦*
J I I I I t
I ! ! I
_ 140
J I i I I I I I L _ 120
_ 110
100
90
1 9 1 9
1 9 8 0
1 9 8 1
1 9 8 2
1 9 8 3
150
140
130
110
100
90
INDUSTRIELLE PRODUKTION
INDUSTRIAL PRODUCTION
PRODUCTION INDUSTRIELLE
TENDENZ NACE 14 TREND NACE 14 TENDANCE NACE 14
1915=100
„ , „ „ , „ „ „ .
ML,
*** *** *** ***
B
*** *** ♦*+ *** L
******** **
IRL
********
DK
********
£R
EUR 10
/ * * * · . » " " ' " · . ,
' *,
,^—7*—" *** t *** '"'
>
******** ^* '*
1 1 1 1 1 1 1 1 1 1 1
*****.*
,*τ***ί*+» V V V , «" "kV, ***"* * T > r
-\
ι ι I ι ι Ι ι ι I M
. ♦ ♦ ■ > * * " '* " " " * * * * * "
* * »
.* ** "** ".
, 1 1 1 1 1 1 1 1 1 !
+ + *+ ++ * " *
. " * · " " " * * ♦ · * * , * " *
X * * * *
"v,
\
* *++ * * * * * * K* "
\
ι ι I ι ι I ι ι 1 r 't.*****
.*****"
„„«
.1" , I ι ι I ι ι 1
1
_ 150
_ 130
_ 120
_ 100
120
VERBRAUCHERPREISE
GESAMTINDEX
D
CONSUMER PRICES
GENERAL INDEX 1915=100
+++++++++++++++
EUR 10
PRIX A LA CONSOCIATION
INDICE GENERAL + + + + + + + + + + U K
I ■ ■ I ■ ι I I ■ ■ I ■ . I I ! ! I ! ι I I I ! I i_i ι ι ι ι ι ι I ! i I I I I
350
300
215
250
225
200
180
160
_ 140
100
1 9 1 9
1 9 8 0
EINFACH- LOGARITHfllSCHE SKALA
1981
SEH I-LOGAR Ι ΤΗΓ1 IC SCALE
1982
1983
ECHELLE SEH I-LOGARΙΤΗΠΙQUE
400
300
215
250
225
VERBRAUCHERPREISE
GESAMT INDEX
CONSUriER P R I C E S
GENERAL INDEX 1915=100
PRIX A LA CONSOCIATION
INDICE GENERAL +++++++++++++++ NL +++ +++ +++ ******* I R L
EUR 1 0
DK GR
120 _
*** « . # * ' "
, » . w » * « · * * · * * ' *4* i Su « w «
. ft *** J
400
350
300
- 215
250
225
200
180
160
GEMEINSCHAFTSTABELLEN
COMMUNITY TABLES
VOLKSW.GESAMTRECHN. ESVG
NATIONAL ACCOUNTS ESA
COMPTES NATIONAUX SEC
EUR10 BELGIQUE
BELGIË DANMARK BR
DEUTSCHLAND Ε Λ Λ Α Δ Α F R A N C E N E D E R L A N D
U N I T E D K I N G D O M
0 0 1 BRUTTOINLANDSPRODUKT VERAENDERUNG DES VOLUMENS
GROSS DOMESTIC PRODUCT CHANGE IN VOLUME
PRODUIT INTERIEUR BRUT EVOLUTION EN VOLUME
1 9 7 5 I 1 0 0 . 0 3.9
1 9 7 9 1 9 8 0 1 9 8 1 1 9 8 2
1 14.9
1 16.2
1 15.8
1 16.2
1 9 7 9 IV 1 9 8 0 I
IV 1 9 8 1 I
IV 1 9 8 2 I II IM IV 1 9 8 3 I
+ 3.6 + 5.2 + 0.9 + 1.2 1 . 8 1 . 6 0 . 6 0 . 2 + 0.7 + 0.9 + 1.0 + 0.2 0 . 0
1 12,3 1 15.1 1 13,9 1 12.8
+ 2.9 + 5.7 + 1.5 + 0.8 1 . 9 3 . 6 1 . 6 1 . 7 2 . 6 0 . 1 0 . 3
2.1
113.7 1 13.5 113.5 1 16.4
0 0 2 PRIVATER VERBRAUCH VERAENDERUNG DES VOLUMENS
1975 I 1979 1980 1981 1982
loco
115.0 1 16.5 1 16.7
1 9 7 9 III IV 1 9 8 0 1 II III IV 1 9 8 1 I II III IV 1 9 8 2 I II III IV
+ 2.9 + 3.6 + 3.8 + 0.1 + 2.2 + 1.0
3.8
115.3 1 1 7.3 115.2
+ 3.9 + 5.3 + 2.5 + 4.5 + 3.0 + 0.5 1 . 1 0 . 4
2 . 1 0 . 4 1 . 6
1.9
111.5 107.4 105.6
25.5
116.6 1 19,0 1 18.9 117.9
+ 4.3 + 5.7 + 0.8 + 1.4 0 . 3 1 . 4 + 0.1 + 0.7 + 0.7 0 . 0 + 0.0 1 . 8 1 , 9
EUR 10
1.9
1 9 7 5 121.8 123.9 124.4 123.3
1 0 0
1 0 0
<Vb, T 4 / T 0
+ 0.2
+ 1,6
0 . 1 + 2.0
+ 3,8
1 , 7 + 0,0
+ 1.8
1 . 2 + 2.3
21.8
115.3 1 16,2 1 16,4 1 18,9
+ 3,4 + 3.6 + 2,0 + 0,1 0 . 6 1 . 9 0 . 1 + 0.5 + 1.8 + 2.7 + 2.5 + 1.3 + 1.4 + 1.3
CONSUMPTION BY HOUSEHOLDS
25.2
1 14,4 1 16,4 115.2
+ 1.5 + 2.7 + 3.7 1 . 0 + 2.4 + 1.2 1 . 6 0 . 5 1 . 2 1 . 6 1 . 4 2 . 0 3 . 0 2 . 5
CHANGE IN VOLUME EUR 10
2.1
1 9 7 5 1 2 2 . 2 1 2 1 . 8 1 2 2 . 2
1 0 0
1 0 0
% , T 4 / T 0
21,7
1 17.7 1 19.1 121.8
+ 2.8 + 2.4 + 1.3 + 1.8 + 1.4 0 . 3 + 2.8 + 2.3 + 2.7 + 4.2 + 2.7 + 2.5 + 2.3
17.8
119.3 121.5 123.6 124.5
116.2 120.8 120.6 120.3
+ 5.5 + 10.4 + 5.0 + 6.3 4 . 8 0 . 6 0 . 4 + 0.7 + 0.9 + 1,5 + 0,6 1 . 0 2 . 4
0,2
1 1 1.6 1 12.4 108.7 109.5
5.4
1 12.7 113,3 1 12.1 111.1
2 0 . 6
109.9 107.6 105.1 106.3
+ 1.4 + 2.3 3 . 5 1 . 6 2 . 7 2 , 4 2 . 3 2 . 9 0 . 8 0 . 4 + 0.9 + 2.5 + 2.7
CONSOMMATION PRIVEE EVOLUTION EN VOLUME
119.7 1 18.5 1 18.3
1 14.8 1 19.7 1 19.5
+ 4.6 + 5.2 + 5.4 + 5.6 + 4.7 + 2.0
0,2
112.5 1 16.1 116.9
4,9
1 16.4 115.6 1 12.6
+ 2.6 + 3.4 + 1.8 0 . 8 1 . 7 2 . 4 2 . 6 2 . 6 2 . 6 2 . 5 1 . 8
20.6
1 10.3 109.4 109.4
+ 2.8 + 4.5 + 4.1 3 . 6 + 0.6 0 . 6 0 . 5 + 1.2 + 0.5 + 0.6 0 , 7 + 0.3 + 1.8 + 3.0
0 0 3 BRUTTOANLAGENINVESTITIONEN VERAENDERUNG DES VOLUMENS
GROSS FIXED CAPITAL FORMATION CHANGE IN VOLUME
FORMATION BRUTE DE CAPITAL FIXE EVOLUTION EN VOLUME
1 9 7 5
1 9 7 9 1 9 8 0 1 9 8 1 1 9 8 2
9 7 9 IV 1 9 8 0 I
III IV 1 9 8 1 I II
IV 1 9 8 2 I II III IV 1 9 8 3 I
100.0
1 1 1,4 1 13.7 1 10,3
+ 6,8 + 8,7 + 2.8 + 2.8 0 . 6 4 . 0 2 , 7 1 . 6 3 . 6 2 . 5 2 , 1 2 . 6 1 . 1
4.2
102.7 108.5 1 0 5 . 0
+ 5.5 + 9.4 + 14.4 8 . 8 6 , 7 1 7 . 5 1 2 . 4 1 7 . 8 1 8 . 7 1 1 . 2 8 . 1
2.2
1 14,1 98,5 83,5
.
25.1
123.7 126.0 121.2 1 13.7
+ 8.4 + 14.1 + 1.3 + 2.2 1 . 8 6 . 6
1 . 1
1 . 7 6 . 2 7 . 0 6 . 8 6 . 5 2 . 5
EUR 10
1.9
1 9 7 5 131.6 120.7 1 1 6 . 4
= 1 0 0
100
% . T 4 / T 0
+ 6.1 7 . 0 4 . 9 1 1 . 1 1 1 . 7 2 3 . 0 1 0 . 1 + 4.2 1 1.4 + 2 0 . 8
2 4 . 0
105.3 1 0 6 . 0 104.0
+ 4.0 + 6.6 + 3.7 + 0.2 0 . 1 1 . 3 1 . 1 0 . 1 1 . 8 0 . 7 + 2.0 + 0.7 + 0.8 + 0.5
0.8
157.8 144.4 153.1
17.3
107,8 118.0 1 17.7
+ 9.0 + 6.4 + 7.3 + 15.7 + 8.8 + 4.1 1 . 0 + 0,3 0 . 7 4 . 4 3 . 0 7 . 4 6 . 3
0.2
105.8 105.9 105.1
5.3
109.9 107.1 9 9 . 6
+ 4.2 + 27.1 7 . 4 7 . 3 1 2 . 9 1 3 . 9 1 2 . 5 5 . 9
19.1
102.8 101.6 9 4 . 4