Can the effectiveness of an online stress management program be
augmented by wearable sensor technology?
Abigail Millings
a,⁎
, Joanna Morris
b, Angela Rowe
b, Sally Easton
b, John K. Martin
c,
Dennis Majoe
d,e, Christine Mohr
fa
University of Sheffield, Western Bank, Sheffield, UK b
University of Bristol, 12a Priory Road, Bristol, UK c
Ultrasis UK Ltd, 23 York Road, London, UK d
ETH Zurich, Rämistrasse 101, 8092, Zurich, Switzerland eMA Systems, 89 High Street, West End, Southampton f
Université de Lausanne, Bâtiment Geopolis, Quartier Mouline, Bureau Geo - 4117, CH-1015, Lausanne
a b s t r a c t
a r t i c l e i n f o
Article history:
Received 28 November 2014 Received in revised form 27 April 2015 Accepted 27 April 2015
Available online xxxx
Keywords: Biofeedback Stress management Psychoeducation CCBT Quantified self
Background:Internet interventions for mental health concerns are known to be effective, but how can developing technology be utilised to improve engagement and augment the effectiveness of these programs? One option might be to incorporate feedback about the user's physiological state into the program, via wearable sensors. Objectives:This mixed-methods pilot study sought to examine whether the effectiveness of an online interven-tion for stress in students could be augmented by the use of prototype wearable sensors.
Methods:Students who were stressed, but not depressed, were allocated to a stress management program alone (n= 34), with sensors (n= 29), or to no intervention (n= 35). Interventions lasted 4 weeks. Outcome measures included measures of stress, anxious, and depressive symptoms, and were measured immediately after the inter-ventions and 4 weeks later. Participants in the two program groups were interviewed to gain feedback about the program and the sensors.
Results:Significant pre-post reductions in stress (p= .019) were observed for those in the program alone group. Significant reductions in depressive symptoms were observed among postgraduates (p= .006), but not under-graduates, in the program only group. The program plus sensors group had a broadly similar, but weaker set of results, indicating that the sensors impeded, rather than augmented, the effectiveness of the program. Qualitative data explicate thisfinding, highlighting participation burden as a key issue. Participants provided detailed feed-back about the program, the sensors, and biofeedfeed-back exercises, which are summarised and discussed with reference to the quantitativefindings.
Conclusions:The newly developed stress management program could be an effective way to improve student mental health. Wearable sensor technology, particularly biofeedback exercises, may be a useful contribution for the next generation of e-therapies, but further development of the prototypes is needed and their reliability and usability will likely affect user responses to them.
© 2015 The Authors. Published by Elsevier B.V. This is an open access article under the CC BY-NC-ND license (http://creativecommons.org/licenses/by-nc-nd/4.0/).
1. Introduction
The use of technology for the promotion of self-driven psychological wellbeing has grown exponentially in recent years, and the Internet can be used for the delivery of psycho-education and therapies such as cog-nitive behaviour therapy (CBT) to promote mental health and wellbeing
(Andersson, 2009). It has been established that so-called‘e-therapies’ can be effective and acceptable (Andrews et al., 2010; Barak et al., 2008) and cost effective (McCrone, 2004) in the treatment of a wide va-riety of psychological problems, including stress, among otherwise healthy individuals (Rose et al., 2013; Zetterqvist et al., 2003). Attention is turning to the future research agenda in e-mental health (Andrews and Williams, 2014; Barak and Grohol, 2011), where issues such as how to personalise and promote engagement with e-therapy programs have been highlighted as requiring attention (Cavanagh and Millings, 2013a). Some suggestions include enhancing therapeutic relationship factors (Cavanagh and Millings, 2013b), others include widening the pool of techniques utilised in e-therapies to include cognitive bias
Internet Interventions xxx (2015) xxx–xxx
⁎ Corresponding author.
E-mail address:a.millings@sheffield.ac.uk(A. Millings),[email protected] (J. Morris),[email protected](A. Rowe),[email protected](S. Easton), [email protected](J.K. Martin),[email protected](D. Majoe), [email protected](C. Mohr).
http://dx.doi.org/10.1016/j.invent.2015.04.005
2214-7829/© 2015 The Authors. Published by Elsevier B.V. This is an open access article under the CC BY-NC-ND license (http://creativecommons.org/licenses/by-nc-nd/4.0/).
Contents lists available atScienceDirect
Internet Interventions
modification (Andrews and Williams, 2014), and yet others are turning to ambient intelligence (Alcañiz et al., 2009). A further direction is the inclusion of sensor technologies.
Recently, sensor technology for the detection and measurement of biological signals, such as in biofeedback, has been developing apace. The potential capacity of sensor technologies to augment the e-therapy experience, through objective, automatic monitoring and feedback, has attracted some interest (Alcañiz et al., 2009). Recent inter-disciplinary funding strategies such as EC Seventh Framework Pro-gramme schemes like ITC Personal Health Systems have enabled a new synergy between e-therapies and sensor technologies. By way of context, several projects funded by such strategies involve a combina-tion of sensors and Internet-delivered CBT treatment, with a goal of making e-therapies for depression and other mental health problems more personalised, and capitalising on the abilities of intelligent technologies to use and interpret physiological data in the delivery of e-therapy content. Two such projects were ICT4DEPRESSION (http://cordis.europa.eu/project/rcn/93794_en.html), which offered a mobile CBT treatment with wearable biosensors, and Help4Mood (http://cordis.europa.eu/project/rcn/97478_en.html), which brought together a 3D expressive virtual agent and activity monitoring for re-covery from depression. In the present paper, we present an explorato-ry, mixed methods pilot study, from a project in the same funding round as those mentioned, investigating the feasibility of using prototype wearable sensors for periodic monitoring and biofeedback alongside an e-therapy program for stress.
1.1. Biosensors for monitoring and feedback
Self-tracking is the practice of recording and monitoring aspects of oneself (e.g. sleep quality, management of a chronic condition, mood states, etc.), for the purposes of learning, noticing patterns, and effecting change (Swan, 2012). The appeal of‘self-tracking’or the‘quantified self’ movement has grown rapidly since the inception of smartphones, which makes data capture and representation available to the masses. The inherent curiosity humans have about themselves makes self-tracking an engaging activity with a potential for clinical benefit.
Biofeedback can be considered a real-time relative of self-tracking, involving the feeding back of a biological signal, in a perceivable and comprehensible form, to the individual from whom it originates. The in-dividual can then attempt to exert control over the signal, and produce a change in it. The continuous feeding back of the signal in real time pro-vides reinforcement for behaviours that are having the desired effect on the signal (Zaichkowsky and Fuchs, 1988). For example, an individual might view a lightflashing to indicate each beat of their heart, and attempt to slow the rate.
Offering individuals the technology with which to monitor certain biological signals, known to be associated with stress, both over time, and in real-time biofeedback, might serve to promote engagement with an e-therapy program for stress management. Two such biological signals were identified for monitoring and biofeedback purposes in the current study: heart rate variability (HRV) and alpha power.
1.2. Heart rate variability (HRV)
Heart rate oscillations occur normally. Low HRV has been associated with anxiety disorders and stress (Friedman and Thayler, 1998), where-as high HRV is thought to indicate good emotion regulation abilities (Appelhans and Luecken, 2006). HRV is also commonly used in biofeed-back (Lehrer, 2013). The goal of HRV biofeedbiofeed-back training is to produce increases in heart rate during inhalation and decreases in heart rate during exhalation, thus maximising overall heart rate variability (Lehrer et al., 2000).Training typically involves providing a visual signal of heart rate activity to the trainee, with the goal of trainees increasing their HRV (if low), often through modulating their breathing instruction.
Because of the known relationship between HRV and stress (Vrijkotte et al., 2000), HRV was identified as an appropriate biosignal to allow participants to measure for themselves, periodically during the stress management program, and also to use in a realtime biofeedback exercise.
1.3. Alpha power
Alpha asymmetry is defined as unequal alpha power generation coming from the two hemispheres of the brain, and has been found to be associated with mental ill-health.Bruder et al. (1997)found that pa-tients with depression, both with and without co-morbid anxiety, had significantly higher alpha asymmetry than healthy controls, and a meta-analysis found that despite many inconsistencies across studies, broadly, data support the notion of a link between frontal alpha asym-metry and depression and anxiety (Thibodeau et al., 2006).
When biofeedback involves feeding back of signals originating in the brain, it is termed neurofeedback. Neurofeedback has been used to reduce physiological symptoms such as migraine incidence (Stokes and Lappin, 2010), and to improve cognitive performance (Zoefel et al., 2011). Increases in alpha have been linked with meditative states (Cahn and Polich, 2006). Alpha neurofeedback training has been found to increase cognitive performance (Hanslmayr et al., 2005) short term memory (Nan et al., 2012), and may have benefits for anxiety and depression (Hammond, 2005). In our study, we therefore enabled par-ticipants to measure their own alpha asymmetry, periodically, during the stress management program, and also to practice a form of alpha neurofeedback training.
1.4. The current study
In the current study, we examine the feasibility of using prototype wearable sensors for periodic monitoring of biological variables as well as biofeedback and neurofeedback, to augment the effectiveness of a stress management program. We conducted an exploratory study comparing the effects of i) an online stress management program on its own; ii) the same program in conjunction with bio- and neurofeedback sensors; and iii) a no intervention control group; on psy-chological distress (stress, depression, and anxiety) during a stressful time period. Although the biosignals described above were measured in a self-tracking manner, they are not treated as outcomes here, due to a) their use only occurring in the sensors group, and b) the vast var-iation in use by participants in that group. We did not conduct a power calculation due to the novelty of the program plus sensors system (there was no prior art on which to base a power calculation), and because our goal was to examine the feasibility of using the prototype sensors, rath-er than to conduct a proprath-erly powrath-ered trial. Due to the novelty of the interventions, we employed a mixed methods design. Qualitative inter-views were used to gain insight into the experience of the participants in both active intervention groups (stress management program alone, and stress management program with sensors).
2. Method
2.1. Participants
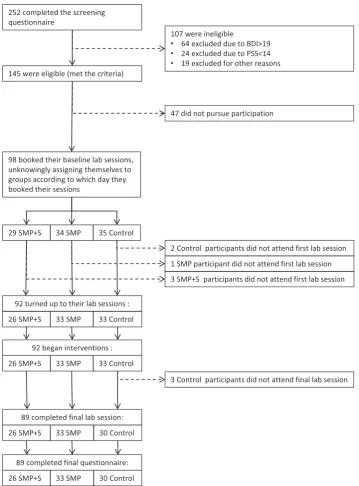
the ability to use a computer and the internet without the aid of screen readers. Several exclusion criteria were applied to meet the requirements of the physiological aspects of the broader research pro-gramme (not discussed in this paper): daily use of recreational drugs, pregnancy, heavy smoking, diagnosed mental health condition or fam-ily history thereof, heart conditions, epilepsy, or cortisol medication. Po-tential participants were 98 students who were moderately stressed (scoringN14 on the Perceived Stress Scales (Cohen et al., 1983) but no more than mildly depressed (scoringb19 on the Beck Depression Inventory (Beck et al., 1996b). Participant recruitment andflow are depicted inFig. 1. At baseline lab sessions (to which 6 potential partici-pants did not arrive), participartici-pants were 92 students (79% female, under-graduaten= 43, postgraduaten= 49), with a mean age of 23.71 (SD 4.75). Fifty-five percent were British and 45% were international students.
2.2. Measures
2.2.1. Stress
[image:3.595.123.483.238.725.2]We used the 10-item Perceived Stress Scale, PSS-10 (Cohen et al., 1983) to measure self-reported stress at screening, and the 4 item ver-sion of the same measure subsequently, to avoid participation burden. The PSS is designed to measure the extent to which respondents feel their lives are uncontrollable, unpredictable, and overloading. The 10-item PSS typically has good reliability (αranges from .78 to .91 across 3 large US samples (Cohen and Janicki-Deverts, 2012). In a representa-tive US sample, an overall mean score of 13.02 (SD 6.35), 14.02 (SD 6.2) for the 20–29 year olds, and 15.3 (SD 6.6) among students was reported (Cohen and Williamson, 1988). We therefore settled on middle ground a cut off of a score of 14 or higher for inclusion in our study. A recently published UK based study (Warttig et al., 2013) reported good reliability
for the 4-item PSS (α= .77) and presented norms data including a mean of 6.66 (SD 3.23) for the 18–29 year olds. No specific data were reported for students (Warttig et al., 2013).
2.2.2. Depression
To measure depression, we used the Beck Depression Inventory-II (BDI-II) (Beck et al., 1996b). The BDI-II has good reliability and validity (α= .91, (Beck et al. 1996a).Beck et al. (1996a,1996b)report that scores of 0–13 represent minimal depression, scores of 14–19 represent mild depression, scores of 20–28 represent moderate depression, and scores of 29–63 represent severe depression. For the broader purposes of our research programme, participants with a BDI-II scoreN19 were excluded from participation.
2.2.3. Anxiety
To measure anxiety, we used the State-Trait Anxiety Inventory-Trait (STAI-T,Spielberger et al., 1970). The STAI-T is a 20 item questionnaire, measuring feelings of tension, worry and apprehension. Item are rated on a 4 point scale of agreement (1 =‘not at all’, 4 =‘very much’). All items are summed to provide a total score ranging from 20 to 80, and higher scores indicate greater anxiety. Previous research has found the measure to be reliable (α= .92, (Spielberger, 1983).
2.3. Interventions
Two interventions were used in this study, a stress management program (SMP) and a prototype wearable sensor kit, comprising an ECG, and an EEG sensor, and a netbook from which to operate them. Both kinds of sensor had periodic monitoring functions, the data from which could be observed in the stress management program, and addi-tionally, bio/neurofeedback exercises, which were completed in sepa-rate software. Participants either received the standalone SMP, the SMP plus the sensor kit (SMP + S), or no intervention.
2.3.1. ECG sensor for periodic monitoring (24 h monitoring of HRV) The ECG sensor could be worn for periods of up to 24 h. The sensor recorded heart rate, heart rate variability, and physical activity from a 3 axis accelerometer. For physical activity, the sensor recorded the 3 axis accelerometer values every half second, and stored the average result every 10 min. For heart rate and heart rate variability, the sensor recorded 128 heart beats every 10 min. The average heart rate was cal-culated and stored. A Fast Fourier Transform (FFT) was calcal-culated using the 128 samples. Heart rate variability was calculated as a variance and as a ratio taking a sum of the low frequency and high frequency compo-nents of the FFT. The feedback viewed by the user from these data consisted of two scores–one for HRV (described as vagal tone) and one for sleep quality (based on physical activity). Both scores were pre-sented graphically, as percentages, with higher scores referring to great-er vagal tone and bettgreat-er sleep quality. Participants wgreat-ere informed that scores of 50% represented average scores achieved by previous research volunteers.
2.3.2. ECG sensor for biofeedback (HRV biofeedback exercise)
The ECG sensor could also be used for biofeedback training. In bio-feedback mode, the ECG sensor transmitted a stream of raw data (the differences between heartbeats) to a software application on a netbook. The netbook software calculated the heart rate variability and displayed the Fast Fourier Transform (FFT) result to the user as a frequency power spectrum. The software calculated the energy in the spectrum around a specific range of frequencies, which matched the optimum respiration rate for that person (based on pre-defined values according to age and gender). The software displayed an animated cue for in-breaths and out-breaths, which encouraged the user to breathe at their optimal rate. When optimal breathing was achieved, the power spectrum rose. Rises in the power spectrum produced an additional graphical cue to the user–a grayed-out butterfly became increasingly colourful.
2.3.3. EEG sensor for periodic monitoring (alpha asymmetry)
The EEG sensor could be used to take short (5–10 min), periodic recordings of alpha asymmetry. The EEG sensor collected raw data col-lected from 5 electrodes (including 2 reference points), and sent it wire-lessly to the netbook software. The software calculated the power in the alpha range of frequencies in the raw data relating to the FP1 and FP2 electrodes, on the left and right sides of the forehead. These data were then converted into a ratio score, and could be viewed graphically by the user. Scores closer to 0 were said to indicate greater symmetry be-tween the alpha power generated by the left and right hemispheres, which was explained to users as a possible indicator of feeling more positive and less stressed.
2.3.4. EEG sensor for neurofeedback (alpha/beta neurofeedback)
The EEG sensor could also be used for alpha neurofeedback training. In this mode, the netbook software received alpha and beta power data from the sensor. The software emitted a pleasant, waterfall-like sound to the user. The volume of this sound depended on the amount of power in the alpha part of the EEG spectrum, divided by the power in the beta part of the spectrum. The user could then learn how to take control of the volume of waterfall by increasing their alpha relative to beta power.
2.3.5. Stress management program:‘Optimise Me’
The stress management program used in the current study was de-veloped specifically for this project, drawing on a widely used existing program for depression with or without comorbid anxiety,‘Beating the Blues’. Our goal was to develop a system that could be used for stress rather than depression, with, or without, the sensors. In designing the content we drew from the principles of cognitive behavioural therapy and positive psychology, while also offering psychoeducation about the nature of stress, and the importance and function of attachment re-lationships and styles. Structurally, the program was designed as a user-driven‘pick and mix’program, rather than a defined or responsive route through the content. After a compulsory introduction incorporating stress psychoeducation and a goal-setting exercise, users could dip in and out of a range of modules as they chose. Modules offered were: re-laxation, thought challenging, assessing values, insomnia relief, problem solving, and social relationships. The homepage provided access to each of these modules, additional information sheets, a graphical feedback stress-tracker using the Perceived Stress Scale (Cohen et al., 1983) and buttons to revisit the stress psychoeducation and goal-setting modules. The homepage also provided a button to access graphical feedback of data collected by using the sensors for periodic monitoring, where relevant.
2.4. Procedure
Participants meeting the inclusion criteria were invited to schedule themselves for afirst lab session. Random allocation to groups was not possible due to the particular scheduling challenges associated with the sensors group. Thus, lab sessions were designated in advance for the stress management program group (SMP), the stress management program plus sensors group (SMP + S), or the control group. The allocation of sessions to intervention groups was concealed from partic-ipants. Participants booked themselves into lab sessions at their convenience, unknowingly allocating themselves to group.
explanation of the program, along with a 5 min demo. Participants were asked to use it 2–3 times per week, for a minimum of 10 min each time, and to get in touch with the team in the event of any questions or prob-lems. They were informed that the research team would be in touch to schedule theirfinal lab session 4 weeks later. Those in the SMP + S group were introduced to the concept of sensors and shown how to complete an EEG recording, and how to begin an ECG recording. They were then sent home wearing the ECG sensor, and returned for an addi-tional lab session 1–2 days later.
In the additional lab session (undertaken only by the SMP + S group), participants were shown how to download the ECG data they had recorded since the previous session, and taught how to use the bio-feedback and neurobio-feedback programs, and were also provided with the same 5 min demo of the Optimise Me program as the SMP group. Participants were asked to aim to complete each week: 1 EEG recording, 1 ECG recording, biofeedback and neurofeedback, and 2 × 10 min ses-sions on Optimise Me, where their sensor recordings data could be viewed. They were then asked to get in touch with any questions or problems and were informed that the research team would be in touch to schedule theirfinal lab session 4 weeks later.
Final lab sessions were scheduled 4 weeks after the beginning of the interventions. In this session, equipment was returned and the experi-mental tasks for another research study were repeated. Participants also completed the same questionnaire measures as they did at base-line. Participants in either the SMP or SMP + S groups were asked to participate in a short interview (SMPn= 23, SMP + Sn= 17) or focus group (4 x SMP focus groups of 2 people, 1 x SMP + S focus group of 3 people, and 3 SMP + S focus groups of 2 people) to provide feedback about their experience of the SMP and sensors (where relevant).
The semi-structured interview probed for information about what they liked and disliked about the SMP, each of the sensors, and each way of using the sensors, and what changes they would recommend should anything be further developed. Data were audio-recorded and transcribed. Participants in the SMP and SMP + S groups were free to continue use the stress management program (without sensors) after this point at their own choosing (they were not guided or requested to do).1Finally, 4 weeks later, participants were asked to complete the questionnaires again, online. Participants were thanked and debriefed.
3. Analysis and results
3.1. Quantitative analytic strategy
We used mixed design ANOVAs to assess the existence of between group differences in outcome variables at post-intervention compared to pre-intervention. Undergraduates (UG) and postgraduates (PG) face different kinds of study-related stress (high stressflashpoints in the academic year versus chronic, ongoing stress respectively), which may reflect the distinction made between chronic and acute stress in depression literature (McGonagle and Kessler, 1990). We therefore took UG/PG status into account in our analysis. For each target variable (stress, depression, and anxiety) wefirst used a 3 (Group: control, SMP, SMP + S) × 2 (Time: baseline, follow-up) × 2 (Status: UG, PG) mixed repeated measures ANOVA comparing pre- to post-intervention scores
(model 1). If UG/PG status affected outcomes, we expected to observe a significant time x group x year interaction. In the absence of this signif-icant three-way interaction term, we then adopted a more parsimoni-ous model: a 3 (Group: control, SMP, SMP + S) × 2 (Time: baseline, follow-up) mixed ANOVA with repeated measures pre- to post-intervention (model 2). Wefirst investigated these models for the post-intervention data, to compare pre- and post- intervention scores, and then subsequently repeated the analysis with the follow-up data, to compare pre-intervention and 1 month after post-intervention scores.
3.2. Quantitative results
Descriptive statistics are shown inTable 1.
3.2.1. Stress
The Time x Group x Status interaction in model 1 was not significant (F(2, 83) = 1.344,p= .266), so we proceeded to model 2. In model 2, the main effects for Time (F(1,86) = .953,p= .332) and Group (F(2, 86) = .582,p= .561) were not significant, an indication that neither of these variables had an independent main effect on stress scores. The Time x Group interaction was significant (F(2, 86) = 4.285,p= .017), indicating that the change in stress scores from pre- to post-intervention differed as a function of post-intervention group. Post-hoc anal-ysis with one-way ANOVAs showed no significant differences between groups at pre-intervention (F(2,89) = 1.262,p= .288) but differences approaching significance at post-intervention (F(2,86) = 2.53,p= .085). The post hoc Tukey test revealed a difference approaching signif-icance (p= .070) between the SMP (M =5.61, SD = 2.66) and control group (M = 7.10, SD = 2.578) at post-intervention, with a Cohen's d of .57, indicating a medium effect size. Paired samples t-tests showed that participants in the control group had higher (worse) PSS scores at post-intervention approaching significance (t(29) =−1.975,p= .058) with a Cohen's d of−.40, indicated a small effect size. Those in the SMP group had significantly lower (better) PSS scores at post-intervention (t(32) = 2.48,p= .019) compared to pre-intervention, with a Cohen's d of .53, indicating a medium effect size. Those in the SMP + S group also decreased from pre- to post-intervention, but not significantly (t (25) = .849,p= .404, Cohen's d = .21, a small effect size).
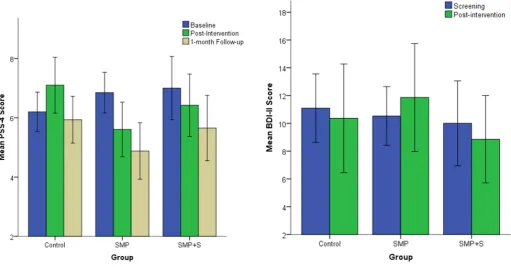
We repeated this model with the follow-up data (1 month after post-intervention),finding no main effect of Group (F(2, 86) = 1.114, p= .333), a significant effect of Time (F(2,85) = 8.873,pb.001), and a Time x Group interaction approaching significance (F(4, 172) = 4.285,p= .074). This indicates that all groups improved over time, but the level of improvement differs by group.Fig. 2displays the pre-intervention, post-intervention, and follow-up PSS means for each group. An ANOVA probing the differences between groups at 1 month follow-up revealed no significant differences (F(2, 46) = 1.414, p= .249).
Ourfindings indicate that both intervention groups improved their stress scores over the intervention period, and appear to continue to improve over the following month (Fig. 2). However, the differences be-tween groups at 1 month follow-up were no longer large enough to be statistically significant. The greatest improvements were evident in the SMP group, followed by the SMP + S group. Thus, while both groups improved, only the SMP did so in a statistically meaningful way, and this greater improvement relative to the other two groups was not maintained at 1 month follow-up.
3.2.2. Depression
To avoid over-burdening our participants, we used BDI-II during screening (ensuring that participants passed our exclusion criteria) but did not repeat the measure at pre- intervention. We therefore analyse changes in BDI-II scores from screening to post-intervention, and from screening to follow-up.
In model 1 for BDI-II, the three-way interaction Time x Group x Status (F(2, 83), = 3.138,p= .049) was significant, indicating that undergraduates and postgraduates differed in the way their scores changed as a function of group. We therefore based our subsequent analysis on model 1. No significant main effects were found for Time (F(1, 83) = 2.370,p= .127), Group (F(2, 83) = 1.656,p= .197), or Status (F(1, 83) = .076,p= .784). No significant two-way interactions were found for Time X Group (F(2,83) = 1.336,p= .269), Time X Status:F(1, 83) = 1.668,p= .200), or Group x Year (F(2, 83) = 1.405,p= .251). This model is depicted graphically inFigs. 3 and 4.
Post hoc analyses using one-way ANOVAs were used to probe the 3-way interaction by examining differences between groups. As it appears in the graph, there were no significant differences between groups for undergraduates at either screening or post-intervention. Among the postgraduates however, while the groups did not differ significantly at screening (F(2, 46) = .071,p= .932), there was a significant difference
[image:6.595.33.556.77.268.2]between the groups at post-intervention (F(2, 46) = 5.959,p= .005). Post hoc Tukeys reveal that specifically, the difference between the SMP and control groups (p= .006), and the difference between SMP + S and control group (p= .047) were both significant, with Cohen's ds of 1.04 and .84 respectively, which equate to large effect sizes. Additionally, paired sample t- tests were used to probe the interaction by examining within-group differences. Consistent with the ANOVA described above, no significant differences were found for undergraduates. Among post-graduates, while those in the control group had increased scores of depressive symptoms at post- intervention, this was not significantly higher than at screening (t(18) =−1.030,p= .317), and had a small effect size (Cohen's d =−.28). Those in the SMP group had signif-icantly lower (better) BDI-II scores at post- intervention (t(17) = 3.150, p= .006) compared to screening, with a Cohen's d of .93 (a large effect Table 1
Descriptive statistics for all variables at each time point.
Variable αatfirst use ScreeningM(SD) Pre-InterventionM(SD) Post-InterventionM(SD) 4 Weeks Follow UpM(SD)
Stress (PSS 4) .63
Total sample 20.95 (4.28) n/a n/a n/a
Control 21.24 (4.51) n/a n/a n/a
SMP 21.03 (4.59) n/a n/a n/a
SMP + S 20.46 (3.65) n/a n/a n/a
Stress (PSS 10) .72
Total sample n/a 6.65 (2.16) 6.35 (2.69) 5.46 (2.59)
Control n/a 6.18 (1.79) 7.10 (2.58) 5.93 (2.16)
SMP n/a 6.85 (1.97) 5.61 (2.66) 4.88 (2.74)
SMP + S n/a 7.00 (2.73) 6.42 (2.69) 5.65 (2.81)
Depression (BDI-II) .67
Total sample 10.85 (4.74) n/a 9.87 (6.85) 7.09 (7.65)
Control 11.15 (4.30) n/a 12.27 (7.483) 8.23 (8.912)
SMP 10.91 (4.72) n/a 8.94 (6.68) 4.94 (5.20)
SMP + S 10.38 (5.40) n/a 8.27 (5.70) 8.50 (8.33)
Anxiety (STAI-T) .89
Total sample n/a 44.46 (9.11) 44.09 (8.87) 42.06 (9.55)
Control n/a 43.88 (8.26) 44.67 (9.08) 43.50 (9.70)
SMP n/a 44.39 (9.55) 42.79 (8.20) 39.70 (8.78)
SMP + S n/a 45.27 (9.86) 45.08 (9.56) 43.38 (10.07)
[image:6.595.299.549.449.716.2]Fig. 2.Stress at pre-intervention (baseline), post-intervention, and 1-month follow up, by intervention group.
[image:6.595.38.550.455.722.2]size). Finally, those in the SMP + S group also showed a trend ap-proaching significance for decreased BDI-II scores from screening to post- intervention (t (11) = 1.890,p= .085), with a medium effect size (Cohen's d = .60).
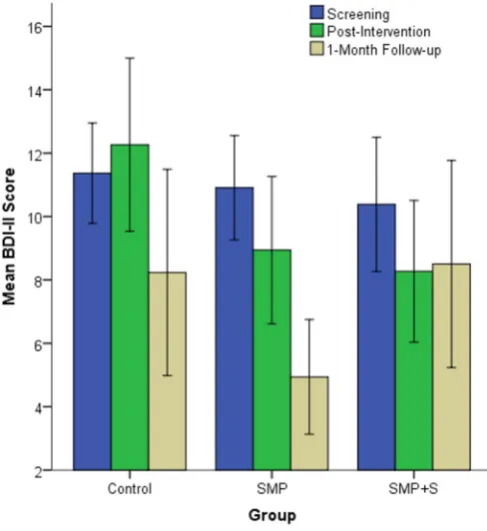
We then repeated this model with the 1-month follow up data to ex-amine changes from screening to 1-month post intervention, but found that the three-way interaction Time x Group x Year (F(4, 166) = 1.512, p= .201) was non-significant, so we opted for model 2. In model 2 for BDI-II scores at 1 month follow up, we found no significant effect of Group (F(2, 86) = 1.801, p= .171) a significant effect of Time (F(2,85) = 10.668,pb.001), and a significant Time x Group interaction (F(4, 172) = 2.865,p= .025) indicating that improvements in BDI-II scores over time differed as a function of group. This model is depicted inFig. 5.
One-way ANOVAs were used to look at the differences between the groups. At screening there was no difference between the groups (F (2, 89) = .191,p= .826) and while at the 1-month follow-up there appears to be a larger difference between the groups, the difference was not significant (F (2, 86) = 2.136,p = .124). Therefore, no between-group post hoc Tukeys were conducted. Investigation of the within-group differences from screening to follow up using repeated measures t-tests revealed no significant differences for the control (t(29) = 1.652,p= .109, Cohen's d = .45, a small effect size) or SMP + S (t (25) = 1.212,p= .237, Cohen's d = .27, a small effect size) groups, but a significant difference for the SMP group (t(32) = 1.212,pb.001, Cohen's d = 1.20, a large effect size). At follow up then, while all groups improved compared to screening, the SMP group was the only group to improve in a statistically meaningful way. At post- intervention, undergrads and postgrads differed in the ex-tent to which their depression scores changed, with no effects of inter-vention group among undergrads, but both interinter-vention groups doing better than the control group among postgrads, with the SMP group showing the most improvement. At follow up, there was no longer any distinction between undergrads’and postgrads’changes in depres-sion scores, with the whole SMP group showing a statistically meaning-ful improvement. The SMP + S and control groups’pre- intervention to
follow up improvements were only slight, suggesting that for depres-sive symptoms as measured by the BDI-II, the SMP was a more effective intervention than SMP + S.
3.2.3. Anxiety
In model 1 for anxiety, as measured by the STAI-T, the three way in-teraction Time X Group x Status was not significant (F(2, 83) = .095, p= .910). We therefore applied model 2, and again found no significant main effects of Time (F(1,86) = .515,p= .475) or Group (F(2, 86) = .302,p= .740). The Time x Group interaction was also non-significant (F(2, 86) = .369,p= .693). The interventions therefore had no effect on anxiety from pre- to post- intervention. We repeated model 1 exam-ining changes from pre-intervention to 1-month follow up, and again found no statistical evidence to separate the undergrads and postgrads (i.e. no significant Time x Group x Status interaction term). Model 2 was therefore repeated for the 1-month follow up data. This model yielded a significant main effect of Time (F(2,85) = 5.335,p= .007), in-dicating that all three groups improved over time. The main effect of Group was non-significant (F(2, 86) = .746,p= .477), as was the inter-action between Time x Group (F(4, 172) = .729,p= .573), indicating that improvement did not differ as a function of intervention group. Thus, while all groups improved over time in anxiety, the interventions made no difference to this improvement.
3.3. Qualitative analytic strategy
All interviews and focus group data for the SMP + S group was re-corded successfully and transcribed (n= 26). Data from the SMP group was unfortunately incomplete: three participants were not interviewed. In one case, the participant had to leave the lab session early; in two cases it was due to experimenter error. Data from two fur-ther SMP participants was lost due to corruption of a datafile. In the end, data was successfully recorded and transcribed for 28 out of 33 SMP participants.
[image:7.595.43.301.52.322.2]Transcribed data was subjected to theoretical, thematic analysis (Braun and Clarke, 2006) using NVivo 9. In this approach, data is coded in the light of a-priori research questions and pre-existing knowl-edge rather than being entirely data-driven. A second feature of our Fig. 4.Depression at screening and post- intervention by intervention group for
postgraduates.
[image:7.595.312.556.53.319.2]analysis was that we considered only the semantic (explicit) and not the latent content in statements by our participants (Braun and Clarke, 2006). In other words, we took our data at face value. Themes were derived by line-by-line coding of the dataset. The coding structure was then reviewed and revised, prior to additional reading and re-coding. We then formulated thematic maps for our central concepts. For brevity, we here present summaries of only the aspects of ourfi nd-ings that help to explain our quantitative results, rather than our full set of qualitativefindings.
3.4. Qualitativefindings
Participants in both the SMP and SMP + S groups provided a lot of feedback about the Optimise Me stress management program. The pro-gram was viewed in broadly positive terms overall, and the majority found some parts useful:
“Very brilliant! I just thought it was really really good and I definitely want to continue using it, you know.”(Participant 70, SMP group).
“I found it quite useful yeah. Yeah,um,the thinking right and the goal setting,were especially... I probably used those the most.”(Participant 41, SMP + S group).
Some participants also said that they thought it had helped to reduce their own symptoms of stress and provided examples of how:
“I think the main thing that I found useful was the sleep stuff and like some of it I heard that you should do before, but I had never done it. Because of this I did do it and it did actually, like, help.”Participant 1, SMP group.
“I found myself using it more so when like, I was feeling stressed or something had stressed me out, so I thought I'll try that now and see how that goes…I thought the breathing one especially was quite good, because I'd never tried that before…”Participant 95, SMP group.
“…In terms of changing your attitude and thinking in a different sort of way to achieve your goal. I think it's about gradually changing your mind-set.”Participant 32, SMP + S group.
Other participants felt that they had not learned anything from the program:
“I didn't really feel like I learnt something.”Participant 39, SMP + S group.
These data serve to explicate our quantitativefinding that the pro-gram was useful in reducing stress, suggesting some of the specific ways in which participants might have benefited from the program.
In our quantitative data, we found that the SMP group seemed to benefit more than the SMP + S group, suggesting that the prototype sensors impeded, rather than augmented the effectiveness of the stress management program. Our qualitative data provide some insight into this. Many participants experienced technical problems with the proto-type sensors, which were associated with feelings of frustration:
“I'd be there for 20 minutes,like,trying to click,like,reset,because…I like turn off all my electronics and there was still,like,no reason it's
not going below the curve. So that was quite frustrating.”Participant 37, SMP + S group.
“…When you can't get the signal and you can't do it in thefirst place that's really annoying,and it can end up being very time consuming.” Participant 39, SMP + S group.
“I think it's OK,it always seems to be broken or cannot...does not work, so I was quite frustrated about it...”Participant 43, SMP + S group.
These technical issues may help to account for our quantitativefi nd-ings. We consider that problems with the sensors may have negatively impacted outcomes, through frustration with the sensors directly af-fecting psychological state. It is also possible that the technical problems could have impacted on outcomes indirectly, by reducing participant motivation, however, we found no relevant qualitative data on this issue. In fact, for at least one participant, using the sensors (without technical difficulties) encouraged program use:
“I honestly just went on just to check my sensor,but then was like let's do this,let's do that,oh that would help,so…it wasn't like it was some-thing I had to remember to do,it was just curiosity to see,and then I would go on from there.”Participant 55, SMP + S group.
Despite the technical problems experienced with the sensors, many participants reported enjoying the bio- and neuro-feedback exercises:
“Yeah,they were a lot of fun. I really liked the EEG thing,it was so cool. I actually did it in front a couple of my friends and they thought it was cool as well.(haha!)OK,yeah,trying to get the volume up,while you're calming down. Sometimes I would leave a tap open,filling a bowl,just to hear the running water sound again,just for a moment just to feel calm it was very nice…I loved that…I love that one.”Participant 55, SMP + S group.
“The other one,the ECG one,I thought that wasfine. Just following the breathing system,it was nice to see the butterfly getting all colourful– knowing that I did it right.”Participant 32, SMP + S group.
Many had a preference for one feedback exercise over the other (approximately even preferences were expressed for each kind), but struggled to articulate exactly why:
“The EEG one wasn't so bad,the sound getting quieter and louder was quite satisfying. But the breathing one exercise looking at the circle and the butterfly wasn't as good. I don't know why…I never quite got the hang of that,not like I did the EEG.”Participant 34, SMP + S group.
Common responses likened both exercises to meditation or relaxa-tion, and participants reported enjoying the positive feedback received when they were achieving the desired state. A couple of participants mentioned a new-found interest in meditation as a result of using the biofeedback exercises:
“I want to meditate now,I'm going to get a meditation CD.”Participant 35, SMP + S group.
All in all, sensor experiences were mixed, and themes of frustration with technical difficulties were dominant. However, regarding biofeed-back, many had positive experiences with one or other biofeedback exercises, and reported appreciation for them.
4. Discussion
In this study examining the effectiveness of a stress management program with or without wearable sensors at reducing psychological distress in students, we found evidence for the utility of the program, and some aspects of the sensors. However, overall, using the sensor package served to reduce, rather than increase the effectiveness of the program. This is likely explained by our qualitative data suggesting par-ticipation burden associated with using the sensors. This burden mainly stemmed from technical difficulties related to the sensors being proto-types. Despite the difficulties experienced, positive feedback was received about the concept of the system as a whole, the Optimise Me program, and the bio- and neuro- feedback training programs.
That our stress management program was effective in reducing stress in students after a brief intervention period of 4 weeks is encour-aging. It is also in keeping with existing literature that shows that a pro-gram to reduce stress in an otherwise healthy population can be useful (Rose et al., 2013; Zetterqvist et al., 2003). Although the improvements in the SMP and SMP + S groups continued in the month following the intervention, it was not at a great enough rate to remain significant. This might be to do with a drop in their usage of the program.1While
participants in both groups continued to have access to the program, their use was no longer prescribed. The SMP + S group were less likely to use it during this period than the SMP group, and this may mean that the sensor experience had put the SMP + S group off engaging with the program, even after the sensors themselves were handed back to the re-search team. It is also possible that handing back the sensors implicitly signalled the end of the‘real’intervention for the sensors group, for some of whom the sensors constituted a useful aspect of the interven-tion, although further research would be needed to explore this issue. There are some important implications for future research and practice involving experimental technological augmentation of interventions that are already known to be effective. Too much technology might do more harm than good, especially if still in development and not working optimally.
That said, our study has found potential value in the bio- and neuro-feedback exercises. Despite being beta programs, most participants who used them very much enjoyed either the bio- or the neurofeedback, and reported perceived benefits from using them. In our study, these pro-grams ran in separate software to the stress management program, and required the use of specially designed prototype sensors. The sensor kit experience as a whole was therefore not a smooth and integrated one. More research and development is therefore needed in how future iterations of e-therapy programs might be able to incorporate these kinds of biofeedback training into the e-therapy software itself, poten-tially using less intrusive, more familiar and commonly occurring sen-sors, such as those present in a Smart phone, or wearablefitness device. While our study has yielded some interesting and usefulfindings, both for the e-therapy research community and the developers of inter-ventions and biosensors, it is not without limitations. Firstly, our partic-ipants were paid for their time. Due to the prototype nature of the sensors and the time required to use them it was deemed appropriate to pay our participants, both for ethical and practical reasons related to recruitment. We paid our participants an estimated hourly rate, and the amount of time required for participation differed by intervention group. However, the beneficial effects we found for the stress manage-ment program reducing stress cannot be accounted for by the monetary value of the payment, because the SMP group received less money than the SMP + S group, and yet they improved the most. In other words, the differences in improvements were not commensurate with the differ-ences in payments, leading us to believe that the improvements were
related to the interventions, and independent of thefinancial incentives. However, because payment was contingent on study completion, further research is needed to examine program adherence in an unpaid sample.
A further limitation is that due to the prescribed nature of participa-tion tasks we set our participants, our study does is not generalizable. Future research is needed to further examine the utility of the Optimise Me stress management program, without a prescribed usage plan and financial incentive, on a larger scale. Despite this, our study suggests that the program could be effective. Although not significant, the SMP group had continued to improve at follow up, despite a drop in usage. It might be that the skills learned in the program take longer than the 4 week intervention period to become fully integrated into an individual's stress management strategies. A larger and properly powered trial would allow this to be examined. We had some small and some medium effects that approached significance, so it may be ap-propriate for future research to base power calculations on small-medium effect sizes. A trial employing our 3 group, 3 time-point design powered at .90, with alpha set at .05, would require 1017 participants to detect small effect size, and 168 participants to detect a medium effect size.
The Optimise Me stress management program was designed in a ‘pick and mix’format, and other than our qualitative data, we have no way of knowing exactly which areas of the program participants accessed, or how frequently. It might be that some aspects of the program contained more effective ingredients than others, or that some aspects were responsible for the reduction in stress, while others were responsible for the reductions in depression. Future research could seek to tease out the active ingredients through dismantling (Andersson et al., 2008). Such work could also seek to identify the mechanisms of improvement by measuring potential mediators of the beneficial ef-fects, such as skills learned at various points in the program, and even changes in biosignals in response to stress (Rose et al., 2013) as a result of practicing biofeedback.
4.1. Conclusions
We conclude that the stress management program Optimise Me shows promise for reducing stress in a student population. Further re-search is required to see the extent of its potential, both in student and other populations. We conclude that biofeedback exercises might be a useful adjunct for incorporation into the next generation of e-therapies, but that the reliability and usability of the technology is of utmost importance. Future research and development, including exten-sive usability testing, is required to ensure that wearable sensor tech-nology can augment, rather than dilute the known benefits of online self-help programs.
Acknowledgements
The authors acknowledge Kevin Collins, formerly of ETH Zurich, for making the sensor software, Ultrasis UK Ltd. for making Optimise Me, and MA Systems for making the sensors. This work was funded by European Commission F7 Grant 248544. The funding source had no involvement in the preparation of this paper.
References
Alcañiz, M., Botella, C., Baños, R.M., Zaragoza, I., Guixeres, J., 2009. The intelligent e-ther-apy system: a new paradigm for telepsychology and cyberthere-ther-apy. Br. J. Guid. Couns. 37, 287–296.http://dx.doi.org/10.1080/03069880902957015.
Andersson, G., 2009. Using the internet to provide cognitive behaviour therapy. Behav. Res. Ther. 47, 175–180.http://dx.doi.org/10.1016/j.brat.2009.01.010.
Andrews, G., Cuijpers, P., Craske, M.G., McEvoy, P., Titov, N., 2010. Computer therapy for the anxiety and depressive disorders is effective, acceptable and practical health care: a meta-analysis. PLoS One 5, e13196.http://dx.doi.org/10.1371/journal.pone. 0013196.
Andrews, G., Williams, A.D., 2014. Internet psychotherapy and the future of personalized treatment. Depress Anxiety 31, 912–915.http://dx.doi.org/10.1002/da.22302. Appelhans, B.M., Luecken, L.J., 2006. Heart rate variability as an index of regulated
emo-tional responding. Rev. Gen. Psychol. 10, 229–240. http://dx.doi.org/10.1037/1089-2680.10.3.229.
Barak, A., Grohol, J.M., 2011. Current and future trends in internet-supported mental health interventions. J. Technol. Hum. Serv. 29, 155–196.http://dx.doi.org/10.1080/ 15228835.2011.616939.
Barak, A., Hen, L., Boniel-Nissim, M., Shapira, N., 2008. A comprehensive review and a meta-analysis of the effectiveness of internet-based psychotherapeutic interventions. J. Technol. Hum. Serv. 26, 109–160.http://dx.doi.org/10.1080/15228830802094429. Beck, A.T., Steer, R.A., Ball, R., Ranieri, W.F., 1996a.Comparison of Beck Depression
Inven-tories - IA and II in psychiatric outpatients. J. Pers. Assess. 67, 588–597.
Beck, A.T., Steer, R.A., Brown, G.K., 1996b. Manual for Beck Depression Inventory-II. Psychological Corporation, San Antonia, TX.
Braun, V., Clarke, V., 2006. Using thematic analysis in psychology. Qual. Res. Psychol. 3, 77–101.http://dx.doi.org/10.1191/1478088706qp063oa.
Bruder, G.E., Fong, R., Tenke, C.E., Leite, P., Towey, J.P., Stewart, J.E., McGrath, P.J., Quitkin, F.M., 1997. Regional brain asymmetries in major depression with or without an anx-iety disorder: a quantitative electroencephalographic study. Biol. Psychiatry 41, 939–948.http://dx.doi.org/10.1016/S0006-3223(96)00260-0.
Cahn, B.R., Polich, J., 2006. Meditation states and traits: EEG, ERP, and neuroimaging stud-ies. Psychol. Bull. 132, 180–211.http://dx.doi.org/10.1037/0033-2909.132.2.180. Cavanagh, K., Millings, A., 2013a. Increasing engagement with computerised cognitive
be-havioural therapies. ICST Trans. Ambient. Syst. 13, e3.http://dx.doi.org/10.4108/ trans.amsys.01-06.2013.e3.
Cavanagh, K., Millings, A., 2013b. (Inter)personal computing: the role of the therapeutic relationship in e-mental health. J. Contemp. Psychother. 43, 197–206.http://dx.doi. org/10.1007/s10879-013-9242-z.
Cohen, S., Janicki-Deverts, D., 2012. Who's stressed? Distributions of psychological stress in the United States in probability samples from 1983, 2006, and 20091. J. Appl. Soc. Psychol. 42, 1320–1334.http://dx.doi.org/10.1111/j.1559-1816.2012.00900.x. Cohen, S., Kamarck, T., Mermelstein, R., 1983.A global measure of perceived stress.
J. Health Soc. Behav. 24, 385–396.
Cohen, S., Williamson, G.M., 1988.In: Spacapan, S., Oskamp, S. (Eds.), The social psychol-ogy of health: claremont symposium on applied social psycholpsychol-ogy. Sage, Newbury Park, CA.
Friedman, B.H., Thayler, J.F., 1998.Autonomic balance revisited: panic anxiety and heart rate variability. J. Psychosom. Res. 44, 133–151.
Hammond, D.C., 2005. Neurofeedback treatment of depression and anxiety. J. Adult Dev. 12, 131–137.http://dx.doi.org/10.1007/s10804-005-7029-5.
Hanslmayr, S., Sauseng, P., Doppelmayr, M., Schabus, M., Klimesch, W., 2005. Increasing individual upper alpha power by neurofeedback improves cognitive performance in
human subjects. Appl. Psychophysiol. Biofeedback 30, 1–10.http://dx.doi.org/10. 1007/s10484-005-2169-8.
Lehrer, P.M., 2013. How does heart rate variability biofeedback work? Resonance, the baroreflex, and other mechanisms. Biofeedback 41, 26–31.http://dx.doi.org/10. 5298/1081-5937-41.1.02.
Lehrer, P.M., Vaschillo, E., Vaschillo, B., 2000. Resonant frequency biofeedback training to increase cardiac variability : rationale and manual for training 25, 177–191. McCrone, P., 2004. Cost-effectiveness of computerised cognitive-behavioural therapy for
anxiety and depression in primary care: randomised controlled trial. Br. J. Psychiatry 185, 55–62.http://dx.doi.org/10.1192/bjp.185.1.55.
McGonagle, K.a., Kessler, R.C., 1990. Chronic stress, acute stress, and depressive symptoms. Am. J. Community Psychol. 18, 681–706.http://dx.doi.org/10.1007/ BF00931237.
Nan, W., Rodrigues, J.P., Ma, J., Qu, X., Wan, F., Mak, P.-I., Mak, P.U., Vai, M.I., Rosa, A., 2012. Individual alpha neurofeedback training effect on short term memory. Int. J. Psychophysiol. 86, 83–87.http://dx.doi.org/10.1016/j.ijpsycho.2012.07.182. Rose, R.D., Buckey, J.C., Zbozinek, T.D., Motivala, S.J., Glenn, D.E., Cartreine, J. a, Craske,
M.G., 2013. A randomized controlled trial of a self-guided, multimedia, stress management and resilience training program. Behav. Res. Ther. 51, 106–112. doi: http://dx.doi.org/10.1016/j.brat.2012.11.003
Spielberger, C.D., 1983. State-trait anxiety inventory, form Y. Mind Garden Inc, Redwood City, CA.
Spielberger, C.D., Gorsuch, R.L., Lushene, R.E., 1970. Manual for the state-trait anxiety inventory. Consulting Psychologists Press, Palo Alto, CA.
Stokes, D.A., Lappin, M.S., 2010. Neurofeedback and biofeedback with 37 migraineurs: a clinical outcome study. Behav. Brain Funct. 6, 9. http://dx.doi.org/10.1186/1744-9081-6-9.
Swan, M., 2012. Health 2050: the realization of personalized medicine through crowdsourcing, the quantified self, and the participatory biocitizen. J. Perinat. Med. 2, 93–118.http://dx.doi.org/10.3390/jpm2030093.
Thibodeau, R., Jorgensen, R.S., Kim, S., 2006. Depression, anxiety, and resting frontal EEG asymmetry: a meta-analytic review. J. Abnorm. Psychol. 115, 715–729.http://dx. doi.org/10.1037/0021-843X.115.4.715.
Vrijkotte, T.G.M., van Doornen, L.J.P., de Geus, E.J.C., 2000. Effects of work stress on ambu-latory blood pressure, heart rate, and heart rate variability. Hypertension 35, 880–886.http://dx.doi.org/10.1161/01.HYP.35.4.880.
Warttig, S.L., Forshaw, M.J., South, J., White, A.K., 2013. New, normative, English-sample data for the short form Perceived Stress Scale (PSS-4). J. Health Psychol. 18, 1617–1628.http://dx.doi.org/10.1177/1359105313508346.
Zaichkowsky, L., Fuchs, C.Z., 1988.Biofeedback applications in exercise and athletic performance. Exerc. Sport Sci. Rev. 16, 381–421.
Zetterqvist, K., Maanmies, J., Ström, L., Andersson, G., 2003. Randomized controlled trial of internet-based stress management. Cogn. Behav. Ther. 32, 151–160.http://dx.doi. org/10.1080/16506070302316.