Polycomb Repressor
Complex 1 Member, BMI1
Contributes to Urothelial
Tumorigenesis through
p16-Independent Mechanisms
1Lia E. De Faveri* , Carolyn D. Hurst* , Jo-An Roulson†, Henry Wood* ,
Marta Sanchez-Carbayo‡, Margaret A. Knowles*
and Emma J. Chapman*
*Leeds Institute of Cancer and Pathology, St James’s University Hospital, Beckett Street, Leeds, LS97TF, UK;
†Department of Pathology and Tumor Biology, St James’s
University Hospital, Beckett Street, Leeds, LS97TF, UK;
‡Bladder Cancer Group, Lascaray Research Center, University
of the Basque Country, UPV/EHU, Vitoria-Gasteiz, Spain
Abstract
Urothelial carcinoma (UC) causes significant morbidity and remains the most expensive cancer to treat because of the need for repeated resections and lifelong monitoring for patients with non–muscle-invasive bladder cancer (NMIBC). Novel therapeutics and stratification approaches are needed to improve the outlook for both NMIBC and muscle-invasive bladder cancer. We investigated the expression and effects of B Lymphoma Mo-MLV Insertion Region 1 (BMI1) in UC. BMI1 was found to be overexpressed in most UC cell lines and primary tumors by quantitative real-time polymerase chain reaction and immunohistochemistry. In contrast to some previous reports, no association with tumor stage or grade was observed in two independent tumor panels. Furthermore, upregulation of BMI1 was detected in premalignant bladder lesions, suggesting a role early in tumorigenesis. BMI1 is not located within a common region of genomic amplification in UC. TheCDKN2Alocus (which encodes the p16 tumor suppressor gene) is a transcriptional target of BMI1 in some cellular contexts. In UC cell lines and primary tissues, no correlation between BMI1 and p16 expression was observed. Retroviral-mediated overexpression of BMI1 immortalized normal human urothelial cells (NHUC)in vitroand was associated with induction of telomerase activity, bypass of senescence, and repression of differentiation. The effects of BMI1 on gene expression were identified by expression microarray analysis of NHUC-BMI1. Metacore analysis of the gene expression profile implicated downstream effects of BMI1 onα4/β1 integrin-mediated adhesion, cytoskeleton remodeling, and CREB1-mediated transcription.
Translational Oncology (2015) 8, 387–399
Introduction
Worldwide, urothelial carcinoma (UC) is the ninth most common cancer, with approximately 430,000 new cases diagnosed annually
[1]. UC comprises two major tumor groups with different clinical behavior and pathogenesis pathways. One group (20%-25% at diagnosis) is invasive (≥stage T2). Prognosis for muscle-invasive bladder cancer (MIBC) is poor, with a continued need for the development of personalized treatment strategies and identification of novel therapeutic targets. The second group (N70% at diagnosis) is composed of non–muscle-invasive bladder cancers (NMIBCs) (stage Ta or T1), which recur frequently (N70%) but infrequently progress to muscle invasion [2]. Although survival is good, multifocality, frequent recurrence, and risk of progression make NMIBC difficult to
manage. Overall, UC is the most expensive cancer to treat because of the need for lifelong disease monitoring and repeated resections[3]. www.transonc.com
Address all correspondence to: Dr Emma Chapman, BSc, PhD, Leeds Institute of Cancer and Pathology, St James’s University Hospital, Beckett Street, Leeds, LS97TF, UK. E-mail:[email protected]
1This work was sponsored by Yorkshire Cancer Research project grant L355 (L.D.F.,
E.C.).
Received 19 May 2015; Revised 28 July 2015; Accepted 10 August 2015
© 2015 The Authors. Published by Elsevier Inc. on behalf of Neoplasia Press, Inc. This is an open access article under the CC BY-NC-ND license (http://creativecommons.org/licenses/by-nc-nd/4.0/). 1936-5233/15
The development of novel therapeutic and stratifying approaches will only be possible by achieving a better understanding of the molecular events involved in the development of UC. Expression of telomerase is thought to be one of the earliest steps in tumorigenesis because it can be detected in premalignant lesions [4,5]. During modeling of the early events in UC tumorigenesis in vitro, B Lymphoma Mo-MLV Insertion Region 1 (BMI1) was found to be overexpressed in genetically normal, telomerase-immortalized normal human urothelial cells (TERT-NHUC) compared with isogenic mortal NHUC [6]. BMI1 (10p11.23) encodes a key component of polycomb repressive complex 1 (PRC1). The protein contains a conserved RING finger domain and a central helix-turn-helix motif
[7]. Although it is not enzymatically active itself, as part of PRC1, BMI1 is involved in the regulation of the transcription of many genes relevant to cancer and development[8]. In some but not all tissues, BMI1 is thought to promote tumorigenesis, in part, by silencing of theCDKN2Alocus, which encodes the tumor suppressor gene p16
[9]. However, in the Ewing sarcoma family of tumors, BMI1 promotes the tumorigenicity of both p16 wild-type and p16-null cell lines, indicating that, in some cell types, the role of BMI1 in oncogenesis can be p16 independent[10]. BMI1 also contributes to tumorigenesis in an ink4a/arf-deficient mouse model of glioma[11], strongly implicating other BMI1-associated pathways in cancer. The relationship between BMI1 and theCDKN2Alocus in urothelial cells is unknown. The effects of BMI1 on gene expression or phenotype are also not understood in this cell type, although since our study was initiated, effects on proliferation and migration of the T24 UC cell line have been reported by Liang et al.[12].
Here, we examined expression of BMI1 transcript in a large panel of UC cell lines and primary tumors and used immunohistochemical detection in two independent primary UC tumor panels and samples of potentially premalignant urothelium. Using stable retroviral-mediated transduction, we investigated the phenotypic effects of BMI1 overexpression in NHUC and UC cell lines in vitro. Gene expression analysis of BMI1-immortalized cells (NHUC-BMI1) identified consistent downstream changes in gene expression and novel associations with key signaling pathways. Therapeutic inhibition of BMI1 is showing promise in colorectal cancer [13]. Therefore, a better understanding of the contribution of BMI1 upregulation to bladder tumorigenesis will provide rationale and insight into targeting this key molecule and associated pathways in UC.
Materials and Methods
Cell Lines and Tissue Samples
UC cell lines and NHUC were cultured and cell line identity was verified as described previously[14]. NHUC are cultured on Primaria cell culture dishes or flasks (Corning). Tissue was obtained with written patient consent and the approval of the Local Research Ethics Committee from patients at St. James's University Hospital, Leeds, UK. In a panel of 71 tumors, there were 6 pTaG1, 26 pTa G2, 3 pTa G3, 6 pT1G2, 14 pT1 G3, 7 T2 G3, 3 pT3 G3, 4 pTxG2, and 2 pTxG3. For 14 cases, both initial and subsequent tumors were available for the same patient. A second tissue tumor microarray (TMA) panel was obtained from 93 UC patients at Hospital Guadalajara and Hospital Central de Asturias, Spain, as described previously[14]. Tumors were graded according to the 1973 WHO recommendations and staged according to tumor–node–metastasis classification. Clinicopathological data were collected from patient
notes after completion of laboratory analyses a minimum of 3 years after collection of the initial sample. Samples of primary UC for quantitative real-time PCR (QRTPCR) have been described [15]. Tumor information is listed in Supplementary Data. Additional information towards meeting the reccomendations of the REMARK guidelines (REporting recommendations for tumor MARKer prog-nostic studies)[16]is included in Supplementary Information.
Quantitative Real-Time Polymerase Chain
Reaction (QRTPCR)
QRTPCR was performed on 23 UC cell lines and 59 primary UC using Taqman assay on demand; BMI1 (Hs00180411_m1) (Life Technologies, Paisley, U.K). Expression was quantified relative to SDHA control (Hs00417200_m1) and normalized to pooled cDNA from NHUC. Reactions were performed in triplicate, and each plate contained a no template control.
Immunohistochemistry
For detection of BMI1, primary antibody was mouse anti-BMI1 (clone F6, Millipore). For antigen retrieval, slides were pressure cooked for 2 minutes at full pressure with 0.1 M citric acid buffer (pH 6). Positive controls were normal tonsil or placenta. Baseline expression was defined by normal urothelium in each batch of tumors or TMA. To prepare control cell pellets, cells were harvested with 0.1% EDTA/PBS and 0.05% Trypsin/EDTA, pelleted by centrifugation, fixed overnight in 4% formalin, and then transferred to 70% ethanol. Approximately 1-cm3 wells were formed using tinfoil spread over and slightly compressed into a laboratory rack. Pellets were transferred to these wells, agarose at 45°C was added to cover the pellet, agarose was allowed to set, and the agarose-enclosed cell pellet was refixed in formalin before embedding in paraffin wax. BMI1 expression in UC was homogeneous and nuclear. Expression was scored as follows: 0: absent or weak staining inb50% urothelial nuclei, 1: weak staining in N50% or moderate staining in b50% nuclei, 2: moderate staining in N50% nuclei, or 3: strong staining inN50% nuclei. A score of 0 or 1 was deemed low expression and comparable to normal expression. A score of 2 or 3 was deemed to be overexpression relative to normal bladder urothelium. Sections were scored independently by E.C., J.R., and M.K., and any discrepancies between low or overexpression were resolved. For detection of p16, 5-μm deparaffinized and rehydrated sections were treated with 3% hydrogen peroxide (Sigma Aldrich, Poole, UK), Avidin Biotin blocking kit (Vector Laboratories, Peterborough, UK), and catalyzed signal amplification system (DakoCytomation, Buckinghamshire, UK). Primary antibody was mouse anti-p16 (Ab-7; Labvision, Suffolk, UK). Slides were counterstained with hematoxylin, dehy-drated, and mounted. Positive control for p16 expression was cervical carcinoma. p16 was scored as negative, heterogeneous, or strong expression inN50% of tumor cells as described[17].
Retroviral-Mediated Transduction
Retroviral transduction was performed as described previously
(5'-ACGCATGCATGCTTGCTTT-3') was cloned for use as a negative control [10]. pBabe-BMI1 for ectopic overexpression of BMI1 was a kind gift from Goberdhan Dimri and resulted in overexpression within the range of endogenous overexpression observed in primary UC.
Phenotypic Assays
Cells expressing senescence-associatedβgalactosidase were detect-ed using the senescent cells histochemical staining kit (Sigma, Poole, UK). At 200 × magnification, total and stained cells were counted within a 1-mm2area. Three unselected areas were counted in each of triplicate wells. For measurement of cumulative population dou-blings, cells were seeded at 3 × 10⁴cells per 9.6-cm2well in triplicate and passaged before confluence. Growth kinetics were examined during the log phase of growth. Anoikis, anchorage-independent colony formation, and induction of differentiation were assessed as described previously[14,19]. For assessment of adhesive capacity, 3 × 10⁴cells were seeded under standard conditions. After 30 minutes, adherent cells were trypsinized and counted. To assess migration, 7.5 × 10⁴ cells in unsupplemented medium were seeded onto triplicate 4.67-cm2, 0.8-μm–pore Transwells with complete growth medium below the Transwell (BD Biosciences, Oxford, U.K). After 48 hours, Transwells were fixed in methanol:acetone. Cells that had transversed the membrane were stained with diamidino-2-phenylindole and visualized at × 4. Images were recorded from four unselected areas of each Transwell, and cell number was scored using ImageJ particle analysis (imagej.nih.gov).
Telomerase Activity
Telomerase activity was quantified using the TRAPEZE XL Telomerase detection kit (Millipore, Watford, UK). Sample cell pellets and the control pellet provided with the kit were prepared from 1 × 10⁶cells and lysed with 200μl of CHAPS. Protein content of lysates was determined using the Biorad protein assay (Biorad, Hemel Hempstead, UK), and samples were diluted to 1μg of protein in 2μl of CHAPS. Samples were assayed in triplicate, and an aliquot of the sample was heat inactivated at 70°C as a negative control. Cycling conditions were as follows: 30°C for 30 minutes, 95°C for 2 minutes, followed by 45 cycles of 94°C for 15 seconds, 59°C for 1 minute, and 45°C for 35 seconds. Quantification was performed using an ABI PRISM 7500 Sequence detector.
Next-Generation Sequencing (NGS) for Copy Number Analysis
Libraries were prepared for sequencing using NEB NGS library preparation kits with custom tags in an updated version of methods found in Wood et al. (2010) [20]. Samples were pooled onto an Illumina HiSeq2500 for 2 × 101-bp sequencing. Sequence was trimmed to remove adapters using cutadapt[21]and then aligned to the human genome hg19 using Burrows-Wheeler alignment tool
[22]. Copy number was calculated by splitting the genome into equal-sized windows with an average of 400 reads per window and comparing ratio of tumor and normal samples, and plots were produced using CNAnorm [23] with breakpoints called using DNAcopy[24]. NHUC-BMI1 samples were compared with isogenic mock or vector transduced cells.
Expression Array Analysis
Gene expression analysis was performed using Affymetrix HG_U133 PLUS 2.0 arrays as described previously[6]. Data were
analyzed using Partek Genomics Suite 6.5 (Partek Inc., Missouri, USA). Genes differentially expressed in BMI1-transduced NHUC (NHUC-BMI1) compared with isogenic NHUC were identified using a two-sample t test. Genes consistently altered by at least two-fold in cells from both donors were identified (P b.05 and Q
false discovery rate b 0.1). This gene list was input into Metacore (www.http://thomsonreuters.com/metacore/ for further analysis.
Results
Up-Regulation of BMI1 Transcript in UC Cell Lines
and Primary Tumors
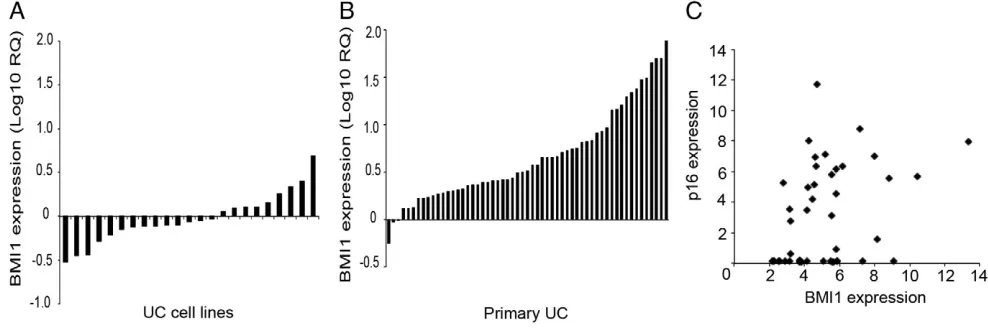
An initial screen of BMI1 expression by QRTPCR found overexpression in 9/23 (39%) UC cell lines (Figure 1A) and 55/57 (96%) of primary UC relative to NHUC (Figure 1B). There was no association between BMI1 transcript level and stage or grade in these primary tumors. Gene expression array analysis of UC cell lines (Hurst et al., manuscript in preparation) demonstrated that there was a slight positive correlation (P= .0146,r= 0.3617) between BMI1 and p16 transcript expression. This indicates concurrent expression of BMI1 and p16 rather than the negative correlation that would indicate BMI1-mediated repression of CDKN2A transcription (Figure 1C). BMI1 at 10p11.23 is not in a region commonly amplified in UC[25], and examination of copy number data for our UC cell line panel (unpublished data) confirmed that upregulation of BMI1 transcript expression was not due to genetic amplification or duplication in this region. Furthermore, analysis of cBioportal data confirmed ab2% rate of genetic amplification of BMI1 in bladder cancer andb5% in other tumor types analyzed (http://www.cbioportal.org).
BMI1 Protein Expression
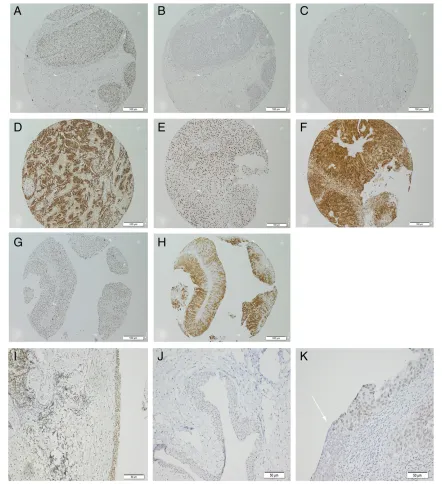
Having observed common upregulation of BMI1 transcript in UC and UC cell lines, we investigated protein expression in primary UC. Normal tonsil showed nuclear positivity in germinal regions as described previously[26](Supplementary Figure 1A). An additional positive control was human placenta (Supplementary Figure 1B). No primary antibody negative controls showed no staining (Supplementary Figure 1C), and in normal urothelium, BMI1 expression was absent, or nuclear and weak (Supplementary Figure 1,
T2G3 (2 cases). For 17 patients, there was an earlier and subsequent tumor in the panel. In 13 of these, the initial and recurrent tumor both had high expression of BMI1. In one case, BMI1 was low in the earlier tumor but upregulated in the later recurrence, and in two cases, it was high in the first presentation but low in the recurrence. Twenty-nine of 71 (40%) tumors in this panel had loss of p16 expression, which is concordant with the rate of homozygous deletion of the CDKN2A locus that we previously described in UC [17]. Twenty-eight of 71 (39%) cases showed coexpression of high levels of BMI1 and p16.
Common overexpression of BMI1 in UC was confirmed in an independent TMA panel comprising 28 pTaG1, 8 pTaG2, 4 pTaG3, 1 pTaGx, 5 pT1G2, 19 pT1G3, 19 pT2G3, 1 pT2Gx, 3 pT3G3, 1 pT3Gx, 4 pT4G3, and 1 pT4Gx. In this panel, 89/94 (95%) of tumors had overexpression of BMI1, and again there was no association between overexpression and tumor stage or grade (chi-square test,P≥ .05). Tumors of unknown grade or stage were not included in this analysis. Loss of p16 expression was observed in 43/94 (46%). Fifteen of 94 cases (16%) exhibited strong coexpression of p16 and BMI1, again indicating no significant transcriptional repression of theCDKN2Alocus.
Expression of BMI1 in Premalignant Bladder Lesions
and Carcinoma In Situ (CIS)
The observation that upregulation of BMI1 in UC was not associated with stage or grade indicates that it may be an early event in UC tumorigenesis. We hypothesized that, if this was the case, upregulation of BMI1 expression would also be detected in premalignant bladder lesions. We stained sections from the non– tumor-associated regions of the bladder in cystectomy specimens (n= 6) and noncancerous lesions that were detected at check cystoscopy in patients previously diagnosed with UC (n = 12). Upregulation of BMI1 was detected in examples of CIS (Figure 2,IandJ), chronic inflammation (in the absence or presence of CIS), and urothelium reported to show no evidence of malignancy (Supplementary Information 1). Areas of urothelium distant from the tumor in cystectomy specimens showed upregulation of BMI1 in CIS but not
normal urothelium. In one case, upregulated BMI1 expression was seen in CIS but not in the adjacent normal urothelium, delineating the margin of CIS (Figure 2K).
Immortalizing Effects of Ectopic Overexpression of BMI1
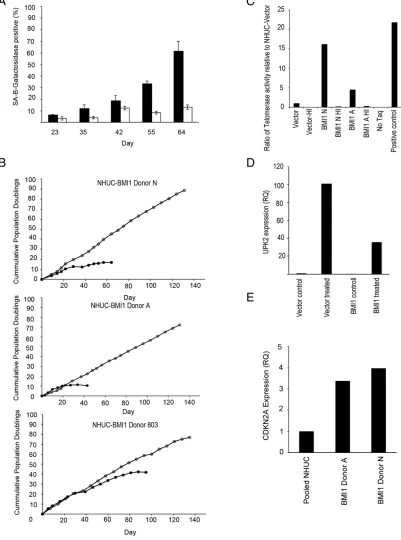
To investigate the role of BMI1 in urothelial tumorigenesis, retroviral transduction was used to stably overexpress BMI1 in NHUC. The resulting NHUC-BMI1 showed a bypass of replicative senescence, as determined by a lack of elevation of senescence-associated β galactosidase expression (Figure 3A). Ectopic expression of BMI1 appeared to immortalize NHUC from two initial donors (A and N) in a single step. Cells proliferated continuously for over 100 days (Figure 3B). Immortalization was then confirmed using NHUC from a third donor (803). NHUC-BMI1 cell lines did not exhibit anchorage-independent growth (data not shown).
Characterization of NHUC-BMI1
Using NGS for copy number analysis, between 2.4 and 4.7 million read pairs were produced per sample, equating to between 480 and 950 Mb of sequence or 0.16 to 0.32X coverage of the human genome. No copy number alterations were detected in NHUC-BMI1 from donors N and 803, but gains on chromosome 20 and 9q were found in NHUC-BMI1 from donor A (Supplementary Figure 2). Interestingly, an hTERT immortalized NHUC (TERT-NHUC) cell line previously derived from the same donor contained an abnormal clone with an unbalanced rearrangement of 20q (46,XY, add (20)(q12)) that resulted in partial loss of 20q and gain of unidentified material[18], suggesting a donor-specific effect rather than an event necessary for immortalization. Telomerase activity was greater in NHUC-BMI1 relative to empty vector transduced cells (Figure 3C). Previously, we have shown that NHUC immortalized by hTERT exhibit a reduced differentiation capacity[27]. Here, we found that induction of uroplakin 2, a marker of urothelial differentiation, was also repressed in NHUC immortalized by BMI1 compared with empty vector-transduced controls (Figure 3D).
Gene Expression Profile of NHUC-BMI1
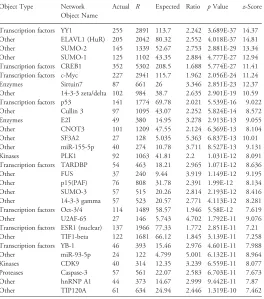
[image:4.612.58.552.50.217.2]isogenic NHUC control cells from both donors investigated (Supplementary Data 1). Transcription of the CDKN2A gene was not downregulated in NHUC-BMI1 as confirmed by QRTPCR (Figure 3E). Metacore enrichment analysis was used to examine how enriched the data set (Supplementary Data 1) is in a particular map or network within the program, taking into account the number of objects in the gene list, the number of objects in the map/network, and the number of objects within the entire Metacore database. Gene ontology processes, process networks, and diseases most overrepre-sented in the data set are shown in Supplementary Data 1. The top 30 upregulated and downregulated probes are shown inTable 1, and the top 30 overconnected genes are shown inTable 2. Reassuringly, this
analysis highlighted known functions of BMI1. The top process network was mRNA processing, and the top 7 disease-associated biomarkers identified were consistent with the known association of BMI1 upregulation in colorectal cancer.
[image:5.612.84.526.47.531.2]was upregulation of p90RSK, an activator of CREB1, coupled to overexpression of CREB1 targets. The top process network identified was cytoskeleton-actin filaments, and the top pathway map further implicated overexpression of BMI1 in altered phosphorylation events and subsequent effects on cytoskeleton remodeling (Figure 4). For example, NHUC-BMI1 exhibited overexpression of ROCK2 kinase. This upregulation is expected to impact on downstream actin-and tubulin-mediated cytoskeleton remodeling actin-and subsequent cellular migration.
Phenotypic Effects of BMI1 Expression
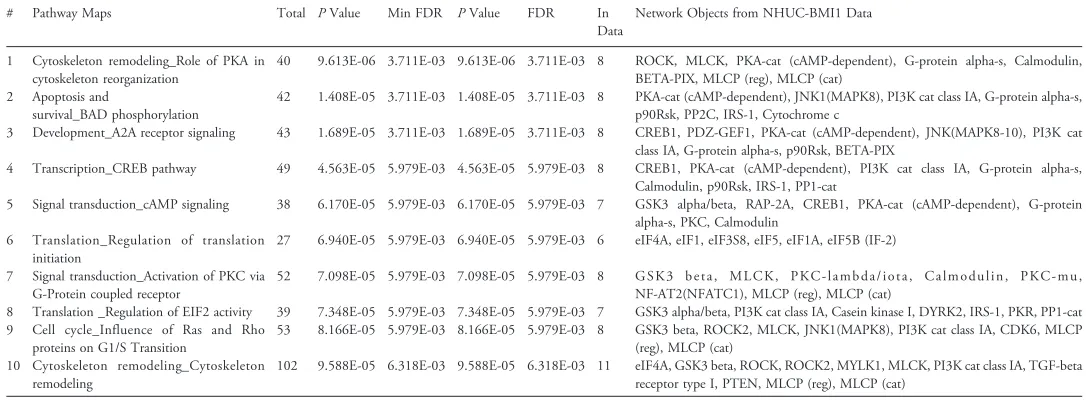
[image:7.612.312.576.71.370.2]Analysis of the NHUC-BMI1 gene list by protein function (Table 3) identified the key pathway map enriched in NHUC-BMI1 expression profile as “cytoskeleton remodeling_Role of PKA in cytoskeleton reorganisation”(Figure 4A). NHUC-BMI1 had down-regulation of PKA-cat, a protein responsible for the phosphorylation and deactivation ofα4/β1 integrin, a key molecule in cell adhesion. Downregulation of the deactivator of α4/β1 integrin would be expected to result in an increase in cellular adhesion. Indeed, overexpression of BMI1 in NHUC promoted adhesion under standard culture conditions (Figure 4B). Analysis of the overlap with the Meng et al. data set indicated that effects of BMI1 overexpression would include ROCK-mediated modulation of the cytoskeleton. Accordingly, NHUC-BMI1 had increased cellular motility as measured by Transwell migration (Figure 4C). Retroviral-mediated transduction was then used to stably downregulate BMI1 expression in the UC cell line 97-7. Table 1.Top 30 Upregulated and Downregulated Probes in Affymetrix Expression Array Analysis
Top 30 upregulated probes in NHUC-BMI1 relative to isogenic NHUC-vector
Donor 1 Donor 2 Average
Probeset ID Gene Symbol Fold Change
PValue Fold Change
PValue Fold Change
202237_at NNMT 176.00 4.48E-05 24.92 2.19E-03 100.46 202238_s_at NNMT 51.50 9.67E-06 21.41 8.08E-04 36.46 209949_at NCF2 4.30 3.51E-02 24.66 1.64E-03 14.48 210809_s_at POSTN 3.08 1.30E-01 25.74 3.76E-02 14.41 1560679_at LOC151438 21.13 5.02E-03 3.30 3.89E-01 12.22 225911_at NPNT 9.85 2.32E-04 13.28 1.58E-03 11.56 209351_at KRT14 14.65 5.71E-03 7.83 5.77E-02 11.24 201141_at GPNMB 2.05 4.97E-01 19.30 7.32E-02 10.68 219630_at PDZK1IP1 14.47 3.31E-05 6.83 1.35E-02 10.65 206912_at FOXE1 12.95 1.69E-05 6.84 4.51E-04 9.89 232861_at PDP2 9.89 1.77E-04 9.12 3.35E-04 9.51 220014_at PRR16 13.05 4.97E-05 5.76 2.78E-02 9.41 224823_at MYLK 6.94 3.05E-03 11.64 9.66E-04 9.29 244780_at SGPP2 2.80 1.11E-01 14.98 5.54E-02 8.89 231331_at – 11.28 2.45E-05 5.34 7.21E-04 8.31 202766_s_at FBN1 2.91 6.49E-03 13.49 7.69E-04 8.20 1553589_a_at PDZK1IP1 10.11 3.39E-04 6.09 8.71E-03 8.10 1556499_s_at COL1A1 5.76 1.56E-03 10.06 2.03E-03 7.91 214701_s_at FN1 12.13 1.22E-03 3.65 5.85E-02 7.89 228854_at – 3.43 1.77E-01 11.77 3.31E-02 7.60 219911_s_at SLCO4A1 8.13 1.27E-03 6.36 2.92E-03 7.25 213040_s_at NPTXR 4.06 1.57E-02 9.89 6.24E-04 6.98 236044_at PPAPDC1A 5.46 5.68E-03 8.32 3.46E-04 6.89 211478_s_at DPP4 4.93 6.20E-04 8.53 2.31E-03 6.73 226388_at TCEA3 6.40 4.22E-03 6.88 9.70E-04 6.64 205547_s_at TAGLN 2.34 2.51E-01 10.62 1.73E-02 6.48 226281_at DNER 2.12 3.72E-02 10.68 9.26E-03 6.40 213385_at CHN2 5.16 3.75E-03 7.62 4.38E-03 6.39 AFFX-DapX-5_at – 7.40 4.89E-04 5.33 1.21E-03 6.37 1555724_s_at TAGLN 2.18 2.51E-01 9.85 1.09E-02 6.01
Top 30 downregulated probes in NHUC-BMI1 relative to isogenic NHUC-vector
Donor 1 Donor 2 Average Probeset ID Gene Symbol Fold
Change
PValue Fold Change
PValue Fold Change
233011_at ANXA1 −19.86 5.33E-03 −47.91 5.49E-04 −33.88 202265_at BMI1* −26.36 1.79E-05 −41.21 2.76E-06 −33.79* 244026_at – −42.42 1.47E-04 −34.65 1.84E-04 −38.54 232113_at – −18.18 6.90E-03 −31.34 1.13E-03 −24.76 232541_at – −21.04 2.31E-04 −30.72 2.24E-04 −25.88 224567_x_at MALAT1 −25.83 1.55E-03 −25.61 2.05E-03 −25.72 226675_s_at MALAT1 −34.50 1.01E-03 −24.15 1.68E-03 −29.33 1558678_s_at MALAT1 −39.70 2.94E-04 −23.55 1.16E-03 −31.62 240815_at – −13.81 4.12E-05 −21.98 2.29E-04 −17.90 209550_at NDN −4.62 5.67E-04 −21.65 4.71E-05 −13.13 227062_at NCRNA00084 −19.22 8.02E-03 −21.58 1.97E-02 −20.40 219795_at SLC6A14 −5.89 2.17E-02 −20.82 4.19E-06 −13.36 224559_at MALAT1 −20.19 3.59E-04 −20.51 2.38E-03 −20.35 235592_at – −11.66 1.44E-03 −20.30 1.02E-05 −15.98 240038_at – −16.43 2.64E-05 −20.01 2.65E-05 −18.22 205513_at TCN1 −17.30 1.34E-03 −19.98 7.03E-05 −18.64 217523_at CD44 −14.96 1.19E-03 −19.86 4.83E-04 −17.41 236879_at – −23.07 8.36E-06 −19.48 2.27E-05 −21.28 236545_at – −9.68 8.53E-04 −19.12 6.65E-05 −14.40 233300_at – −12.36 4.85E-04 −18.34 5.70E-05 −15.35 220940_at ANKRD36B −14.52 6.40E-06 −17.71 3.15E-06 −16.12 231929_at IKZF2 −11.76 7.49E-03 −17.55 8.09E-05 −14.66 242476_at – −12.15 2.13E-05 −17.37 9.94E-05 −14.76 230746_s_at – −2.17 2.12E-01 −16.38 7.62E-03 −9.28 228483_s_at TAF9B −3.51 2.93E-03 −16.08 1.27E-03 −9.79 244741_s_at MGC9913 −4.71 5.82E-04 −15.78 3.08E-04 −10.24 236322_at – −22.66 4.14E-03 −15.54 1.15E-03 −19.10 230229_at DLG1 −11.57 2.47E-04 −15.47 1.38E-04 −13.52 235879_at MBNL1 −15.59 2.12E-05 −15.08 1.58E-04 −15.33 235138_at – −17.81 1.69E-04 −14.98 2.68E-04 −16.39
Fold change is expression in NHUC-BMI1 relative to the isogenic, empty vector transduced NHUC.
[image:7.612.38.297.409.719.2]* Endogenous BMI1 was downregulated in NHUC-BMI1. Retroviral-transduced BMI1 was not detected by the probe because it is located in the 3’UTR not expressed from the retroviral vector.
Table 2.Top 30 Overconnected Objects
Object Type Network Object Name
Actual R Expected Ratio pValue z-Score
Transcription factors YY1 255 2891 113.7 2.242 3.689E-37 14.37 Other ELAVL1 (HuR) 205 2042 80.32 2.552 4.018E-37 14.81 Other SUMO-2 145 1339 52.67 2.753 2.881E-29 13.34 Other SUMO-1 125 1102 43.35 2.884 4.777E-27 12.94 Transcription factors CREB1 352 5302 208.5 1.688 5.774E-27 11.41 Transcription factors c-Myc 227 2941 115.7 1.962 2.056E-24 11.24 Enzymes Sirtuin7 87 661 26 3.346 2.851E-23 12.37 Other 14-3-3 zeta/delta 102 984 38.7 2.635 2.901E-19 10.59 Transcription factors p53 141 1774 69.78 2.021 5.539E-16 9.022 Other Cullin 3 97 1095 43.07 2.252 5.824E-14 8.572 Enzymes E2I 49 380 14.95 3.278 2.913E-13 9.055 Other CNOT3 101 1209 47.55 2.124 6.369E-13 8.104 Other SF3A2 27 128 5.035 5.363 6.837E-13 10.01 Other miR-155-5p 40 274 10.78 3.711 8.527E-13 9.131 Kinases PLK1 92 1063 41.81 2.2 1.031E-12 8.091 Transcription factors TARDBP 54 463 18.21 2.965 1.071E-12 8.636 Other FUS 37 240 9.44 3.919 1.149E-12 9.195 Other p15(PAF) 76 808 31.78 2.391 1.99E-12 8.134 Other SUMO-3 57 515 20.26 2.814 2.193E-12 8.416 Other 14-3-3 gamma 57 523 20.57 2.771 4.113E-12 8.281 Transcription factors Oct-3/4 114 1489 58.57 1.946 5.58E-12 7.619 Other U2AF-65 27 146 5.743 4.702 1.792E-11 9.076 Transcription factors ESR1 (nuclear) 137 1966 77.33 1.772 2.851E-11 7.21 Other TIF1-beta 122 1681 66.12 1.845 3.139E-11 7.258 Transcription factors YB-1 46 393 15.46 2.976 4.601E-11 7.988 Other miR-93-5p 24 122 4.799 5.001 6.132E-11 8.964 Kinases CDK9 40 314 12.35 3.239 6.559E-11 8.077 Proteases Caspase-3 57 561 22.07 2.583 6.703E-11 7.673 Other hnRNP A1 44 373 14.67 2.999 9.442E-11 7.87 Other TIP120A 61 634 24.94 2.446 1.319E-10 7.462
This cell line was derived from a T1 G2/3 UC and has a low level of p16 that is considered functionally inactivated as it is coupled to hyperpho-sphorylated Rb [29]. Transduction of 97-7 with shBMI1-A or shBMI1-B resulted in 37% or 88% decreases in BMI1 transcript level, respectively. 97-7 siRNA B therefore had BMI1 levels reduced to slightly less than the endogenous level detectable in pooled NHUC. Knockdown of BMI1 repressed adhesion in 97-7 (Figure 4D) in contrast to the trend in increased adhesion seen with overexpression in NHUC.
Discussion
Overexpression of BMI1 is reported in many cancer types[30–33], and in some, its expression correlates with clinicopathological parameters [34–37]. However, its role in urothelial tumorigenesis has not been clearly defined, and conflicting data have arisen from existing studies. Following careful validation of IHC staining, we found nuclear overexpression of BMI1 in the majority of UC. Unlike previous studies [30,38], these IHC results were confirmed in a second independent tumor panel. There was no correlation of BMI1 protein expression with the stage or grade of the tumor, supporting our observation of no association of BMI1 transcript level with tumor stage or grade. Since our study was initiated, Liang et al. used the same BMI1 antibody, a smaller UC panel of differing stage and grade
distribution, and a different scoring system to investigate BMI1 expression in UC. In contrast to our results, an association of BMI1 expression with tumor stage and grade was reported[12]. To account for the effect of different scoring classification, we also performed statistical analysis using criteria equivalent to Liang et al. (grouping tumors as Ta, T1, and T2 + and staining of 0 or 1 vs 2 and 3). Still, we found no association of BMI1 expression with stage or grade, as was expected from the overall low frequency of BMI1-negative/low tumors in our panel.
Although extremely frequent, overexpression of BMI1 was not a ubiquitous event in UC. It is known that BMI1-negative tumors are a distinct subpopulation in Ewing’s sarcoma, with a distinct gene expression profile[39]. Only eight UCs in our original tumor panel and only five in the second TMA panel were BMI1 negative. The small numbers of tumors studied here make interpretation impossible, but it is conceivable that BMI1-negative tumors follow a distinct PRC1-independent pathway to tumorigenesis, and this is a subject worthy of further investigation.
[image:8.612.38.574.69.463.2]In hematological malignancy, BMI1 is targeted by chromosomal rearrangements[40], but in solid epithelial cancers, there is no evidence to support this. The 10p11.23 region is not a common site of amplification in UC[41], and accordingly, correlation between BMI1 copy number and overexpression in UC cell lines was not observed. Table 3.BMI1-Target Genes (Identified by Meng et al., 2010) Whose Expression Was Consistently Altered in NHUC-BMI1 Compared with NHUC
AIG1 Androgen-induced gene 1 protein KLHL42 Kelch-like protein 42 RPS6KA2 Ribosomal protein S6 kinase alpha-2 ALOXE3 Hydroperoxide isomerase ALOXE3 KMT2E Histone-lysine N-methyltransferase 2E RUFY2 RUN and FYVE domain-containing protein
2 AP4E1 Adaptor-Related Protein Complex 4,
Epsilon 1 Subunit
LMLN Leishmanolysin-like peptidase SEC14L1 SEC14-like protein 1
ARHGEF10 Rho guanine nucleotide exchange factor 10 LRPPRC Leucine-rich PPR motif-containing protein, mitochondrial SEC62 Translocation protein SEC62 ASXL1 Putative Polycomb group protein ASXL1 MAP4K4 Mitogen-activated protein kinase kinase kinase kinase 4 SEPT7 Septin-7
BAZ2B Bromodomain adjacent to zinc finger domain protein 2B
MBOAT2 Lysophospholipid acyltransferase 2 SKA2 Spindle and kinetochore-associated protein 2
BIRC6 Baculoviral IAP repeat-containing protein 6
MIPOL1 Mirror-image polydactyly gene 1 protein SOX6 Transcription factor SOX-6
CAMTA1 Calmodulin-binding transcription activator 1
MKLN1 Muskelin SRGAP2 SLIT-ROBO Rho GTPase-activating protein 2
CDK6 Cyclin-dependent kinase 6 MRPS10 28S ribosomal protein S10, mitochondrial SRRM2 Serine/arginine repetitive matrix protein 2 CFI Complement factor I MSI2 RNA-binding protein Musashi homolog 2 STAM2 Signal transducing adapter molecule 2 CLOCK Circadian locomoter output cycles protein
kaput
MTDH Protein LYRIC SUGCT Succinate-hydroxymethylglutarate CoA-transferase
CUX1 Homeobox protein cut-like 1 NBN Artemin (ARTN) SULF2 Extracellular sulfatase Sulf-2
DIP2A Disco-interacting protein 2 homolog A NBPF1 Neuroblastoma breakpoint family member 1 TACC2 Transforming acidic coiled-coil-containing protein 2
DST Dystonin NIN Ninein TC2N Tandem C2 domains nuclear protein
DYNC2H1 Cytoplasmic dynein 2 heavy chain 1 NT5C2 Cytosolic purine 5'-nucleotidase TCF12 Transcription factor 12 EHBP1 EH domain-binding protein 1 PAPOLA Poly(A) polymerase alpha THOC2 THO complex subunit 2 FAM120A Constitutive coactivator of
PPAR-gamma-like protein 1
PGGT1B Geranylgeranyl transferase type-1 subunit beta TMED10 Transmembrane emp24 domain-containing protein 10
FAM83F Protein FAM83F PIAS1 E3 SUMO-protein ligase PIAS1 TNS1 Tensin-1
FBN1 Fibrillin-1 PMS1 PMS1 protein homolog 1 TPRG1 Tumor protein p63-regulated gene 1 protein FBXO9 F-box only protein 9 PPAPDC1A Phosphatidate phosphatase PPAPDC1A TRIM33 E3 ubiquitin-protein ligase TRIM33 FGD6 FYVE, RhoGEF and PH
domain-containing protein 6
PPM1D Protein phosphatase 1D UFL1 E3 UFM1-protein ligase 1
FKBP5 Peptidyl-prolyl cis-trans isomerase FKBP5 PPP2R2C Serine/threonine-protein phosphatase 2A 55 kDa regulatory subunit B gamma isoform
USP34 Ubiquitin carboxyl-terminal hydrolase 34
FOXA1 Hepatocyte nuclear factor 3-alpha PSMD14 26S proteasome non-ATPase regulatory subunit 14 UTRN Utrophin
FRMD4A FERM domain-containing protein 4A PSMG1 Proteasome assembly chaperone 1 VMP1 Vacuole membrane protein 1
GOLGA8B Golgin subfamily A member 8B QPCT Glutaminyl-peptide cyclotransferase VPS13B Vacuolar protein sorting-associated protein 13B
GPD2 Glycerol-3-phosphate dehydrogenase, mitochondrial
RAB18 Ras-related protein Rab-18 VTA1 Vacuolar protein sorting-associated protein VTA1 homolog
GRB10 Growth factor receptor-bound protein 10 RAB3GAP2 Rab3 GTPase-activating protein non-catalytic subunit WBSCR27 Williams-Beuren syndrome chromosomal region 27 protein
H2AFY Core histone macro-H2A.1 RASAL1 RasGAP-activating-like protein 1 ZMYND8 Protein kinase C-binding protein 1 IFT80 Intraflagellar transport protein 80 homolog RNF213 E3 ubiquitin-protein ligase RNF213
Previously, we observed upregulation of BMI1 in telomerase-im-mortalized normal human urothelial cells during experiments aimed at modeling the early steps in bladder tumor development[6]. Our results indicate that upregulation of BMI1 is an early event in UC development. We consider that, in bladder cancer patients, the entire urothelium is altered because of the spread of tumor and premalignant cells. Initiation of MIBC arises from a CIS precursor lesion which expands to colonize the urothelium [42]. BMI1 expression was examined in a pilot study of premalignant bladder lesions including CIS. BMI1 was upregulated in a subset. Previous studies also support the notion of upregulation of BMI1 in potentially
[image:9.612.58.544.47.505.2]and is thought to act through p16-independent mechanisms[45]. As suggested by Kang et al., the detection of BMI1 has potential for use in the identification of potentially premalignant lesions. Of note, in our study, the patient from whom the check cystoscopy biopsy that was classified as“no evidence of malignancy”by standard histological analysis and showed strong nuclear BMI1 upregulation was derived went on to develop fatal metastatic UC. Whether upregulation of BMI1 in potentially premalignant lesions is predictive of outcome is currently unknown, but further investigation of the significance of detection of BMI1 is planned.
BMI1 is commonly cited as being a transcriptional repressor of the CDKN2A locus. The promoter of p16 contains a BMI1 responding unit, and BMI1 and p16 expression correlate in some tumor types [28]. We have previously shown that, in UC, downregulation of p16 expression is most often associated with homozygous deletion or loss of heterozygosity of the 9p21 region, and it is this rather than transcriptional repression which may be key in determining the p16 level [17]. Indeed, in the whole tumor section panel, 28 UCs exhibited strong expression of both BMI1 and p16, and coexpression was confirmed in the second TMA panel.
Having established upregulation of BMI1 as a frequent and potentially early event in bladder cancer, we set out to investigate the phenotypic significance of its overexpression in NHUC. In vitro, overexpression of BMI1 induced telomerase activity (as is reported for mammary epithelial cells[49]) and immortalized NHUC without the need for silencing of p16. Similarly, in Ewing’s sarcoma, the actions of BMI1 are independent of repression of p16 expression[10]. Overexpression of BMI1 alone also immortalizes nasopharyngeal epithelial cells[47], whereas in other human cell types, expression of hTERT[48]or prior silencing of p16 is also required[49]. The fact that BMI1 and hTERT are required for immortalization of some cell types such as gingival keratinocytes [50] indicates that the role of BMI1 in tumorigenesis is greater than merely induction of telomerase activity and its subsequent downstream effects. In UC, it appears that the functions of BMI1 in tumorigenesis also extend beyond suppression of theCDKN2Alocus.
Gene expression analysis of NHUC-BMI1 was performed to investigate the potential transcriptional effects of BMI1 in urothelial
tumorigenesis. A profile of genes consistently altered in BMI1-transduced cells was obtained. The NHUC-BMI1 gene list was subjected to Metacore analyses. The most significant process network affected was transcription and mRNA processing, supporting the wealth of existing literature describing BMI1 as a key molecule in control of downstream gene expression. Chromatin remodeling genes have been shown to be frequent targets of mutation in UC [51]. Notably, downregulation of transcripts for chromodomain-helicase DNA binding protein 1 (CHD1), CHD1L, CHD2, CHD7, and CHD9 was observed. CHD2 is proposed as a tumor suppressor gene that regulates DNA damage response[52]. Interestingly, TCGA data show that 9% of bladder carcinomas exhibit mutation in this gene (www.cbioportal.org).
The key pathway map enriched in NHUC-BMI1 expression profile was “cytoskeleton remodeling_Role of PKA in cytoskeleton reorganisation”. Epithelial–mesenchymal transition is a multistep process by which epithelial cells acquire migratory and invasive properties, and in some cell types, activation of BMI1 is required for epithelial–mesenchymal transition[53]. The ability of mesenchymal-like migration, as observed in cancer cells, relies on an intricate balance between adhesion assembly and disassembly. Overexpression of BMI1 led to downregulation of PKA-cat. This molecule is responsible for the phosphorylation and deactivation of α4/β1 integrin, a key molecule in cell adhesion. The resulting BMI1-transduced cells had increased adhesion coupled to enhanced cellular migration. Our results support the recent report that knockdown of BMI1 in the T24 UC cell line inhibits invasionin vitro[12]and may represent an action of BMI1 that is more relevant to the later stages of cancer development.
[image:10.612.35.578.71.272.2]Using Metacore, data were analyzed to identify interactions of the BMI1-associated changes in gene expression by protein function. YY1, a transcription factor and key component of the polycomb initiation complex PRC2, was the most significant network object. In concordance with published literature, genes that interacted with c-Myc, p53, and ESR1 were overrepresented. However, a novel finding was that genes that were targets of cyclic AMP-responsive element binding protein 1 (CREB1) were highly overrepresented and both CREB1 and its target genes were downregulated in NHUC-BMI1. The CREB signaling pathway potentially modulates Table 4.Analysis of NHUC-BMI1 Gene List by Protein Function
# Pathway Maps Total PValue Min FDR PValue FDR In Data
Network Objects from NHUC-BMI1 Data
1 Cytoskeleton remodeling_Role of PKA in cytoskeleton reorganization
40 9.613E-06 3.711E-03 9.613E-06 3.711E-03 8 ROCK, MLCK, PKA-cat (cAMP-dependent), G-protein alpha-s, Calmodulin, BETA-PIX, MLCP (reg), MLCP (cat)
2 Apoptosis and
survival_BAD phosphorylation
42 1.408E-05 3.711E-03 1.408E-05 3.711E-03 8 PKA-cat (cAMP-dependent), JNK1(MAPK8), PI3K cat class IA, G-protein alpha-s, p90Rsk, PP2C, IRS-1, Cytochrome c
3 Development_A2A receptor signaling 43 1.689E-05 3.711E-03 1.689E-05 3.711E-03 8 CREB1, PDZ-GEF1, PKA-cat (cAMP-dependent), JNK(MAPK8-10), PI3K cat class IA, G-protein alpha-s, p90Rsk, BETA-PIX
4 Transcription_CREB pathway 49 4.563E-05 5.979E-03 4.563E-05 5.979E-03 8 CREB1, PKA-cat (cAMP-dependent), PI3K cat class IA, G-protein alpha-s, Calmodulin, p90Rsk, IRS-1, PP1-cat
5 Signal transduction_cAMP signaling 38 6.170E-05 5.979E-03 6.170E-05 5.979E-03 7 GSK3 alpha/beta, RAP-2A, CREB1, PKA-cat (cAMP-dependent), G-protein alpha-s, PKC, Calmodulin
6 Translation_Regulation of translation initiation
27 6.940E-05 5.979E-03 6.940E-05 5.979E-03 6 eIF4A, eIF1, eIF3S8, eIF5, eIF1A, eIF5B (IF-2)
7 Signal transduction_Activation of PKC via G-Protein coupled receptor
52 7.098E-05 5.979E-03 7.098E-05 5.979E-03 8 G S K 3 b e t a , M L C K , P K C - l a m b d a / i o t a , C a l m o d u l i n , P K C - m u , NF-AT2(NFATC1), MLCP (reg), MLCP (cat)
8 Translation _Regulation of EIF2 activity 39 7.348E-05 5.979E-03 7.348E-05 5.979E-03 7 GSK3 alpha/beta, PI3K cat class IA, Casein kinase I, DYRK2, IRS-1, PKR, PP1-cat 9 Cell cycle_Influence of Ras and Rho
proteins on G1/S Transition
53 8.166E-05 5.979E-03 8.166E-05 5.979E-03 8 GSK3 beta, ROCK2, MLCK, JNK1(MAPK8), PI3K cat class IA, CDK6, MLCP (reg), MLCP (cat)
10 Cytoskeleton remodeling_Cytoskeleton remodeling
up to 25% of human genes[54]. CREB-mediated transcription is activated through cAMP-induced phospohorylation, and NHUC-BMI1 had upregulation of p90RSK kinase, a known CREB1 activator.
Having identified a“profile”of BMI1-associated changes in gene expression in NHUC, we compared this with other BMI1-associated signatures in other cell types and contexts. An 11-gene BMI1 pathway gene signature has been identified in metastatic prostate cancer and neural stem cells and is predictive of poor outcome in multiple tumor types including bladder [55]. We found that only one of these signature genes, encoding the ankyrin protein (ANK3), was also altered in NHUC-BMI1. The NHUC-BMI1 gene expression profile did show downregulation of 3 of the 11 previously identified telomerase “signature genes” [6] in NHUC (TSPYL5, NME5, CEACAM6) and the putative tumor suppressor gene NDN [14], suggesting cell type– and cell context–specific effects. In particular, loss of CEACAM6 (CD66c) expression has been associated with the so-called“highly tumorigenic basal cell compartment”of UC, which is believed to exhibit stem cell–like properties[56]. CEACAM6 was downregulated in both TERT-NHUC [6] and NHUC-BMI1, suggesting that, to some extent, these immortal cell lines resemble
“stem cell–like”cells. BMI1 is overexpressed in human bladder cancer stem cell–like populations. In these cells, knockdown of BMI1 inhibited proliferation, migration, and tumor sphere formation; increased cisplatin sensitivity; and is essential for their tumorigenicity in mouse models[57].
BMI1 is a target for the development of novel small molecule inhibitors[58]and also a transcriptional target of histone deacetylase inhibitor drugs[59]. BMI1-null mice gradually succumb because of a progressive neurological and hematopoietic dysfunction [60] pre-sumably due to stem cell dysfunction. As with many conventional cancer treatments, it would be expected that a BMI1 inhibitor would be toxic to normal human adult stem cells in addition to targeting tumor cells. However, an increased knowledge of the downstream effects of BMI1 on gene expression may aid the development of alternative strategies with a lower toxicity or indicate ways to ameliorate the side effects of BMI1 inhibition. If overexpression of BMI1 is a key feature of CIS, identification of BMI1-associated changes in gene expression could point toward pathways that could be targeted in this highly clinically relevant subpopulation.
Conclusion
BMI1 has many p16-independent actions that may contribute to neoplasia. As a key modulator of gene expression, cellular phenotype, and keystone signaling pathways, BMI1 is worthy of future investigation as a therapeutic target in UC. Future studies are required to confirm of the role of BMI1 inα4/β1 integrin-mediated adhesion, kinase-mediated changes in cytoskeleton, and CREB-1 transcriptional regulation in cancer. Further analysis of BMI1 expression in premalignant bladder lesions and its correlation with outcome and expression in subsequent tumors is merited.
Supplementary data to this article can be found online athttp://dx. doi.org/10.1016/j.tranon.2015.08.002.
Acknowledgements
We gratefully acknowledge the patients who donated tissue and data for research as without them this study would not have been possible. We thank Filomena Esteves for performing immunohistochemistry. NGS library preparation was performed by Phil Egan and NGS by the University of Leeds, Next-Generation Sequencing Facility.
pBabe-BMI1 puro plasmid was a kind gift from Goberdhan Dimri, The George Washington University Medical Center, Washington, USA. BMI1 shRNA plus nonsilencing control plasmids was a kind gift from Elizabeth Lawlor, University of Michigan, USA. Telomerase quantification was performed using a modified protocol for the TRAPEZE XL Telomerase quantification kit, as recom-mended by Samantha Brownhill of the Children’s Cancer Research Group, Leeds. This work was sponsored by Yorkshire Cancer Research project grant L355 (L.D.F., E.C.).
References
[1] Ferlay J, Soerjomataram I, Ervik M, Dikshit R, Eser S, Mathers C, Rebelo M, Parkin DM, Forman D, and Bray F (2013). GLOBOCAN 2012 v1.0, Cancer Incidence and Mortality Worldwide: IARC CancerBase No. 11 [Internet]. Lyon, France: International Agency for Research on Cancer; 2013 [[cited 2013]. Available from: http://globocan.iarc.fr].
[2] Knowles MA and Hurst CD (2014). Molecular biology of bladder cancer: new insights into pathogenesis and clinical diversity.Nat Rev Cancer15(1), 25–41 [PubMed PMID: 25533674].
[3] Sangar VK, Ragavan N, Matanhelia SS, Watson MW, and Blades RA (2005). The economic consequences of prostate and bladder cancer in the UK.BJU Int 95(1), 59–63 [PubMed PMID: 15638895].
[4] Engelhardt M, Drullinsky P, Guillem J, and Moore MA (1997). Telomerase and telomere length in the development and progression of premalignant lesions to colorectal cancer.Clin Cancer Res3(11), 1931–1941 [PubMed PMID: 9815582. Epub 1998/11/17. eng].
[5] Kolquist KA, Ellisen LW, Counter CM, Meyerson M, Tan LK, Weinberg RA, Haber DA, and Gerald WL (1998). Expression of TERT in early premalignant lesions and a subset of cells in normal tissues. Nat Genet 19(2), 182–186 [PubMed PMID: 9620778. Epub 1998/06/10. eng].
[6] Chapman EJ, Kelly G, and Knowles MA (2008). Genes involved in differentiation, stem cell renewal, and tumorigenesis are modulated in telomerase-immortalized human urothelial cells. Mol Cancer Res 6(7), 1154–1168 [PubMed PMID: 18644980. Epub 2008/07/23. eng].
[7] Li Z, Cao R, Wang M, Myers MP, Zhang Y, and Xu RM (2006). Structure of a Bmi-1-Ring1B polycomb group ubiquitin ligase complex.J Biol Chem281(29), 20643–20649 [PubMed PMID: 16714294].
[8] Cao R, Tsukada Y, and Zhang Y (2005). Role of Bmi-1 and Ring1A in H2A ubiquitylation and Hox gene silencing. Mol Cell20(6), 845–854 [PubMed PMID: 16359901].
[9] Fan C, He L, Kapoor A, Gillis A, Rybak AP, Cutz JC, and Tang D (2008). Bmi1 promotes prostate tumorigenesis via inhibiting p16(INK4A) and p14(ARF) expression. Biochim Biophys Acta 1782(11), 642–648 [PubMed PMID: 18817867].
[10] Douglas D, Hsu JH, Hung L, Cooper A, Abdueva D, van Doorninck J, Peng G, Shimada H, Triche TJ, and Lawlor ER (2008). BMI-1 promotes ewing sarcoma tumorigenicity independent of CDKN2A repression. Cancer Res 68(16), 6507–6515 [PubMed PMID: 18701473. Epub 2008/08/15. eng].
[11] Bruggeman SW, Hulsman D, Tanger E, Buckle T, Blom M, Zevenhoven J, van Tellingen O, and van Lohuizen M (2007). Bmi1 controls tumor development in an Ink4a/Arf-independent manner in a mouse model for glioma.Cancer Cell 12(4), 328–341 [PubMed PMID: 17936558. Epub 2007/10/16. eng].
[12] Liang W, Zhu D, Cui X, Su J, Liu H, Han J, Zhao F, and Xie W (2013). Knockdown BMI1 expression inhibits proliferation and invasion in human bladder cancer T24 cells.Mol Cell Biochem382(1-2), 283–291 [PubMed PMID: 23820733. Pubmed Central PMCID: 3771375].
[13] Kreso A, van Galen P, Pedley NM, Lima-Fernandes E, Frelin C, Davis T, Cao L, Baiazitov R, Du W, and Sydorenko N, et al (2014). Self-renewal as a therapeutic target in human colorectal cancer.Nat Med20(1), 29–36 [PubMed PMID: 24292392].
[14] De Faveri LE, Hurst CD, Platt FM, Taylor CF, Roulson JA, Sanchez-Carbayo M, Knowles MA, and Chapman EJ (2013). Putative tumour suppressor gene necdin is hypermethylated and mutated in human cancer.Br J Cancer108(6), 1368–1377 [PubMed PMID: 23549060. Pubmed Central PMCID: 3619261. Epub 2013/04/04. eng].
[16] McShane LM, Altman DG, Sauerbrei W, Taube SE, Gion M, and Clark GM (2005). Statistics Subcommittee of the NCIEWGoCD. REporting recommen-dations for tumor MARKer prognostic studies (REMARK).Nat Clin Pract Oncol 2(8), 416–422 [PubMed PMID: 16130938].
[17] Chapman EJ, Harnden P, Chambers P, Johnston C, and Knowles MA (2005). Comprehensive analysis of CDKN2A status in microdissected urothelial cell carcinoma reveals potential haploinsufficiency, a high frequency of homozygous co-deletion and associations with clinical phenotype.Clin Cancer Res11(16), 5740–5747 [PubMed PMID: 16115911. Epub 2005/08/24. eng].
[18] Chapman EJ, Hurst CD, Pitt E, Chambers P, Aveyard JS, and Knowles MA (2006). Expression of hTERT immortalises normal human urothelial cells without inactivation of the p16/Rb pathway.Oncogene 25(36), 5037–5045 [PubMed PMID: 16619045. Epub 2006/04/19. eng].
[19] Varley CL, Stahlschmidt J, Lee WC, Holder J, Diggle C, Selby PJ, Trejdosiewicz LK, and Southgate J (2004). Role of PPARgamma and EGFR signalling in the urothelial terminal differentiation programme.J Cell Sci117(Pt 10), 2029–2036 [PubMed PMID: 15054105. Epub 2004/04/01. eng].
[20] Wood HM, Belvedere O, Conway C, Daly C, Chalkley R, Bickerdike M, McKinley C, Egan P, Ross L, and Hayward B, et al (2010). Using next-generation sequencing for high resolution multiplex analysis of copy number variation from nanogram quantities of DNA from formalin-fixed paraffin-embedded specimens.Nucleic Acids Res38(14), e151 [PubMed PMID: 20525786. Pubmed Central PMCID: 2919738].
[21] Martin M (2011). Cutadapt removes adapter reads from high-throughput sequencng reads.EMBnet17(1), 10–12.
[22] Li H and Durbin R (2009). Fast and accurate short read alignment with Burrows-Wheeler transform. Bioinformatics 25(14), 1754–1760 [PubMed PMID: 19451168. Pubmed Central PMCID: 2705234].
[23] Gusnanto A, Wood HM, Pawitan Y, Rabbitts P, and Berri S (2012). Correcting for cancer genome size and tumour cell content enables better estimation of copy number alterations from next-generation sequence data.Bioinformatics28(1), 40–47 [PubMed PMID: 22039209].
[24] Venkatraman ES and Olshen AB (2007). A faster circular binary segmentation algorithm for the analysis of array CGH data.Bioinformatics23(6), 657–663 [PubMed PMID: 17234643].
[25] Hurst CD, Platt FM, Taylor CF, and Knowles MA (2012). Novel tumor subgroups of urothelial carcinoma of the bladder defined by integrated genomic analysis.Clin Cancer Res18(21), 5865–5877 [PubMed PMID: 22932667].
[26] Raaphorst FM, van Kemenade FJ, Fieret E, Hamer KM, Satijn DP, Otte AP, and Meijer CJ (2000). Cutting edge: polycomb gene expression patterns reflect distinct B cell differentiation stages in human germinal centers.J Immunol 164(1), 1–4 [PubMed PMID: 10604983].
[27] Aaboe M, Marcussen N, Jensen KM, Thykjaer T, Dyrskjot L, and Orntoft TF (2005). Gene expression profiling of noninvasive primary urothelial tumours using microarrays.Br J Cancer93(10), 1182–1190 [PubMed PMID: 16265353. Epub 2005/11/03. eng].
[28] Meng S, Luo M, Sun H, Yu X, Shen M, Zhang Q, Zhou R, Ju X, Tao W, and Liu D, et al (2010). Identification and characterization of Bmi-1-responding element within the human p16 promoter.J Biol Chem285(43), 33219–33229 [PubMed PMID: 20551323. Pubmed Central PMCID: 2963359].
[29] Sarkar S, Julicher KP, Burger MS, Della Valle V, Larsen CJ, Yeager TR, Grossman TB, Nickells RW, Protzel C, and Jarrard DF, et al (2000). Different combinations of genetic/epigenetic alterations inactivate the p53 and pRb pathways in invasive human bladder cancers.Cancer Res60(14), 3862–3871 [PubMed PMID: 10919661. Epub 2000/08/05. eng].
[30] Qin ZK, Yang JA, Ye YL, Zhang X, Xu LH, Zhou FJ, Han H, Liu ZW, Song LB, and Zeng MS (2009). Expression of Bmi-1 is a prognostic marker in bladder cancer.BMC Cancer9, 61 [PubMed PMID: 19228380. Pubmed Central PMCID: 2652492].
[31] Wang Y, Zhe H, Ding Z, Gao P, Zhang N, and Li G (2012). Cancer stem cell marker Bmi-1 expression is associated with basal-like phenotype and poor survival in breast cancer.World J Surg36(5), 1189–1194 [PubMed PMID: 22366984].
[32] Abd El Hafez A and El-Hadaad HA (2014). Immunohistochemical expression and prognostic relevance of Bmi-1, a stem cell factor, in epithelial ovarian cancer.
Ann Diagn Pathol18(2), 58–62 [PubMed PMID: 24342665].
[33] Vonlanthen S, Heighway J, Altermatt HJ, Gugger M, Kappeler A, Borner MM, van Lohuizen M, and Betticher DC (2001). The bmi-1 oncoprotein is differentially expressed in non-small cell lung cancer and correlates with INK4A-ARF locus expression.Br J Cancer84(10), 1372–1376 [PubMed PMID: 11355949. Epub 2001/05/18. eng].
[34] Mihara K, Chowdhury M, Nakaju N, Hidani S, Ihara A, Hyodo H, Yasunaga S, Takihara Y, and Kimura A (2006). Bmi-1 is useful as a novel molecular marker
for predicting progression of myelodysplastic syndrome and patient prognosis.
Blood107(1), 305–308 [PubMed PMID: 16160010. Epub 2005/09/15. eng].
[35] Chowdhury M, Mihara K, Yasunaga S, Ohtaki M, Takihara Y, and Kimura A (2007). Expression of Polycomb-group (PcG) protein BMI-1 predicts prognosis in patients with acute myeloid leukemia.Leukemia21(5), 1116–1122 [PubMed PMID: 17377594].
[36] Liu JH, Song LB, Zhang X, Guo BH, Feng Y, Li XX, Liao WT, Zeng MS, and Huang KH (2008). Bmi-1 expression predicts prognosis for patients with gastric carcinoma.
J Surg Oncol97(3), 267–272 [PubMed PMID: 18041745. Epub 2007/11/29. eng].
[37] Wang H, Pan K, Zhang HK, Weng DS, Zhou J, Li JJ, Huang W, Song HF, Chen MS, and Xia JC (2008). Increased polycomb-group oncogene Bmi-1 expression correlates with poor prognosis in hepatocellular carcinoma.J Cancer Res Clin Oncol134(5), 535–541 [PubMed PMID: 17917742. Epub 2007/10/06. Eng].
[38] Shafaroudi AM, Mowla SJ, Ziaee SA, Bahrami AR, Atlasi Y, and Malakootian M (2008). Overexpression of BMI1, a polycomb group repressor protein, in bladder tumors: a preliminary report.Urol J5(2), 99–105 [PubMed PMID: 18592462. Epub 2008/07/02. eng].
[39] Cooper A, van Doorninck J, Ji L, Russell D, Ladanyi M, Shimada H, Krailo M, Womer RB, Hsu JH, and Thomas D, et al (2011). Ewing tumors that do not overexpress BMI-1 are a distinct molecular subclass with variant biology: a report from the Children's Oncology Group.Clin Cancer Res17(1), 56–66 [PubMed PMID: 21047978. Pubmed Central PMCID: 3711406].
[40] Rouhigharabaei L, Ferreiro JF, Put N, Michaux L, Tousseyn T, Lefebvre C, Gardiner A, De Kelver W, Demuynck H, and Verschuere J, et al (2013). BMI1, the polycomb-group gene, is recurrently targeted by genomic rearrangements in progressive B-cell leukemia/lymphoma. Genes Chromosomes Cancer 52(10), 928–944 [PubMed PMID: 23873701].
[41] Lindgren D, Sjodahl G, Lauss M, Staaf J, Chebil G, Lovgren K, Gudjonsson S, Liedberg F, Patschan O, and Mansson W, et al (2012). Integrated genomic and gene expression profiling identifies two major genomic circuits in urothelial carcinoma. PLoS One 7(6), e38863 [PubMed PMID: 22685613. Pubmed Central PMCID: 3369837].
[42] McConkey DJ, Lee S, Choi W, Tran M, Majewski T, Lee S, Siefker-Radtke A, Dinney C, and Czerniak B (2010). Molecular genetics of bladder cancer: Emerging mechanisms of tumor initiation and progression.Urol Oncol28(4), 429–440 [PubMed PMID: 20610280. Pubmed Central PMCID: 2901550].
[43] Breuer RH, Snijders PJ, Sutedja GT, Sewalt RG, Otte AP, Postmus PE, Meijer CJ, Raaphorst FM, and Smit EF (2005). Expression of the p16(INK4a) gene product, methylation of the p16(INK4a) promoter region and expression of the polycomb-group gene BMI-1 in squamous cell lung carcinoma and premalignant endobronchial lesions.Lung Cancer48(3), 299–306 [PubMed PMID: 15892997].
[44] Tateishi K, Ohta M, Kanai F, Guleng B, Tanaka Y, Asaoka Y, Tada M, Seto M, Jazag A, and Lianjie L, et al (2006). Dysregulated expression of stem cell factor Bmi1 in precancerous lesions of the gastrointestinal tract.Clin Cancer Res12(23), 6960–6966 [PubMed PMID: 17145814].
[45] Kang MK, Kim RH, Kim SJ, Yip FK, Shin KH, Dimri GP, Christensen R, Han T, and Park NH (2007). Elevated Bmi-1 expression is associated with dysplastic cell transformation during oral carcinogenesis and is required for cancer cell replication and survival.Br J Cancer96(1), 126–133 [PubMed PMID: 17179983. Epub 2006/12/21. eng].
[46] Choy B, Bandla S, Xia Y, Tan D, Pennathur A, Luketich JD, Godfrey TE, Peters JH, Sun J, and Zhou Z (2012). Clinicopathologic characteristics of high expression of Bmi-1 in esophageal adenocarcinoma and squamous cell carcinoma.BMC Gastroenterol 12, 146 [PubMed PMID: 23078618. Pubmed Central PMCID: 3544684].
[47] Dimri GP, Martinez JL, Jacobs JJ, Keblusek P, Itahana K, Van Lohuizen M, Campisi J, Wazer DE, and Band V (2002). The Bmi-1 oncogene induces telomerase activity and immortalizes human mammary epithelial cells.Cancer Res 62(16), 4736–4745 [PubMed PMID: 12183433. Epub 2002/08/17. eng].
[48] Song LB, Zeng MS, Liao WT, Zhang L, Mo HY, Liu WL, Shao JY, Wu QL, Li MZ, and Xia YF, et al (2006). Bmi-1 is a novel molecular marker of nasopharyngeal carcinoma progression and immortalizes primary human nasopharyngeal epithelial cells. Cancer Res 66(12), 6225–6232 [PubMed PMID: 16778197. Epub 2006/06/17. eng].
[49] Saito M, Handa K, Kiyono T, Hattori S, Yokoi T, Tsubakimoto T, Harada H, Noguchi T, Toyoda M, and Sato S, et al (2005). Immortalization of cementoblast progenitor cells with Bmi-1 and TERT.J Bone Miner Res20(1), 50–57 [PubMed PMID: 15619669].
[51] Gui Y, Guo G, Huang Y, Hu X, Tang A, Gao S, Wu R, Chen C, Li X, and Zhou L, et al (2011). Frequent mutations of chromatin remodeling genes in transitional cell carcinoma of the bladder.Nat Genet43(9), 875–878 [PubMed PMID: 21822268].
[52] Nagarajan P, Onami TM, Rajagopalan S, Kania S, Donnell R, and Venkatachalam S (2009). Role of chromodomain helicase DNA-binding protein 2 in DNA damage response signaling and tumorigenesis.Oncogene 28(8), 1053–1062 [PubMed PMID: 19137022. Pubmed Central PMCID: 2648865].
[53] Qiao B, Chen Z, Hu F, Tao Q, and Lam AK (2013). BMI-1 activation is crucial in hTERT-induced epithelial-mesenchymal transition of oral epithelial cells.Exp Mol Pathol95(1), 57–61 [PubMed PMID: 23712029].
[54] Altarejos JY and Montminy M (2011). CREB and the CRTC co-activators: sensors for hormonal and metabolic signals. Nat Rev Mol Cell Biol 12(3), 141–151 [PubMed PMID: 21346730].
[55] Glinsky GV, Berezovska O, and Glinskii AB (2005). Microarray analysis identifies a death-from-cancer signature predicting therapy failure in patients with multiple types of cancer.J Clin Invest115(6), 1503–1521 [PubMed PMID: 15931389. Epub 2005/06/03. eng].
[56] He X, Marchionni L, Hansel DE, Yu W, Sood A, Yang J, Parmigiani G, Matsui W, and Berman DM (2009). Differentiation of a highly tumorigenic basal cell compartment in urothelial carcinoma.Stem Cells27(7), 1487–1495 [PubMed PMID: 19544456. Pubmed Central PMCID: 3060766].
[57] Zhu D, Wan X, Huang H, Chen X, Liang W, Zhao F, Lin T, Han J, and Xie W (2014). Knockdown of Bmi1 inhibits the stemness properties and tumorigenicity of human bladder cancer stem cell-like side population cells.Oncol Rep31(2), 727–736 [PubMed PMID: 24337040].
[58] Cao L, Bombard J, Cintron K, Sheedy J, Weetall ML, and Davis TW (2011). BMI1 as a novel target for drug discovery in cancer.J Cell Biochem112(10), 2729–2741 [PubMed PMID: 21678481].
[59] Bommi PV, Dimri M, Sahasrabuddhe AA, Khandekar J, and Dimri GP (2010). The polycomb group protein BMI1 is a transcriptional target of HDAC inhibitors.Cell Cycle 9(13), 2663–2673 [PubMed PMID: 20543557. Pubmed Central PMCID: 3010287].