This is a repository copy of
Liver whole slide image analysis for 3D vessel reconstruction
.
White Rose Research Online URL for this paper:
http://eprints.whiterose.ac.uk/85780/
Version: Accepted Version
Proceedings Paper:
Liang, Y, Wang, F, Treanor, D et al. (4 more authors) (2015) Liver whole slide image
analysis for 3D vessel reconstruction. In: IEEE International Symposium on Biomedical
Imaging. IEEE International Symposium on Biomedical Imaging, 16-19 Apr 2015, New
York, USA. Institute of Electrical and Electronics Engineers , 182 - 185. ISBN
978-1-4799-2374-8
https://doi.org/10.1109/ISBI.2015.7163845
[email protected] https://eprints.whiterose.ac.uk/
Reuse
Unless indicated otherwise, fulltext items are protected by copyright with all rights reserved. The copyright exception in section 29 of the Copyright, Designs and Patents Act 1988 allows the making of a single copy solely for the purpose of non-commercial research or private study within the limits of fair dealing. The publisher or other rights-holder may allow further reproduction and re-use of this version - refer to the White Rose Research Online record for this item. Where records identify the publisher as the copyright holder, users can verify any specific terms of use on the publisher’s website.
Takedown
If you consider content in White Rose Research Online to be in breach of UK law, please notify us by
LIVER WHOLE SLIDE IMAGE ANALYSIS FOR 3D VESSEL RECONSTRUCTION
Yanhui Liang⋆, Fusheng Wang⋆, Darren Treanor†, Derek Magee‡, George Teodoro∗, Yangyang Zhu⋆, Jun Kong⋆
⋆
Department of Biomedical Informatics, Emory University, Atlanta, GA, 30322, USA
†
Department of Pathology and Tumor Biology, Leeds Institute of Molecular Medicine, Leeds LS9 7TF, United Kingdom
‡School of Computing, The University of Leeds, Leeds LS2 9JT, United Kingdom
∗Department of Computer Science, University of Bras´ılia, Bras´ılia, DF, Brazil
ABSTRACT
The emergence of digital pathology has enabled numerous
quantitative analyses of histopathology structures.
How-ever, most pathology image analyses are limited to two-dimensional datasets, resulting in substantial information loss and incomplete interpretation. To address this, we have de-veloped a complete framework for three-dimensional whole slide image analysis and demonstrated its efficacy on 3D vessel structure analysis with liver tissue sections. The pro-posed workflow includes components on image registration, vessel segmentation, vessel cross-section association, object interpolation, and volumetric rendering. For 3D vessel re-construction, a cost function is formulated based on shape descriptors, spatial similarity and trajectory smoothness by taking into account four vessel association scenarios. An efficient entropy-based Relaxed Integer Programming (eRIP) method is proposed to identify the optimal inter-frame vessel associations. The reconstructed 3D vessels are both quantita-tively and qualitaquantita-tively validated. Evaluation results demon-strate high efficiency and accuracy of the proposed method, suggesting its promise to support further 3D vessel analysis with whole slide images.
Index Terms— Whole Slide Image Analysis, 3D Vessel Analysis, Vessel Reconstruction, Digital Pathology
1. INTRODUCTION
Whole slide images scanned from high resolution digital scanners provide rich information about morphological and functional characteristics of biological systems. As a result, such image modality provides insights on the underlying
mechanisms of disease onset and progression. Although
numerous image analysis methods have been proposed to analyze microscopy images [1, 2], they mainly focus on 2D biological structure analysis with substantial information loss. This presents challenges to such applications involv-ing 3D modelinvolv-ing and analysis. In liver disease diagnosis, for instance, 3D structural changes in liver vessels and their 3D spatial relationships are essential for better understand-ing disease pathological evolution and progression [3]. A large set of approaches on vessel structure analysis have been
proposed, ranging from vessel segmentation [4], structure tracking [5], to 3D vasculature visualization [6]. However, these methods are developed for radiology image analysis. Applying them to whole slide images directly is not feasi-ble, as pathology images have much higher resolutions and phenotypic variations.
In this paper, we present an automated framework for 3D vessel reconstruction with whole slide images of liver tis-sue sections. Due to the overwhelming number of vessels and large variations in vessel shapes, it is challenging to as-sociate vessel cross-sections from different image slides in a biologically meaningful way. To address this, we formu-late a cost function based on shape descriptors, spatial simi-larity and trajectory smoothness by taking into account four vessel association scenarios. Optimal vessel associations are achieved when the aggregated cost function is minimized by an entropy-based Relaxed Integer Programming (eRIP) algo-rithm that is efficient to converge to the global optimal solu-tion. The proposed 3D vessel analysis framework is generic and can be readily applied to studies using other organ tissues.
2. METHODS
We illustrate in Figure 1 the overall working schema: image acquisition, registration, segmentation, vessel cross-section
association, interpolation, and volumetric rendering. Our
dataset includes 12 whole slide images of liver tissue sec-tions [3] from the University of Leeds. Tissue secsec-tions are stained with dual chromogen Immunohistochemistry (IHC). Each whole-slide image has a typical resolution of 75k×65k pixels, with the physical resolution 2.508e-1µm per pixel at the base level. Inter-slide physical resolution is 50µm. We analyze images down-sampled from the base level by 64:1.
2.1. Image registration
In order to accurately reconstruct and characterize vessels in 3D space, we first register sequential microscopy im-ages into the same reference space. The registration process
consists of rigid and non-rigid steps. For rigid
registra-tion, the scale, 2D rotation matrix, and translation vector are computed by phase correlation in a log polar coordinate
WS#Microscopy#Image#Acquisition 3D#Microscopy#Data#Volume Pairwise#Image#Registration
Vessel#Segmentation Vessel#Association#with#Tree#Data#Structure#
B@Spline#Inter@frame#Interpolation 3D#Vessel#Rendering
Fig. 1. The overall workflow of 3D vessel analysis with whole slide imaging data.
is partitioned into a set of evenly spaced blocks that are aligned separately with a rigid block matching approach. A cubic B-Spline transformation [7] is estimated by a regu-larized least squared difference minimizing method [3] to approximate a set of point translations derived from the rigid block registration. In aggregate, non-rigid spatial changes
at 8×8=64 knots are computed. This non-rigid transform
is applied to the rigidly transformed image to compensate for the non-rigid residual. Given these 64 pairs of displace-ments {k(x(i),y(j)) = (kx(x(i),y(j)),ky(x(i),y(j))),i,j = 1,2, . . . ,8} at locations of {(x(i),y(j))}, the non-rigid
dis-placement at a given location (p,q) can be computed as
dx(p,q) =PTSK(p,q)
x STQ,dy(p,q) =PTSKy(p,q)STQ, where
P= p3 p2 p 1T, Q= q3 q2 q 1T; S is a
pre-defined 4×4 constant matrix [7].
For a given point(p,q), we construct two 4×4 matrices
Kx(p,q)andKy(p,q)whereKx(p,q)(m,n) =kx(x(i∗−1+m),y(j∗−
1+n)),Ky(p,q)(m,n) =ky(x(i∗−1+m),y(j∗−1+n)),m,n=
{1,2,3,4}, such that x(m=i∗)<p≤x(m=i∗+1),y(n=
j∗)<q≤y(n=j∗+1).
The final displacement at location(p,q)is the summation of rigid and non-rigid displacement. Our results show the me-dian and maximum absolute displacements in x-y pairs are
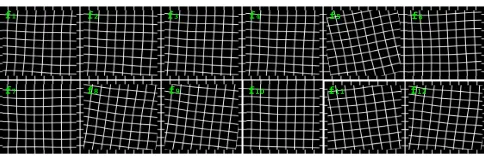
(10.40,9.58)and(139.58,103.66)in pixels. We demonstrate the registration mappings of 12 images with deformed grids in Figure 2.
2.2. Image segmentation
We next segment vessels in each registered image frame. First, we deconvolve each IHC stain component from the
!" !# !$ !% !& !'
[image:3.612.316.560.73.153.2]!( !) !* !"+ !"" !"#
Fig. 2. Registration results demonstrated by deformed grids.
Lambert(Beer’s, Law, Color,,
Intensity,
Optical,, Density,
Stain,,
Unmixer, Absorption,Factor,
Origina l(Im
age Haema
tox ylin
DAB Siriu s(Red
Amount' of'Stain Optical'
Density Color'
Intensity
Lambert9Beer's' Law
[image:3.612.55.297.75.224.2]Stain Unmixer
Fig. 3. Liver microscopy image segmentation. (Left): A color image deconvolved into three stain components; (Right): a close-up view of segmentation result.
original color image. Color deconvolution [8] can be real-ized by Lambert-Beer’s law on the relationship between the intensity of light entering a specimenIi and that through a specimenIoas: Io=Iie(−Ab) whereAandb are the amount of stain and the absorption factor, respectively. The resulting Optical Density (OD) is defined as: OD=−log(Io/Ii). We
define the un-mixerM= (∆ ~m1...m~2...~m3)as a 3×3 matrix where its three columns have unit length and represent the OD values associated with the red, green, and blue channel for Hematoxylin, DAB, and Sirius Red. GivenC(p,q)is a 3×1 vector representing three stain amounts at pixel(p,q), the OD levels for red, green, and blue channelY would beY =MC. As a result, an orthogonal representation of the stains can be written asC=M−1Y. After stain components are decon-volved from RGB image, we start the segmentation process with fat and lumen detection. Hysteresis thresholding is ap-plied to gray-scale image with shape and size constraints [9]. Next, vessels, nuclei, and bile ducts are identified with de-convolved DAB, Hematoxylin, and Sirius Red stain channels using a morphological reconstruction operation that locally
“normalizes” image background [10]. Three deconvolved
stains are presented in Figure 3 where brown, red, dark blue, light purple, and light yellow colors are used to represent vessels, bile ducts, nuclei, lumens, and fat in liver tissues, respectively. Additionally, the green vessel boundaries are superimposed on the original image.
2.3. Inter-frame vessel association
After blood vessel segmentation, inter-frame vessel group-ing and filtergroup-ing are performed. Vessel groupgroup-ing is done by an image dilation operation [10] to make small vessel pieces cohesive to their source vessels. Candidates are then cho-sen among the grouped vessels by size for further analysis. We characterize the selected vessels by shape, spatial rela-tionship and vessel trajectory smoothness. For our dataset, we consider four distinct vessel association cases: one-to-one (growing), one-to-two (bifurcating), one-to-none (disappear-ing) and none-to-one (appear(disappear-ing). The resulting cost func-tions are formulated as follows:
(1) One-to-one (vessel extension to the next frame):
C(vt
i,vtj+1) =λ1g(vti,vtj+1) +λ2d(vti,vtj+1) +λ3b(vti,vtj+1)
(2) One-to-two (vessel bifurcation): C(vt
i,vtj+11,v
[image:3.612.55.297.637.716.2]λ1g(vti,v t+1
j1 ∪v
t+1
j2 ) +λ2d(v
t i,v
t+1 j1 ∪v
t+1
j2 ) +λ3b(v
t i,v
t+1 j1 ∪v
t+1 j2 )
(3) One-to-none (vessel disappearance):
C vt i,vt∅+1
=Cαconst
(4) None-to-one (new vessel emergence):
C vt∅−1,vti
=Cβconst
where vti is the i-th vessel object in image frame t; func-tionsg(·),d(·), andb(·)denote similarity of vessel appear-ance by Fourier shape descriptors [12], distappear-ance of two vessel objects, and change in vessel trajectory orientations, respec-tively. Cαconst andCβconst are constant costs penalizing vessel disappearance and emergence; and{λ1,λ2,λ3}s.t.λ1+λ2+
λ3=1 are constant weights to control the association smooth-ness.
Additionally, functiong(·),d(·)andb(·)are defined as:
gvti,vtj+1=exp||f(vt i)−f
vtj+1||/σ2
1
dvt i,vtj+1
=exp||o(vt
i)−o
vtj+1||/σ2
2
bvti,vtj+1=exp||a vti−1,vti−a(vt i,v
t+1 j )||/σ32
wheref(vt
i)is a vector of Fourier shape descriptors derived from vesselviat framet;o(vti)denotes the centroid ofvti; and
avti,vtj+1=
D
o(vti),o
vt+j 1
E
||o(vt i)|| ||o
vt+j 1||indicates the orientation of the
vessel vector fromvtitovtj+1. Note that all these functions take the exponential form to force the resulting optimally associ-ated vessels to have similar shape, low distance offset, and small orientation change in vessel trajectory.
We assume there arem1andm2vessel objects in frame
t andt+1 respectively, andrpossible associations between these two frames. We solve the frame-by-frame vessel as-sociation problem by a Relaxed Integer Programming (RIP)
framework [11]. The optimal vessel associations can be
achieved as follows: Arg min
x c
Tx s.t. MTx
i≤1, A
Tx=1, 0≤x j≤1 for i=1,· · ·,m1+m2; j=1,· · ·,r
wherecis ar×1 vector with each entry representing the cost of one vessel object association;Mis ar×(m1+m2)binary matrix withMi j=1 if and only if thei-th object association involves thej-th element from the union ofm1vessel objects in framet andm2in framet+1;(MTx)iis thei-th element of(MTx)and the constraint(MTx)
i≤1 guarantees that each vessel object in a given frame can be selected at most once in the result;Ais a matrix composed with the firstm1columns in
M;1is am1×1 vector with all entries being 1s.This equality constraint guarantees that the sum of association probabilities for any given vessel object from frame t is one. The optimal solutionxis ar×1 binary vector wherexi= 1 indicates the
i-th association is included in the optimal solution.
We propose an efficient entropy-based Relaxed Integer Programming (eRIP) mechanism to find the best vessel asso-ciation with RIP as a building block (Algorithm 1). In eRIP, we first solve RIP for one possible solutionxRIP. If the en-tropy ofxRIPis sufficiently low, we take it as the final result.
Algorithm 1:Description of entropy-based Relaxed In-teger Programming (eRIP) for Vessel Association
1 Solve the Relaxed Integer Programming (RIP) problem;
2 Compute the entropyexof the solutionxRIPfrom RIP;
3 ifex≤e∗then
/* e∗ is a threshold (0≤e∗≤1) */ 4 x←xRIP;
5 else
6 Replace the constraint of 0≤xj≤1 withxj∈ {0,1};
7 Solve the corresponding Integer Programming (IP)
problem forxIPwith the updated constraintxj∈ {0,1};
8 x←xIP;
9 end
[image:4.612.317.561.83.239.2]10 return x;
Table 1. Evaluation of the segmentation results (mean, Rel-ative Standard Deviation%). The first column shows vessel color in Figure 4.
Jac Pre Rec F1 Haus
R 0.91,64.73 0.94,36.72 0.94,36.81 0.94,36.69 2.81,3.25
Y 0.92,60.40 0.92,37.41 0.92,37.53 0.92,37.41 2.72,3.02
G 0.80,125.13 0.86,41.10 0.86,41.06 0.86,40.91 4.10,5.88
B 0.80,109.28 0.85,41.90 0.85,41.69 0.85,41.62 4.10,5.81
P 0.84,79.79 0.84,39.95 0.84,39.82 0.84,39.75 4.10,5.78
M 0.81,86.55 0.81,40.58 0.81,40.45 0.81,40.35 4.09,6.00
W 0.87,57.26 0.88,35.40 0.88,35.52 0.88,35.35 3.81,3.96
C 0.81,81.88 0.82,37.69 0.82,37.80 0.82,37.69 4.22,3.13
O 0.86,61.80 0.85,37.22 0.86,37.33 0.86,37.21 3.92,3.11
Otherwise, we switch to Integer Programming (IP) by replac-ing the constraint 0≤xj≤1 in RIP withxj∈ {0,1}.
3. EXPERIMENTS AND RESULTS
For vessel association, eRIP is proposed to identify the opti-mal vessel association between adjacent frames. We focus on the largest 25 vessel candidates by size on each slide. Of these candidates, the smallest vessel size is 304.25±104.34 in pix-els. At this stage, our working pipeline primarily deals with
macro-vessels. The parameters are empirically set asλ1=
0.58,λ2=0.33,Cαconst =0.35,C
β
const =0.38, σ12=50000,
σ2
2 =50 and σ32=10. The median and maximum absolute
displacements for these associated vessels in x-y pairs are
(91.41,67.63)and(700.59,586.30)in pixels. Given the lim-ited number of whole slide images in our dataset (n=12), we perform B-Spline interpolation between associated vessel ob-jects and volumetrically render 3D vessel structure with mesh representation [13]. In Figure 4 (Left), we present 3D visual-ization result of nine primary vessels from our dataset, with a close-up view of a representative vessel (blue) illustrated in Figure 5 (Left).
[image:4.612.318.552.295.388.2]perfor-A
"
Fig. 4. 3D vessels reconstructed by (Left) our method; and (Right) human annotations.
T
im
e
%(s
)
Index%of%Frame2pair
Fig. 5. (Left) A 3D close-up view of a representative vessel object; (Right) Time cost comparison between eRIP and IP.
mance assessed by each measure is in bold. Note Vessels in red and yellow are more regular in shape, leading to better agreement between the proposed method and human annota-tions. 3D vessel rendering results from human annotations in Figure 4 (Right) are used for qualitative assessments. By vi-sual comparisons, 3D vessel structures in Figure 4 (Left) and (Right) are similar. Human annotated vessels are more regu-lar and smooth in shape, whereas machine generated vessels tend to preserve more structural details. Overall, both quan-titative measurements and qualitative comparisons suggest a satisfactory concordance between our method and human an-notations.
In our tests, eRIP and IP produce identical vessel
asso-ciation results. We present the execution time for these two approaches in Figure 5 (Right). The green bars show eRIP execution time, with all values except the fourth less than 0.5 seconds and the majority around 0.3 seconds. By contrast, IP execution time is much longer, with majority around 1.5 sec-onds (yellow bars). Note that eRIP takes more time than IP for the fourth frame-pair (red bar), as entropy of the solution from RIP is greater than the thresholde∗=0.3. In this case,
eRIP automatically switches to IP method. Mostxjs from
RIP are 0s or 1s in our tests, resulting in less execution time by eRIP overall.
4. CONCLUSIONS
In this paper, we present a framework for 3D vessel struc-ture analysis on whole slide images of liver tissue sections. To identify vessel associations, we formulate a cost function with vessel shape descriptors, spatial similarity and trajectory smoothness for four vessel association scenarios. We also propose an eRIP optimization method to efficiently associate vessel objects between adjacent slides. Both quantitative and qualitative evaluation results demonstrate the effectiveness of our 3D vessel reconstruction framework and its promise as a platform for further 3D vessel analysis.
5. ACKNOWLEDGEMENT
This research is supported in part by grants from National Institute of Health K25CA181503, National Science Founda-tion ACI 1443054 and IIS 1350885, and CNPq.
6. REFERENCES
[1] Foran, D.J., Chen, W. and Yang, L., “Automated image interpretation computer-assisted diagnosis,”Analytical Cellular Pathology, 34(6), pp.279-300, 2011. [2] Kong, J., Cooper, L.D., Wang, F.S., Gao, J., Teodoro, G., Scarpace, L.,
Mikkelsen, T., Moreno, C.S., Saltz J.H. and Brat, D.J., “Generic, Computer-based Morphometric Human Disease Classification Using Large Pathology Im-ages Uncovers Signature Molecular Correlates,”PLoS One, 8(11), 2013. [3] Roberts, N., Magee, D., Song, Y., Brabazon, K., Shires, M., Crellin, D., Orsi,
N.M., Quirke, R., Quirke, P. and Treanor, D., “Toward routine use of 3D histopathology as a research tool,”Am. J. of Path., 180(5), pp.1835-1842, 2012. [4] Lesage, D., Angelini, E.D., Bloch, I. and Funka-Lea, G., “A review of 3D ves-sel lumen segmentation techniques: models, features and extraction schemes,”
Medical Image Analysis, 13(6), pp.819-845, 2009.
[5] Friman, O., Hindennach, M., K¨uhnel, C. and Peitgen H. O., “Multiple hypoth-esis template tracking of small 3D vessel structures,”Medical Image Analysis, 14(2), pp.160-171, 2009.
[6] Kubisch, C., Glaer, S., Neugebauer, M., and Preim, B., “Vessel visualization with volume rendering,”Vis. in Med. & Life Sci., pp.109-134, 2012. [7] Salomon, D., “Curves and Surfaces for Computer Graphics. Springer,”Chapter
7. B-Spline Approximation, ISBN 978-0-387-28452-1.
[8] Ruifrok, A.C. and Johnston D.A., “Quantification of histochemical staining by color deconvolution,”Anal Quant Cytol Histol, 23(4), pp.291-299, 2001. [9] Hancock, E.R. and Kittler, J., “Adaptive estimation of hysteresis thresholds,”
Proceedings in CVPR, pp.196-201, 1991.
[10] Vincent, L., “Morphological Grayscale Reconstruction in Image Analysis: Ap-plications and Efficient Algorithms,”IEEE TIP, 2(2), pp.176-201, 1993. [11] Chvatal, V., “Linear Programming,”W.H. Freeman and Co., New York, 1983 [12] Zhang, D. and Lu, G., “Shape-based image retrieval using generic Fourier
de-scriptor,”Signal Process.: Image Commun., Vol. 17, pp. 825-848, 2002.
[13] Fang, Q.Q. and Boas, D., “Tetrahedral mesh generation from volumetric binary
[image:5.612.55.299.448.533.2]