Data Mining Techniques: A Tool For
Knowledge Management System In
Agriculture
Latika Sharma, Nitu Mehta
Abstract: Agriculture data is highly diversified in terms of nature, interdependencies and resources. For balanced and sustainable deve lopment of agriculture these resources need to be evaluated, monitored and analyzed so that proper policy implication could be drawn. Recently knowledge management in agriculture facilitating extraction, storage, retrieval, transformation, dissemination and utilization of knowledge in agriculture is underway. Data mining techniques till now used extensively in business and corporate sectors may be used in agriculture for data characterization, discrimination and predictive and forecasting purposes. Some use of data mining in soil characteristic evaluation has already been attempted. This paper attempts to bring out the characteristic computational needs of agriculture data which is essentially seasonal and uncertain along with some suggestion regarding the use of data mining techniques as a tool for knowledge management in agriculture.
Keywords: Data Mining, Knowledge Management System, Data Warehouses ,KDD, Agriculture System, and OLAP.
Agriculture in India
The Indian Agriculture is highly diversified in terms of its climate, soil, crops, horticultural crops, plantation crops, livestock resources, fisheries resources, water resources, etc. the diversity of its agricultural sector is both a bane and boon to the social, economic, and cultural bases of India’s vast population. Moreover, the diversity among resources generates interactions among many different macro and micro factors, and is further complicated with the interdependencies that exist among these. These resources need to be evaluated, monitored, and allocated optimally for balanced and sustainable development of the country.
Knowledge Management System in Agriculture
Knowledge Management System is a platform facilitating extraction, storage, retrieval, integration, transformation, visualization, analysis, dissemination, and utilization of knowledge. It is a process consisting of identifying valid and potentially useful data,
Latika Sharma is currently working as Assist.
Professor in the Dept. of Agriculture Economics & Management, RCA, MPUAT, Udaipur.
Email[email protected]
Nitu Mehta is currently working as Senior
Research Fellow in the NAIP Project, Dept. of Agriculture Economics & Management, RCA, MPUAT, Udaipur.
Email[email protected]
Establishment of databases and data warehouse; knowledge discovery from database/data warehouse (KDD) and development of the mechanism of dissemination of knowledge on information networks as per requirements of user groups. Since there is a large number of data collection agencies and equally diverse resources for which the information is collected, it is easy to visualize the heterogeneity of information from the agricultural sector. As stated earlier, the problem is compounded by the fact that there are no common standards that are applied in data collection. Designing data warehouses to integrate the collected information poses a formidable challenge to any data warehouses architect. In order to use the information for planning and decision-making level, data have to be integrated and aggregated properly. The challenges that may be faced in Knowledge Management System in agriculture are:
a) Knowledge evaluation- involves assessing the worth of information.
b) Knowledge processing- Involves the identification of techniques to acquire, store, process and distribute information and sometimes it is necessary to document how certain decisions were reached.
Data Set 1
Data Set 1
Data Set 1
Knowledge extractor
(e.g. data
mining)
Knowledge Server
1
Knowledge Server
n
Knowledge User 1
Knowledge User 2
Knowledge User 1
Knowledge Management System (KMS)
Figure.1. Knowledge management System Frame Work
Figure.1. Knowledge management System Frame Work
Data
Data
Rules
Knowledge Management System Frame Work
Following Xu and Zhang (2004), a KMS can be visualized as a system [ Fig. 1] in which data and rules enter into the system as inputs, knowledge extraction is undertaken based on the input rules, the extracted knowledge is managed and knowledge based services are provided to the stake holders.
A Knowledge Management System can be split into sub components:
1. Repositories- These hold explicated formal &
informal knowledge and the rules associated with them for collection, refining, managing, validating, maintaining, interpretating and distributing content.
2. Collaborative platforms- These support distributed
work and incorporate pointers, skills databases, expert locators and informal communication channels.
3. Networks- networks support communications and
conversion. They include broad bands, leased lines, intranets, extranets et.
4. Culture- Culture enablers that encourage sharing and
use.
Data Warehouses and its Application in Agriculture
The World Wide Web is producing voluminous data, differentiated for type and available to varied users. Furthermore, the continuing progress in ICT over the past two decades has
On Line Analytical Processing (OLAP)
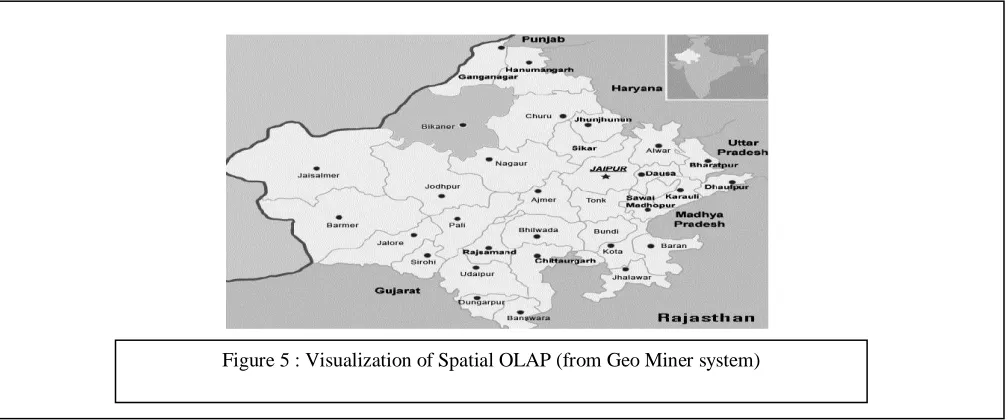
OLAP is an approach to swiftly answer multi-dimensional analytical queries. Data mining is a part of OLAP with application such as forecasting or prediction in agriculture. It provides an opportunity of viewing agriculture data from different points of view to better understand what that data means OLAP has been used extensively for analysis of Soil physical characteristics. The recent advances in data base technology and data warehouses, the multi dimensional data base, OLAP, SOLAP (Spatial OLAP) and data mining technologies are being successfully applied to the management of national resources.
Computational Needs of Agriculture data
Agriculture data is often associated with uncertainty because of measurement inaccuracy, sampling discrepancy, outdated data sources, or other errors. In recent years, there has been much research on the management of uncertain data in databases, such as the representation of uncertainty in database and querying data with uncertainty. However, little research work has addressed the issue of mining uncertain data. We note that with uncertainty, data values are no longer atomic. To apply traditional data mining techniques, uncertain data has to be summarized into atomic values. Discrepancy in the summarized recorded values and the actual values could seriously affect the quality of the mining results.
What kind of Data can be mined in Agriculture?
In principle, data mining is not specific to one type of media or data. Data mining should be applicable to any kind of information repository. However, algorithms and approaches may differ when applied to different types of
The most commonly used query language for relational database is SQL, which allows retrieval and manipulation of the data stored in the tables, as well as the calculation of aggregate functions such as average, sum, min, max and count. For instance, an SQL query to select the farmers grouped by category (Land Holding group) would be: data. Indeed, the challenges presented by different types use and studied for databases, including relational databases, object-relational databases and object oriented
databases, data warehouses, transactional databases, unstructured and semi structured repositories such as the of data vary significantly. Data mining is being put into World Wide Web, advanced databases such as spatial databases, multimedia databases, time-series databases and textual databases, and even flat files. Here are some examples in more detail:
Flat files: Flat files are actually the most common data
source for data mining algorithms, especially at the research level. Flat files are simple data files in text or binary format with a structure known by the data mining algorithm to be applied. The data in these files can be transactions, time-series data, scientific measurements, etc.
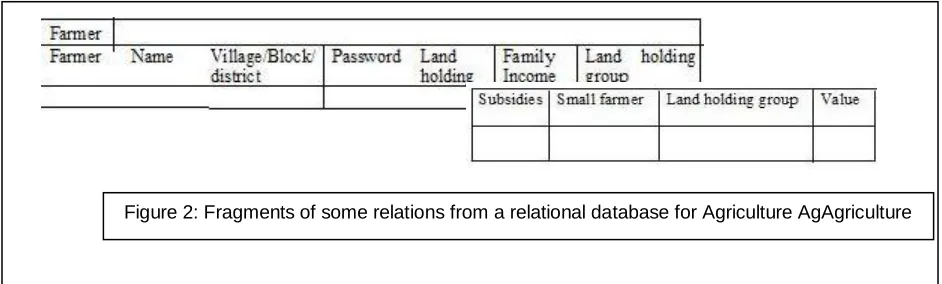
Relational Databases: Briefly, a relational database
consists of a set of tables containing either values of entity attributes, or values of attributes from entity relationships. Tables have columns and rows, where columns represent attributes and rows represent tuples. A tuple in a relational table corresponds to either an object or a relationship between objects and is identified by a set of attribute values representing a unique key. In Figure 2 we present some relations farmers and subsides in a fictitious government support program of subsidies for small farmers.
The most commonly used query language for relational database is SQL, which allows retrieval and manipulation of the data stored in the tables, as well as the calculation of aggregate functions such as average, sum, min, max and count. For instance, an SQL query to select the farmers grouped by category (Land Holding group) would be:
SELECT count (*) FROM Subsidies WHERE type=small farmer GROUP BY category.
Transaction Databases: A transaction database is a set
of records representing transactions, each with a time stamp, an identifier and a set of items. Associated with the transaction files could also be descriptive data for the items. For example, in the case of the video store, the rentals table such as shown in Figure 1.5 represents the
Data mining algorithms using relational databases can be more versatile than data mining algorithms specifically written for flat files, since they can take advantage of the SQL could provide, such as predicting, comparing, detecting deviations, etc.
Data Warehouses: A data warehouse as a storehouse is
a repository of data collected from multiple data sources (often heterogeneous) and is intended to be used as a whole under the same unified schema. A data warehouse gives the option to analyze data from different sources under the same roof.
transaction database. Each record is a rental contract with a customer identifier, a date, and the list of items rented (i.e. video tapes, games, VCR, etc.). Since relational databases do not allow nested tables (i.e. a set as attribute value), transactions are usually stored in flat files or stored in two normalized transaction tables, one for the transactions and one for the transaction items. One typical Figure 3: A multi-dimensional data cube structure commonly used in data for data warehousing
Sum
By time & village
By Category
Village A
Village B
Village C
Small
Marginal
Land less
By Village
Aggregate
Small
Marginal
Land less
Sum
Group by Category
(Land holding size)
Sum
By Time Land less
Marginal
Small
Cross Tab
By Category (land
holding size)
Q1 Q2 Q3 Q4
data mining analysis on such data is the so-called market basket analysis or association rules in which associations
Spatial Databases: Spatial databases are databases that,
in addition to usual data, store geographical information like
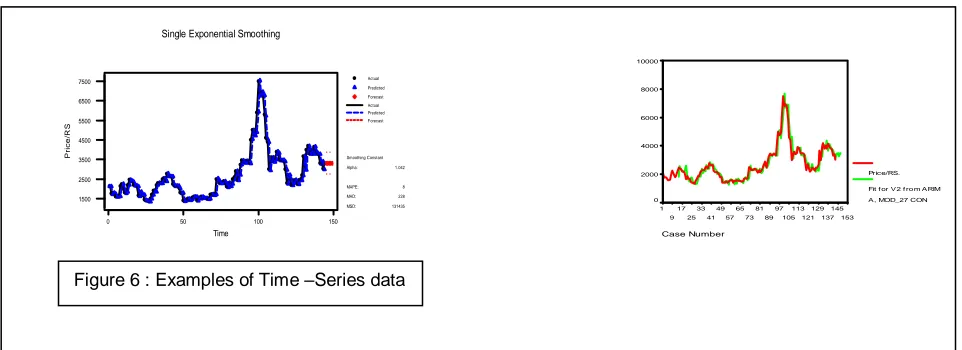
Time-Series Databases: Time-series databases contain
time related data such stock market data or logged activities. These databases usually have a continuous flow of new data coming in, which sometimes causes the need for a
between items occurring together or in sequence are studied.
maps, and global or regional positioning. Such spatial databases present new challenges to data mining algorithms.
challenging real time analysis. Data mining in such databases commonly includes the study of trends and correlations between evolutions of different variables, as well as the prediction of trends and movements of the variables in time. Figure 6 shows some examples of time-series data.
Figure 4: Fragment of a transaction database for the credit transaction of a farmer through farmer credit card scheme.
Actual Predicted Forecast Actual Predicted Forecast 150 100 50 0 7500 6500 5500 4500 3500 2500 1500 P ri c e /R S Time MSD: MAD: MAPE: Alpha: Smoothing Constant 131435 228 8 1.042
Single Exponential Smoothing
What can be discovered?
1) Data Characterization: Data characterization is a
summarization of general features of objects in a target class, and produces what is called characteristic rules. The data relevant to a user-specified class are normally retrieved by a database query and run through a summarization module to extract the essence of the data at different levels of abstractions. For example, one may want to characterize the farmers according to their family income or household size or fixed assets. We may wish to know if there is a pattern in the cropping pattern or consumption pattern of farmers according to land holding size group. With a data cube containing summarization of data, simple OLAP operations fit the purpose of data characterization.
2) Data Discrimination :Data discrimination produces
what are called discriminant rules and is basically the comparison of the general features of objects between two classes referred to as the target class and the contrasting class. For example, one may want to compare the living Standards and family income of farmers availing subsidy support by the government with those of not getting their support. The techniques used for data discrimination are very similar to the techniques used for data characterization with the exception that data discrimination results include comparative measures.
3) Association analysis: Association analysis is the
discovery of what are commonly called association rules. It studies the frequency of items occurring together in transactional databases, and based on a threshold called support, identifies the frequent item sets. Another threshold, confidence, which is the conditional probability than an item appears in a transaction when another item appears, is used to pinpoint association rules. Association analysis is commonly used for market basket analysis. Association analysis is for studying the frequency of attributes or items occurring together during transaction analysis with a conditional probability called confidence. This is basically for the discovery of ‘Association rules’. In agriculture it can be used for two products being marketed or demanded in association or credit intake of the farmer occurring in association with cash crop cultivation and so on.
Conclusions
There is a growing number of applications of data mining techniques in agriculture and a growing amount of data that are currently available from many resources. This is relatively a novel research field and it is expected to grow in the future. there is a lot of work to be done on this emerging and interesting research field. The multidisciplinary approach of integrating computer science with agriculture will help in forecasting/ managing purpose.
Figure 6 : Examples of Time –Series data
References
[1]. Abdullah, A., Brobst, S., M.Umer M. (2004). "The case for an agri data ware house: Enabling analytical exploration of integrated agricultural data". Proc. of IASTED International Conference on Databases and Applications. Austria.
[2]. Chau, m., Cheng, R., and Kao, b.92005). Uncertain data mining; A new research Direction, in Proceeding of the Workshop on the Science of the Artificial, Hualian, Taiwan.
[3]. Codd, E.F. (1993). Providing OLAP (On line Analytical Processing) to user analysts: An IT mandate. Technical Report, E.F Codd and Associates.
[4]. Cunningham S.J., G. Holmes. (2005). "Developing innovative applications in agriculture using data mining". Proc. Of 3rd International Symposium on Intelligent Information Technology in Agriculture. Beijing, China.
[5]. Inmon, B (2005). Building the data Warehouse Fourth edition, john Wiley, New York.
[6]. Kiran Mai, C., Murali Krishna, I.V., A.Venugopal Reddy ( 2006). "Data Mining of Geo-spatial Database For Agriculture Related Application". Proc. of Map India. New Delhi.
[7]. Osmar R.Zaiane (1999). CMPUT690 principles of Knowledge discovery in Data bases, department of computer science, University of Alberta.