UNIVERSITI TEKNIKAL MALAYSIA MELAKA
MODELLING AND VALIDATION OF RIDE MODEL FOR
UTILITY TRUCK
This report submitted in accordance with requirement of the UniversitiTeknikal Malaysia Melaka (UTeM) for the Bachelor’s Degree in Mechanical Engineering
Technology (Automotive Technology) (Hons.)
by
NURRUL HIKMAH BINTI MUHAMMAD MAHAYUDIN B071410624
930906-05-5616
UNIVERSITI TEKNIKAL MALAYSIA MELAKA
BORANG PENGESAHAN STATUS LAPORAN PROJEK SARJANA MUDA
TAJUK: MODELLING AND VALIDATION OF RIDE MODEL FOR UTILITY TRUCK
SESI PENGAJIAN: 2017/2018 semester 1
SayaNURRUL HIKMAH BINTI MUHAMMAD MAHAYUDINmengakumembenarkanLaporan PSM inidisimpan di PerpustakaanUniversitiTeknikal Malaysia Melaka (UTeM) dengansyarat-syaratkegunaansepertiberikut: Laporan PSM adalah hak milik Universiti Teknikal Malaysia Melaka dan penulis.
1. Perpustakaan Universiti Teknikal Malaysia Melaka dibenarkan membuat salinan untuk tujuan pengajian sahaja dengan izin penulis.
2. Perpustakaan dibenarkan membuat salinan laporan PSM ini sebagai bahan pertukaran antara institusi pengajian tinggi.
3. **Silatandakan ( )
SULIT
TERHAD
TIDAK TERHAD
(Mengandungimaklumat yang
berdarjahkeselamatanataukepentingan Malaysia sebagaimana yang termaktubdalam AKTA RAHSIA RASMI 1972)
(Mengandungimaklumat TERHAD yang telahditentukanolehorganisasi/badan di manapenyelidikandijalankan)
(TANDATANGAN PENULIS) AlamatTetap:
NO.258 BLOK 16, FELDA RAJA ALIAS SATU, 72120 BANDAR SERI JEMPOL, NEGERI SEMBILAN.
Tarikh: ________________________
Disahkanoleh:
(TANDATANGAN PENYELIA)
Cop Rasmi:
** JikaLaporan PSM ini SULIT atau TERHAD, silalampirkansuratdaripadapihakberkuasa/organisasiberkenaandenganmenyatakansekalisebabdantem
FAKULTI TEKNOLOGI KEJURUTERAAN
Tel : +606 234 6623 | Faks : +606 23406526
Rujukan Kami (Our Ref) : Rujukan Tuan (Your Ref) :
13 DISEMBER 2017 Pustakawan
PerpustakaanUTeM
UniversitiTeknikal Malaysia Melaka Hang Tuah Jaya,
76100 Durian Tunggal, Melaka.
Tuan/Puan,
PENGKELASAN LAPORAN PSM SEBAGAI SULIT/TERHAD LAPORAN PROJEK SARJANA MUDA FAKULTI TEKNOLOGI KEJURUTERAAN (TEKNOLOGI AUTOMOTIF): NURRUL HIKMAH BINTI MUHAMMAD MAHAYUDIN
SukacitadimaklumkanbahawaLaporan PSM yang tersebut di
atasbertajuk“MODELLING AND VALIDATION OF RIDE MODEL FOR UTILITY
TRUCK”mohondikelaskansebagai *SULIT / TERHAD untuktempoh LIMA (5)
tahundaritarikhsuratini.
2. Hal iniadalahkeranaIANYA MERUPAKAN PROJEK YANG DITAJA OLEH
SYARIKAT LUAR DAN HASIL KAJIANNYA ADALAH SULIT.
Sekiandimaklumkan.Terimakasih.
Yang benar,
________________
Tandatangandan Cop Penyelia
NOTA: BORANG INI HANYA DIISI JIKA DIKLASIFIKASIKAN SEBAGAI SULIT
DAN TERHAD. JIKA LAPORAN DIKELASKAN SEBAGAI TIDAK TERHAD,
DECLARATION
I hereby, declared this report entitled “Modelling and Validation of Ride Model for Utility Truck” is the results of my own research except as cited in references.
APPROVAL
This report is submitted to the Faculty of Engineering Technology of UTeM as a partial fulfillment of the requirements for the degree of Bachelor of Mechanical Engineering Technology (Automotive Technology) (Hons.). The member of the supervisory is as follow:
ABSTRACT
This paper presents the modeling and validation of 7-degree of freedom (DOF) full vehicle model to study ride performance of utility truck. To improve utility truck suspension system that can reduce roll over effect and improve ride comfort, passive utility truck ride model was constructed. The simulation model was developed in Maltlab Simulink software. Several assumption related to 7-degree of freedom modeling were made and stated in this paper. The model was validated using vehicle dynamics simulation software known as Carsim. The validation was done by comparing the simulation result. Next, PID controller was applied to the system to see the improvement response between passive and PID controller and the simulation result consist of pitch angle, roll angle and vertical acceleration are analyzed.
ABSTRAK
Kertas ini membentangkan pemodelan dan pengesahan model penuh kenderaan 7
darjah kebebasan (DOF) untuk mengkaji prestasi trak utiliti. Untuk meningkatkan
sistem penggantungan trak utiliti yang dapat mengurangkan pengurangan kesan dan
meningkatkan keselesaan perjalanan, model perjalanan trak utiliti pasif telah dibina.
Model simulasi dibangunkan dalam perisian Maltlab Simulink. Beberapa asumsi yang
berkaitan dengan 7 darjah pemodelan kebebasan telah dibuat dan dinyatakan dalam
tesis ini.Model tersebut telah disahkan menggunakan perisian simulasi dinamik
kenderaan yang dikenali sebagai Carsim. Pengesahan dilakukan dengan
membandingkan hasil simulasi. Seterusnya, pengawal PID digunakan untuk sistem
untuk melihat tindak balas peningkatan antara pengawal pasif dan PID dan hasil
simulasi terdiri daripada sudut pitch, sudut roll dan pecutan menegak dianalisis.
DEDICATIONS
Dedicated to my supportive mother, Mrs. Azizah Binti Yahya. To my supevisor, Ir Mohamad Hafiz bin Harun and En. Zul Husni Bin Che Mamat, lectures and friends for all of their helps and friendship.
ACKNOWLEDGMENTS
First I would like to express my grateful to ALLAH s.w.t. as for the blessing given that I can finish my project. In preparing this paper, I have engaged with many people in helping me completing this thesis. First, I wish to express my sincere appreciation to my main thesis supervisor Ir. Mohamad Hafiz Bin Harun and En. Ahmad ZulHusni Bin CheMamat for encouragement, guidance, advices and motivation. Without their continued support and interest, this thesis would not have been the same as presented here.
Next, people who help me to grow further and influence my project are the colleagues who always help me in order to finish this project. I would like to express my gratitude to all my friends for their help and advices. I appreciate very much to those who help of giving the idea and information given.
Last but not least I acknowledge without endless love and relentless support from my family, I would not have been here. My father, mother, sisters and brother that always support and encourage me to success.
Thank you all.
TABLE OF CONTENTS
Abstract i
Dedication iii
Acknowledgement iv
Table of Content v
List of Tables vii
List of Figures ix
List Abbreviations, Symbols and Nomenclatures xii
CHAPTER 1: INTRODUCTION 1.0 Introduction 1
1.1 Problem statement 1
1.2 Objective 2
1.3 Scope 2
CHAPTER 2: LITERATURE REVIEW 2.0 Introduction 3
2.1 Vehicle Suspension System 4
2.2 Classification Vehicle Suspension System 5
2.2.1 Passive Suspension System 6
2.2.2 Semi-Active Suspension System 7
2.2.3 Active Suspension System 8
2.3 Review of Previous Work on Active Suspension Control 10
2.4 Semi-Active Control Strategies 12
2.4.1 Skyhook 12
2.4.2 Groundhook 14
2.4.3 PID Control System 16
2.5 Utility Truck Semi-Active Control System 17
CHAPTER 3: METHODOLOGY 3.0 Introduction 19
3.1 Formulation Equation 21
3.2 Quarter Car Model 21
3.2.1 Half Car Model 23
3.3 Ride Model 24
3.4 Matlab Simulink 26
3.5 7-DOF Ride Model Response 27
3.6 Carsim Set up 29
3.7 Carsim Vehicle Responses 32
3.8 Develop the Controller (PID Controller) 34
3.8.1 Proportional Term 34
3.8.2 Integral Term 35
3.8.3 Derivative Term 36
CHAPTER 4: RESULT AND DISCUSSION 4.0 Introduction 37
4.1 Simulation and Validation 37
4.1.1 Development of Ride Modelling 38
4.2 Improvement of Suspension Model 43
4.2.1 Controller Selection 44
CHAPTER 5: CONCLUSION 5.0 Introduction 60
5.1 Summary of Research 61
5.2 Achievement of Research Objective 61
5.3 Significance of Research 61
5.2 Problem Faced During Research 62
REFERENCE 63
APPENDIX 65
LIST OF TABLE
Table 3-1: Quarter car model parameter 22
Table 3-2: Parameters for ride equation 25
Table 3-3: Parameters for utility truck ride equation 26
Table 3-4: Parameters for simulink model 27
Table 4-1:Vehicle ride model parameter 40
Table 4-2: Proportional Self Sensitivity selection value 48
Table 4-3: Integral Self Sensitivity selection value 50
Table 4-4: Derivative Self Sensitivity selection value 52
Table 4-5: The result of the controller response compare to the passive system 55
Table 4-6: The result of the controller response improvement with controller 58
LIST OF FIGURES
Figure 2.1: Passive suspension 6 Figure 2.2: Semi active suspension systems 7 Figure 2.3: A low band with or soft active suspension system 9
Figure 2.4: A high-band with or stiff active suspension system 10
Figure 2.5: Skyhook damper force with quarter car 13
Figure 2.6:Ground-hook damping approach 14
Figure 3.1: Research Flowchart 20
Figure 3.2: Passive Quarter Car Model 21
Figure 3.3: Half car model 23
Figure 3.4: 7-DOF ride vehicle model 24
Figure 3.5: 7-DOF ride vehicle model in Matlab Simulink 27
Figure 3.6: Vertical Acceleration vs time graph response in Matlab 28
Figure 3.7: Pitch Angle vs time graph response in Matlab 28
Figure 3.8: Roll Angle vs time graph response in Matlab 29
Figure 3.9: Carsim command window for simulate vehicle ride test 30
Figure 3.10: Selection of vehicle type 31 Figure 3.11: Ride test selection 31
Figure 3.12:Vehicle reference selection 32
Figure 3.13: Acceleration vs time graph response in Carsim 32
Figure 3.14: Vehicle roll angle vs time graph response in Carsim 33
Figure 3.15: Vehicle pitch angle vs time graph response in Carsim 33
Figure 3.16: Vehicle pitch angle vs time graph response in Carsim 34
Figure 4.1: Ride test sine wave road profile 38
Figure 4.2: Vehicle movement on the road profile 38
Figure 4.3: Simulink block diagram 39
Figure 4.4: User interface for heavy vehicle 40
Figure 4.5:Carsim software Vertical Acceleration graph response 41
Figure 4.6: The most significant pattern of Carsim Vertical Acceleration graph response 42 Figure 4.7:Matlab Simulink Vertical Acceleration graph response 42 Figure 4.8: The similar pattern graph Matlab and Carsim for validation 43
Figure 4.9: Block diagram for P controller 45
Figure 4.10: Block diagram for PI controller 45 Figure 4.11: Block diagram for PD controller 46
Figure 4.12: Block diagram for PID controller 46
Figure 4.13: Proportional Self Sensitivity selection value 47
Figure 4.14: Integral Self Sensitivity selection value 49
Figure 4.15: Derivative Self Sensitivity selection value 51
Figure 4.16: Graph of Vertical Acceleration for Passive, P, PI, PD and PID 53
Figure 4.17: Graph of Vertical Acceleration for Passive, P, PI, PD and
PID at overshoot 53
Figure 4.18: Graph of Vertical Acceleration for Passive, P, PI, PD and
PID at settling time 54
Figure 4.19: Controller response compare to passive system 55 Figure 4.20: Compare the model with and without controller 56 Figure 4.21: Graph response for Vertical Acceleration 56 Figure 4.22: Graph response for Pitch Angle 57 Figure 4.23: Graph response for Roll Angle 57
LIST OF ABBREVIATIONS, SYMBOLS AND
NOMENCLATURES
DOF - Degree of Freedom
ms - Sprung mass
mu - Unsprung mass
K - Stiffness
L - Wheelbase
𝜃𝜃̈ - Pitch angular acceleration
∅̈ - Roll axis angular acceleration
𝐼𝐼𝑥𝑥𝑥𝑥 - Longitudinal axis moment inertia
𝐼𝐼𝑦𝑦𝑦𝑦 - Lateral axis moment inertia
Fd - Force Damper
s
Z
• •
- Vertical acceleration at sprung mass
u
Z
• •
- Vertical acceleration at unsprung mass
𝐹𝐹𝑠𝑠 - Vertical force at each suspension
𝐹𝐹𝑡𝑡 - Vertical force at each tire
Cs - Damping Coeffiecient
Zs - Vertical Acceleration
zsdd - Vertical Acceleration
pdd - Pitch Angle
rdd - Roll Angle
CHAPTER 1
INTRODUCTION
1.0 Introduction
This research studies on vehicle suspension system through the vehicle dynamics model. The mathematical derivation will be performed to produce 7 Degree Of Freedom ride truck utility vehicle. The 7DOF equations will be modeled in Matlab Simulink software in order to simulate the ride behavior of this vehicle. The 7DOF ride model then will be validated using the Carsim Software. Appropriate controller will be proposed in this research in order to improve the vehicle suspension system. Three criteria of vehicle suspension performance will be improved in terms of body roll, pitch and vertical acceleration. (M.Hafiz.et.al.2016)
1.1 Problem Statement
Utility truck has become one of the most popular transport mechanisms. The problem statement from this research is, since the utility truck is essential to increase their speed on the road, the vehicle’s dynamic performance is negatively affected. The suspension system of the vehicle has to be modified in order to compensate for the weakened dynamic behavior. However, improvement possibilities by means of passive suspension technology will eventually reach a limit. To avoid any damage and to ensure the safety of vehicle, suspension system must be improved. Semi-active suspension
system is the alternative method to improve the vehicle suspension system. (M.Hafiz.et.al.2016)
1.2 Objective
The objectives of this study are:
1. To develop the utility truck ride vehicle model. 2. To validate the utility truck vehicle model.
3. To improve the utility truck suspension system by using the appropriate controller.
1.3 Scope
The scopes of this project are:
1. Development of utility truck ride vehicle model using Matlab Simulink software.
2. Validate utility truck ride vehicle model by using Carsim software. 3. Improve the vehicle ride comfort using a semi-active suspension system.
CHAPTER 2
LITERATURE REVIEW
2.0 Introduction
This section discusses about literature of this research. The consideration is about general definition of vehicle suspension, types of suspension model and control strategies for semi-active suspension. Suspension system has been categorised as a part of chassis, which consist of all of the main system located under the car’s body. Basically, vehicle suspension system has spring and dampers which combined together. The roll trade-off of suspension systems has been a long standing challenge for vehicle dynamics performance. When ride performance improved, it almost invariably leads the increasing of vehicle roll overs. Roll overs occurred when overturning moment of the vehicle caused by lateral acceleration and displacement of Centre of Gravity (COG), exceed the restoring forces that supplied by tires. The COG must accelerate outwards and a static balance is no longer possible to respond. The vehicle is tending to involve in a roll accident caused by the less stable.
There are many type of suspension system which categorized as passive, semi-active and active suspension system. The passive suspensions components have capability only dissipate the energy. Passive suspension has the conflict in difficulties of ride comfort and handling. Because of that, these passive suspensions are achieving the border of improvement. In order to overcome these problems, active suspension system has been considered in this research. Active suspension system usually utilised hydraulic actuation to supply power. This leads to the great
power intake and superior level of complexity design. To control body and wheel motion, it required a high bandwidth. A semi-active roll control system is considered in this study where it provides the vehicle with switchable roll stiffness. In case of small lateral forces on the vehicle, the low roll stiffness setting would be implemented. This will improve the ride performance of the vehicle. The vehicle will switch to the higher roll stiffness configuration when greater lateral forces are presented. The vertical bounce stiffness is unaffected under all conditions by changing the roll stiffness of the vehicle. Hence, the ride is just modified in reaction to roll-plane roughness. This system could stay practically implemented with least power consumption.
2.1 Vehicle Suspension System
In automotive systems, ride comfort is one of the parameters to measure the level of suspension.The ride cosiness determines the ability of vehicles to provide passenger comfort. One of the interests of riding comfort is significantly applied to agricultural tractors. It is due to the vibration of the vehicle components and the road disturbance being delivered very high to the passenger compared to other cars (Horton and Crolla, 1984). As the basis of human body posture, comfortable limits required by the driver of the tractor agriculture are similar to drivers of passenger vehicles.Both require comfort, especially during long distances and long working hours. All these situations will affect the effectiveness, awareness, and most importantly the safety of the driver.
Vibration sources which influenced the ride comfort have been classified into two category; road and on-board sources (Jamei, 2002). First, the on-board sources generated from the rotational parts like wheels, driveline and engine. In the frequency range of 25 to 20,000 Hz, it will cause the aural vibration which also known as noise (Gillespie, 1992). These frequencies are low and high frequency based on the threshold of human hearing limits.The road's sources are the second of the vehicle's vibration sources, which indicate road hardness and maneuvering enthusiasts.Usually the
frequency range of these frequencies is 0-25 Hz where the range is the natural sensitivity to the individual body. Hence, the greatest significant feature disturbing vehicle ride comfort is road excitation sources.
Stable and secure vehicle can be realized by handling attributes to ensure constant contact among the tires and road profile. A RLF "Radlastfaktor" factor is defined for calculating vehicle handling (Mitschke, 1984). To perform calculation, vertical dynamic tire force will be added by reviewing vertical standard tire forces. The RLF factor is equivalent toward the rate of the tire force that changes the rate of static tire forces. The higher the value of the RLF factor is the more instability in the tire contact. The efficiency of vehicles handling performance can be determined by using RLF factor. This factor was used to assess the handling capacity of a tractor suspension system (Hope, 2006).
2.2 Classification Vehicle Suspension Systems
The suspension system can be categorized as passive, semi-active and active suspension system which is based on exterior power input to the system and/or its controller bandwidth (Appleyard and Wellstead, 1995). The passive suspension system occurred at the motion defined completely through the path profile which is contains of a non-controlled spring and shock-absorbing damper for example presented in Figure 2.1. While the semi-active suspension for instance shows at Figure 2.2 has similar features as well as the damper has the ability to change the damping rate. For active suspension, the passive mechanisms keep on improved through actuators which can furnish extra force to the system.
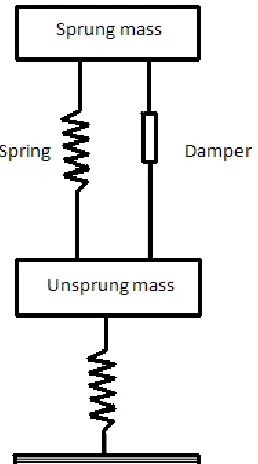
2.2.1 Passive Suspension System
[image:24.612.294.423.372.604.2]Recently, most of the vehicles used passive suspension system to regulate the behaviour motion of a vehicle’s vertical movement, pitch and roll. The term passive shows all the suspension components certainly not allowed supplying force towards suspension system. Next, the passive suspension system as shown in Figure 2.1 regulates the movement of the body and wheel with narrowing together the corresponding speeds with the constant rate that provides the essential ride characteristics. It is implemented by consuming a damping element located in between the body and the wheels of the vehicle, for instance hydraulic shock absorber. The characteristics of the conventional shock absorber form the trade-off between reducing the body vertical acceleration and keeping good tire-road interaction force.
Figure 2.1: Passive suspension