Lime-clay modification and its application in the construction of man-made islands
250
0
0
Full text
(2) Lime - Clay Modification and its Application in the Construction of Man – Made Islands. Thesis submitted by. Mehdi Salehi (BSc.) 2009. in fulfillment of the requirements for the degree of Master of Engineering Science School of Engineering James Cook University.
(3) In the name of God, the beneficent, the merciful Read in the name of thy Lord who creates, Creates man from a clot, Read and thy Lord is most Generous, Who taught by the pen, Taught man what he knew not, Nay, man is surely in ordinate, Because he looks upon himself as self-sufficient Chapter 96 Quran.
(4) STATEMENT OF ACCESS. I, the undersigned, the author of this thesis, understand that James Cook University will make it available for use within the University Library and, by microfilm or other means, allow access to users in other approved libraries.. All users consulting this thesis will have to sign the following statement:. In consulting this thesis, I agree not to copy or closely paraphrase it in whole or in part without the written consent of the author; and to make proper public written acknowledgement for any assistance, which I have obtained from it.. Beyond this, I do not wish to place any restriction on access to this thesis.. Signatures. Date. ii.
(5) STATEMENT OF SOURCES. DECLARATION. I declare that this thesis is my own work and has not been submitted in any form for another degree or diploma at any university or other institution of tertiary education. Information derived from the published or unpublished work of others has been acknowledged in the text and a list of references is given.. Signature. Date. iii.
(6) ACKNOWLEDGEMENTS I would like to express my gratitude and love to Bita and Kimia for their encouragement, patience, support and understanding. Your happiness is my meaning in life, I love you my girls.. I would also like to extend my appreciation and gratitude to my supervisor Associate Professor Nagaratnam Sivakugan for his sincere supervision and guidance throughout the course of this study.. Special thank you to Warren O’Donnel in Geotechnical Laboratory for ongoing technical assistant. Thanks Warren for guidance and for your patience. It was an honor to know and to work with you.. I deeply acknowledge Kellie Johns (Learner Advisor) for her endless help and assistance during the process of thesis writing.. I also acknowledge the financial support received by the school of Civil Engineering, James Cook University.. Special appreciation goes to Chris Park and Mal Campbell from Coffey Pty Ltd for their assistance during the time of sampling in the Port of Brisbane.. iv.
(7) ABSTRACT Due to the scarcity of land following rapid development in many countries, the dredged mud may be used as fill materials to develop new land in coastal zones. Several major infrastructure facilities like ports or airports are strategically situated on these artificial lands. However, soft dredged deposits are intrinsically low in strength, and very high in compressibility. As a result of these inherently undesirable engineering characteristics, an appropriate ground improvement technique has to be employed so as to meet the engineering requirements necessary for the design and construction of overhead infrastructure facilities. The placement of a surcharge preload on a soft foundation facilitated with vertical drains is the most commonplace method used worldwide. Surcharge preloading with vertical drains is used to accelerate the rate of primary consolidation settlement and reduce the magnitude of the post construction secondary compression settlement.. In this study, an attempt was made to provide insight into some factors, aimed at improving the efficiency of the preloading used in a man-made island. A series of laboratory tests was performed to evaluate the effect of clay fabric, altered due to the addition of hydrated lime into slurry, on the primary and secondary consolidation behaviour of the dredged mud samples. As a prime objective, a unique testing method was proposed to determine the threshold value of lime below which the maximum alteration in clay fabric takes place. This threshold is known as Lime Modification Optimum and presents the boundary between modification (i.e. ion exchange and flocculation) and solidification (i.e. formation of the pozzolanic products) phases in limeclay reaction. It was found that, for the type of the dredged mud used in this study, 4 percent of lime (dry weight basis) should be considered as lime modification optimum.. A set of oedometer tests was conducted in both normally consolidated (NC) and artificially overconsolidated (OC) stages on both natural and lime treated samples. The. v.
(8) laboratory findings revealed that with an increase of lime up to 4 percent, the increase of coefficient of consolidation, cv , was observed up to ten fold,. Observation of the test results suggested that in the compression range, the values of the compression index, C c , increase when increasing the lime content whereas in the recompression range, the value of the recompression index, Cr , gradually decreases with increasing % lime. This finding indicated that with increasing % lime, the magnitude of primary consolidation in the NC state increases while in the OC state it decreases. The secondary compression index, Cα , in both the compression and recompression range decreases with increasing % lime. In the compression range the decreasing of Cα together with an increase of C c , results in a gradual reduction of. Cα as the amount of lime increases. It is worthwhile stating that the Cc. surcharging effort was found to be more effective in a further reduction of the secondary compression index of the natural dredged mud in comparison with lime treated dredged mud.. In this study, empirical correlations between coefficient of consolidation, void ratio and corresponding effective stress was proposed and evaluated. It was found that for the type of the dredged mud used in this study, irrespective of the percentages of added lime, the coefficient of consolidation can be obtained by knowing the state of void ratio and effective stress at any instance during consolidation.. Further analyses of the laboratory results by means of Plaxis (finite element model software) and analytical approach suggested that the pretreatment of the dredged slurry with hydrated lime prior to discharging into a containment pond during the construction of man-made islands, may contribute significantly towards the project cost saving strategy.. vi.
(9) PUBLICATION. JOURNAL PAPER: Salehi, M. and Sivakugan, N. (2009). “The effects of lime-clay modification on the consolidation behavior of the dredged mud”: Journal of Waterway, Port, Coastal and Ocean Engineering, ASCE (In Print).. vii.
(10) CONTENTS. Statement of Access. ii. Statement of Sources. iii. Acknowledgement. iv. Abstract. v. Publication. vii. Table of Contents. viii. List of Figures. xii. List of Tables. xvii. CHAPTER 1 INTRODUCTION 1.1 General. 1. 1.2 Research objectives. 3. 1.3 Thesis organization. 4. CHAPTER 2 NEW APPROACH IN GROUNG IMPROVEMENT 2.1 General. 5. 2.2 Application of PFMM. 6. 2.2.1. Mechanism of the method. 7. 2.2.2. Characteristic of clay plugs. 8. 2.2.3. Facilities for PFMM. 9. 2.2.4. Air pressure distribution in the pipe. 10. 2.2.5. Effect of amount of agent on strength properties. 12. 2.3 Construction of Central Japan International Airport. 16. 2.3.1. Details of quality control of the treated soil. 19. 2.3.2. Strength of the fresh treated samples. 23. 2.3.3. Strength of the stabilised ground. 24. 2.4 Reclamation site of the Port of Brisbane in Australia. 27. 2.5 Introduction of dredging fleet in the Port of Brisbane. 29. 2.5.1. Suction Hopper dredger. 29 viii.
(11) 2.5.2. Cutter Suction Dredger. 30. 2.5.3. Bucket Dredger. 31. 2.6 Development of the research question. 31. 2.7 Feasibility of injection of binder into a dredged mud slurry in the Port of Brisbane. 34. CHAPTER 3 CHEMICAL ADDITIVES IN SOILS 3.1 General. 36. 3.2 Constituents of mud. 37. 3.3 Structure of clay particles. 38. 3.4 Interaction of clay particles in suspension. 40. 3.5 Cation Exchange Capacity. 44. 3.6 Principles of clay-binder reactions. 45. 3.7 Lime- the common binder. 48. 3.8 Mechanism of soil-lime interaction. 50. 3.8.1. Hydration. 50. 3.8.2. Ion exchange and flocculation. 51. 3.8.3. Formation of pozzolanic products. 52. 3.9 The threshold value of lime in soil. 53. 3.10 Hydraulic consolidation test. 61. 3.11 Simplified hydraulic consolidation test. 62. 3.12 Summary and conclusion. 65. CHAPTER 4 EXPERIMENTAL PROGRAM – 1 4.1 General. 66. 4.2 Project site. 67. 4.3 Sampling method. 70. 4.4 Particle Size Distribution. 71. 4.5 Atterberg Limits. 73. 4.6 Specific Gravity. 76. 4.7 Quantitative assessment of the mineralogy. 78. ix.
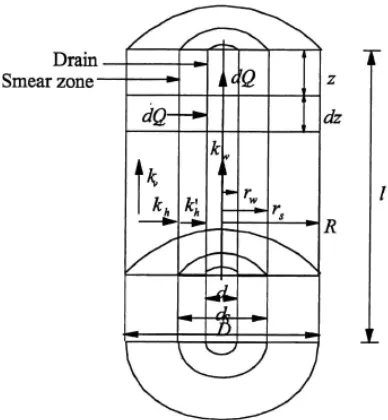
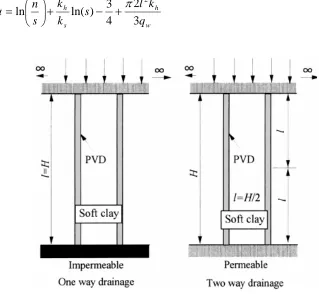
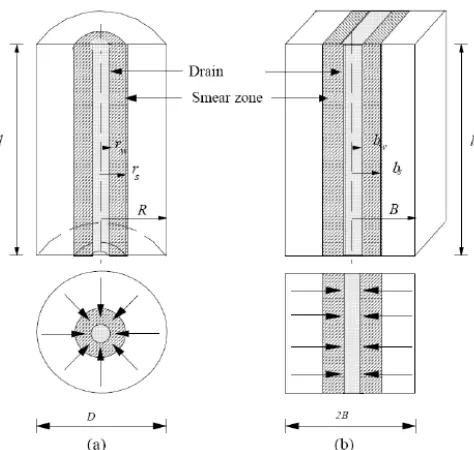
(12) 4.8 Specification of the hydrated lime. 79. 4.9 Characteristics of the seawater. 79. 4.10 Proposed method for LMO. 80. 4.11 Scanning electron microscopy. 88. 4.12 Effect of % lime on sedimentation columns. 90. 4.13 Atterberg limits of the lime treated dredged mud. 93. 4.14 Summary and conclusion. 96. CHAPTER 5 SURCHARGE PRELOAD WITH VERTICAL DRAINS 5.1 General. 98. 5.2 Introduction of the surcharge preloading technique. 99. 5.3 Introduction of concept of aging in clay consolidation. 100. 5.4 Application of the concept of aging in preloading technique. 105. 5.5 Engineering judgment. 105. 5.6 Role of surcharge in secondary compression settlement. 106. 5.7 Function of vertical drains. 114. 5.8 Efficiency of vertical drains. 117. 5.8.1. Smear zone. 117. 5.8.2. Well resistance. 118. 5.9 Diameter of the influence zone of the drain. 119. 5.10 Equivalent diameter of band – shaped drain. 120. 5.11 Revising one-dimensional consolidation with radial flows. 122. 5.11.1 Analysis with smear and well resistance. 124. 5.12 Simple 1 – D modeling of PVD improved subsoil with horizontal drainage boundary. 125. 5.13 Assessment of ground settlement records. 126. 5.14 Back- calculation of c h values from pore pressure measurement. 129. 5.15 Plane strain consolidation model. 129. 5.16 Soft clay modeling. 133. 5.17 Summary and conclusion. 136. x.
(13) CHAPTER 6 EXPERIMENTAL PROGRAM - 2 6.1 General. 139. 6.2 Variable used in the settlement analyses of clay. 140. 6.3 Sample preparation for the oedometer test. 142. 6.4 Data logger system. 144. 6.5 Consolidation test program. 145. 6.5.1. The test procedure and results in NC state. 146. 6.5.2. The test procedure and results in OC state. 167. 6.6 Anisotropy of the dredged mud. 172. 6.7 Summary and conclusion. 179. CHAPTER 7 MODELING OF THE RECLAIMED LAYER 7.1 General. 182. 7.2 Construction sequence of a man-made island. 183. 7.3 Prediction of a ground condition using the laboratory data. 185. 7.4 Finite element model (Plaxis analysis). 191. 7.4.1. Plane strain unit cell analysis of vertical drain. 193. 7.4.2. Vertical drain spacing. 201. 7.4.3. Full embankment analysis with vertical drain. 203. 7.5 Secondary compression settlement. 208. 7.6 Summary and Conclusion. 210. CHAPTER 8 SUMMERY, CONCLUSIONS, AND RECOMMENDATION 8.1 Summary. 212. 8.2 Conclusions. 214. 8.2.1. Laboratory study – phase 1. 214. 8.2.2. Laboratory study – phase 2. 215. 8.2.3. Modeling of a man-made island. 217. 8.3 Recommendations. REFERENCES. 219. 220. xi.
(14) LIST OF FIGURES Figure 1.1. Effect of drain spacing on the consolidation rate of soft foundation. 2. Figure 2.1. Schematic view of plug flow. 7. Figure 2.2. Group of barges for PFMM operation. 9. Figure 2.3. Principles of pneumatic flow mixing method. 10. Figure 2.4. Variation of air pressure with distance from the inlet. 11. Figure 2.5. Variation of UCS with the amount of cement. 14. (a) placement on land; (b) placement under seawater Figure 2.6. Strength Ratio against the amount of cement. 15. (a) placement on land; (b) placement under seawater Figure 2.7. The correlation between coefficients of variation of strength with cement content. 16. Figure 2.8. Schematic view of Pneumatic execution system. 17. Figure 2.9. Schematic view of soil treatment in pneumatic and cement supply barge. 18. Figure 2.10. The placement barge. 19. Figure 2.11. Mixing control system. 21. Figure 2.12. Mixing condition of the treated dredged mud. 22. Figure 2.13. Quality control of treated soil strength. 23. Figure 2.14. Frequency distribution of unconfined compressive strength of freshly treated soil. 24. Figure 2.15. Unconfined compressive strength in field. 25. Figure 2.16. Water content profile of treated soil. 26. Figure 2.17. Aerial view of the Port of Brisbane. 27. Figure 2.18. Trailing suction hopper dredger. 30. Figure 2.19. Bucket Dredger in Operation. 31. Figure 2.20. Discharging method for high moisture content slurry. 35. Figure 3.1. Single silica tetrahedron (shaded) and the sheet structure of silica tetrahedrons arranged in a hexagonal network. 39. Figure 3.2. Single octahedron (shaded) and the sheet structure of octahedral units. 39. Figure 3.3. Helmholtz model of a charged particle in suspension. 41. xii.
(15) Figure 3.4. Electrostatic repulsion between the like-charged ion layers tends to hinder agglomeration of particle in suspension. 42. Figure 3.5. Dependence of the zeta potential of colloidal clay suspensions on charge and ionic radius of different counter-ions. 43. Figure 3.6. Solubility of some soil mineral species in relation to pH. 53. Figure 3.7. Typical structure of (a) Kaolinite, and (b) Montmorillonite. 55. Figure 3.8. Initial consumption of lime of ECC and WB. 57. Figure 3.9. (a) Flocculated and (b) dispersed fabric of clay sediment. 59. Figure 3.10. Schematic view of the simplified seepage consolidation test. 62. Figure 4.1. Sampling location in the Fisherman Island project site. 68. Figure 4.2. Paddock in the Port of Brisbane filled with dredged mud from Moreton Bay. 69. Figure 4.3. Typical geological profiles in the extension project of the Port of Brisbane. 70. Figure 4.4. Shoveling method was conducted for sampling in the paddock of S3b. 71. Figure 4.5. Particle size distribution of the dredged mud from Paddock of S3b in PoB. 73. Figure 4.6. The components of the proposed seepage-induced consolidation apparatus for determination of Lime Modification Optimum. 83. Figure 4.7. Falling head permeability apparatus. 84. Figure 4.8. Variation of coefficient of permeability and average void ratio with % lime in seepage induced consolidation test (MC=350%). 87. Figure 4.9. Variation of coefficient of permeability and average void ratio with % lime in seepage induced consolidation test (MC=550%). 88. Figure 4.10. Scanning electron microscope photographs of (a) non-treated and (b) lime-treated dredged mud. 89. Figure 4.11. Effect of % lime on the sedimentation of the dredged mud. 91. Figure 4.12. Variation of void ratio with % lime in enclosed system. 92. Figure 4.13. Vacuum filtration flask. 94. Figure 4.14. Casagrande’s chart of plasticity. 95. xiii.
(16) Figure 4.15. Atterberg Limits- Dredged Material. 96. Figure 5.1. Surcharge preloading with vertical drains. 99. Figure 5.2. Semi-logarithmic plot of pressure versus void ratio. 101. Figure 5.3. Geological history and compressibility of a ‘young’ and ‘aged’ normally consolidated clay. 103. Figure 5.4. Typical values of PC / P0 observed in normally consolidated late glacial and post-glacial clays. 103. Figure 5.5 Geological history and compressibility of overconsolidated clay. 104. Figure 5.6 Typical settlement- log time consolidation curve. 107. Figure 5.7. Interpretation of secondary compression behavior in terms of. Cα / C c law of compressibility using laboratory data. 110. Figure 5.8. Settlement behaviors before and after surcharging. 111. Figure 5.9. Post-surcharge rebound, and secondary compression behavior of inorganic soft clay, as a function of effective surcharge ratio. 112. Figure 5.10. Unit-cell model of vertical drain in soil. 115. Figure 5.11. Typical drain installation patterns and the equivalent diameter. 120. Figure 5.12. Equivalent diameters of band-shaped PVD from various researchers. 121. Figure 5.13. Schematic of soil cylinder with vertical drain. 123. Figure 5.14. Schematic view of one or two way drainage conditions. 126. Figure 5.15. Graphical illustration of Asaoka’s method. 128. Figure 5.16. Conversion of an axisymmetric unit cell into plane strain condition. 130. Figure 5.17. Isotropic normal consolidation line (NCL) plot in critical state theory. 134. Figure 5.18. Position of the initial void ratio on critical state line. 135. Figure 6.1. Preparation and recovering of a sample for oedometer test. 143. Figure 6.2. Oedometer Apparatus with data acquisition unit. 145. Figure 6.3. Rapid-loading approach adapted in this study. 147. Figure 6.4. Variation in coefficient of consolidation with % lime. 148. Figure 6.5. Effect of % lime on e − log σ 'v curves. 149. Figure 6.6. Variation of Compression index with % lime. 151. Figure 6.7. Variation of coefficient of volume compressibility with xiv.
(17) the effective stress and % lime. 152. Figure 6.8. Variation of Coefficient of permeability with the effective stress. and % lime. 153. Figure 6.9. Variation of permeability with void ratio for different lime-treated. samples. 154. Figure 6.10. Primary consolidation and secondary compression behavior of the. dredged mud with varying amount of the lime under 80 kPa applied pressure. 155. Figure 6.11. Variation of the secondary compression index and compression index with. % lime at effective pressure increment from 40 - 80kPa. 156. Figure 6.12. Variation of the secondary compression index and time for EOP. consolidation with % lime at effective pressure increment from 40- 80 kPa. 157. Figure 6.13. Variation of Cα / C c with % lime at effective pressure increment. 158. Figure 6.14. Relationship between e vs c v for various specimens. 161. Figure 6.15. Variation of “a” , and “b” with effective applied pressures. 162. Figure 6.16. Void ratio vs log-time curve at 25 kPa for the treated. specimen (0% lime). 164. Figure 6.17. Void ratio vs log-time curve at 80 kPa for the treated. specimen (1% lime). 164. Figure 6.18. Void ratio vs log-time curve at 160 kPa for the treated. specimen (4% lime). 165. Figure 6.19. Variation of primary consolidation and secondary compression settlement. with % lime after the effective surcharge ratio of 0.66. 169. Figure 6.20. Variation of primary consolidation and secondary compression settlement. with % lime after the effective surcharge ratio of 0.33. 169. Figure 6.21. Variation of recompression index corresponding to the end of primary. consolidation with % lime. 170. Figure 6.22. Variation of secondary compression index with % lime and different. effective surcharge ratio. 171. Figure 6.23. Components of the modified Oedometer apparatus. 173. Figure 6.24. Oedometer test with outwards radial drainage for the natural dredged mud. under effective applied pressure of 160 kPa. 175. xv.
(18) Figure 6.25. Oedometer test with outwards radial drainage for the lime-treated dredged. mud (4% lime) under effective applied pressure of 80 kPa. 176. Figure 7.1. Construction sequence of a man-made island. 184. Figure 7.2. Schematic view of the containment pond before and after. the placement of surcharge preload. 186. Figure 7.3. Development of the total effective overburden pressures. from surface to the middle of dredged layers under application of the surcharge preload. 190. Figure 7.4. One-half of the unit-cell vertical drain. 194. Figure 7.5. Settlement versus time for three unit-cell models (Plaxis). 197. Figure 7.6. Deformed mesh of unit cell with 0% lime. 198. Figure 7.7. Deformed mesh of unit cell with 2% lime. 198. Figure 7.8. Deformed mesh of unit cell with 4% lime. 199. Figure 7.9. Settlement versus time for three unit-cell models (Analytical approach) 201 Figure 7.10. The approximate number of the vertical drains in three. conceptual sites treated with varying percentages of lime. 202. Figure 7.11. Finite element mesh of embankment. 203. Figure 7.12. Lateral deformation contours at the toe of embankment. for the model with 0% lime (30 days construction phase). 204. Figure 7.13. Lateral deformation contours at the toe of embankment. for the model with 2% lime (30 days construction phase). 205. Figure 7.14. Lateral deformation contours at the toe of embankment. for the model with 4% lime (30 days construction phase). 205. Figure 7.15. Lateral deformation contours at the toe of embankment. for the model with 0% lime (90 days construction phase). 206. Figure 7.16. Lateral deformation contours at the toe of embankment. for the model with 2% lime (90 days construction phase). 206. Figure 7.17. Lateral deformation contours at the toe of embankment. for the model with 4% lime (90 days construction phase). 207. Figure 7.18. Secondary compression settlements of the three sites. treated with varying percentages of lime. 209. xvi.
(19) LIST OF TABLES Table2.1. Properties of clay plug measured in the field test. 8. Table 2.2 Factors affecting the strength increase of treated soil. 12. Table 2.3 Typical soil properties and mixing condition of excavated dredged soils. 20. Table 3.1 Cation Exchange Capacity of Clay Minerals. 45. Table 4.1 Initial moisture content of the dredged mud under 35 cm dry crust (S3b). 72. Table 4.2 The effects of temperature on Atterberg Limits of the dredged mud. 76. Table 4.3 Variation of specific gravity with degree of temperature. 77. Table 4.4 The quantitative XRD results of the dredged mud. 78. Table 4.5 Composition of the hydrated lime used in the study. 79. Table 4.6 The properties of seawater. 80. Table 4.7 Atterberg Limits of lime treated dredged mud. 94. Table 5.1 Values of Cα / C c for different soils. 108. Table 6.1 The relationship between C c and (1 + e0 ). 151. Table 6.2 Empirical coefficients and R-squared values of figure 6.15. 161. Table 6.3 Coefficient of consolidation values at different stages of consolidation. 166. Table 6.4 The values of c h and c v and state of anisotropy of the natural and. lime treated dredged mud. 177. Table 7.1 Characteristics of the three models of dredged mud layer. 191. Table 7.2 The input parameters for permeability conversion approach. 195. Table 7.3 Soil parameters of sand fill. 196. Table 7.4 Soil Parameters for the dredged mud models. 196. xvii.
(20) Chapter 1 Introduction. Chapter 1. Introduction 1.1 General There are many countries around the world encountering a shortage of land in their ports, harbors and in general, coastal zones. To meet the increasing demand of development in these countries, it is necessary to construct different types of infrastructure, such as industrial or residential complexes, recreational facilities, airports and ports on new reclaimed lands. Usually a large volume of fill materials has to be implemented as foundation material to build such large-scale facilities. The conventional technique for the backfilling and construction of reclaimed ground is to use sand fill, mainly from inland (i.e. hill cuts materials). However, with the increasing scarcity of such fill materials, particularly in coastal zones where both environmental legislation and dominant soft clay stratums hinder the project developer, utilizing materials of low engineering properties has been considered.. At the same time, dredging and maintenance of shipway channels is vital to facilitate navigation for vessels importing and exporting commodities to and from harbors. Recycling the dredged material for construction purposes in coastal areas eliminates the cost of transporting inland soil to the project site and in the meantime it contributes to the protection of the natural environment. However, the dredged mud mainly consists of silt or clay grains and together with the presence of high moisture content, results in a lack of shear strength and poor consolidation characteristics. Hence, some kind of treatment is needed to achieve adequate engineering properties for the soft ground.. To improve the engineering behaviour of the soft mud deposit that is created during the construction of man-made islands, several improvement techniques are available in. 1.
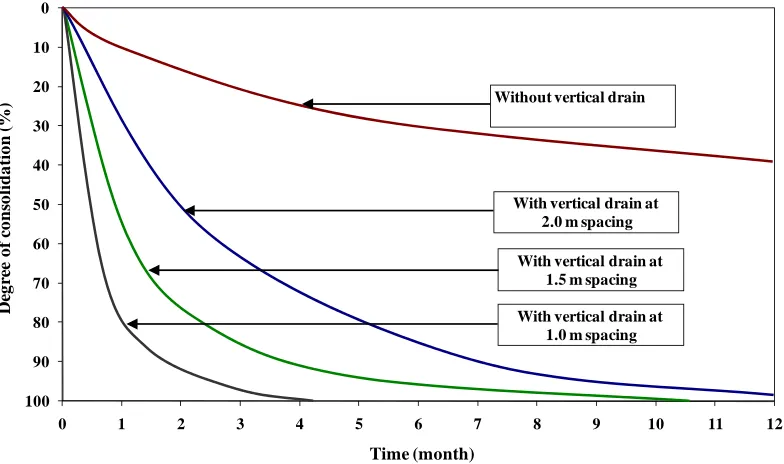
(21) Chapter 1 Introduction geotechnical engineering practices, one of which is surcharge preload. The placement of surcharge preload on the soft foundation with the installation of vertical drains is the most commonplace method used worldwide. The consolidation of soil under preload is the process of decreasing the volume of saturated soil by expelling the pore water. The rate of expelling the pore water is governed by the compressibility, permeability and length of the drainage path. Figure 1.1 shows that the distance between installed vertical drains has a significant role in controlling acceleration of the ground settlement.. 0 10. Degree of consolidation (%). 20. Without vertical drain. 30 40 With vertical drain at 2.0 m spacing. 50 60. With vertical drain at 1.5 m spacing. 70. With vertical drain at 1.0 m spacing. 80 90 100 0. 1. 2. 3. 4. 5. 6. 7. 8. 9. 10. 11. 12. Time (month). Figure 1.1 Effect of drain spacing on the consolidation rate of soft foundation (Lau et al. 2000). Hence, to meet a tight construction schedule, the reduction of drain spacing might seem to be a viable solution to reduce the required time for preloading. However, one should note that the increase in number of installed vertical drains for the purpose of acceleration of consolidation may bring about reduction in discharge capacity of wells (due to smearing) and also contribute a significant cost towards project development which may not be desirable. Thus, increasing the rate of a soft ground settlement without reducing the drainage path necessitates the exploring of and research into other possible innovative technologies. This research tries to asses in the laboratory scale the modification effect of. 2.
(22) Chapter 1 Introduction lime, added to dredged mud, on the primary and secondary consolidation behaviour of the treated mud. A practical solution involving the injection of binders into the dredged mud slurry in a large industrial scale has been recently invented to enhance the geotechnical properties of the soft dredged deposits. Pneumatic Flow Mixing Method (PFMM) is a novel ground improvement technique that has been initiated and developed in Japan in recent years. In this method, which is applicable to the construction of a manmade island utilizing the dredged mud, dredged soft soil is mixed with a small amount of stabilizing agent, usually cement. The stabilizing agent is injected into a pipe by way of compressed air during the transportation of the dredged mud and is eventually gently placed on the bottom of the containment ponds for sea reclamation.. 1.2 Research objectives The main objective of this project was to develop a laboratory framework to evaluate the modification effects of lime on the consolidation behaviour of the dredged mud obtained from the Port of Brisbane. This research tried to highlight the beneficial aspects of pretreatment of the dredged mud slurry with lime, to pave the way for considering a new approach in ground improvement practices where both the chemical treatment and surcharge preloading are employed as a combined technique to enhance the engineering properties of soft dredged deposits. In attempt to reach this point, excessive laboratory tests were conducted on the ultra-fine dredged clayey sample which was collected from the selected containment pond in the Port of Brisbane. As a preliminary experimental goal, a new laboratory test method was proposed to identify the lime threshold, below which the maximum flocculation of clay particles takes place. After determination of the maximum amount of required lime content, the primary consolidation and secondary compression behaviour (with and without surcharge) of the natural and lime treated dredged mud was investigated. In addition to conventional oedometer tests, a newly designed retaining ring with a radial drainage condition was employed to investigate the anisotropy of the natural and lime treated dredged mud.. 3.
(23) Chapter 1 Introduction As a second objective of this research, modeling of the consolidation behaviour of the reclamation layer of the three conceptual sites under surcharge preload was carried out by the finite element modeling method (FEM) using the commercial finite element modeling software of Plaxis Version 8 (Netherland, 2008). The consolidation behaviour of the conceptual sites was analysed in unit-cell and full-scale embankment simulation, under plane strain conditions. The unit cell model analysis aimed to verify the effect of % lime on the required influence zone of the vertical drain to meet the given consolidation period. The scope of the full-scale embankment analysis was to evaluate the effect of % lime on the lateral displacement of the soft ground under embankment. The extent of the post-construction secondary compression settlement of the conceptual model for the design life of 100 years was also presented and compared for the layers with varying lime %. It should be noted that unless otherwise stated, the laboratory data produced throughout the experimental program was employed to provide the input data for modeling practices.. 1.3 Thesis organization In chapter 1, a brief introduction is presented where the aim and scope of the present study is highlighted. The following chapter 2 aims to provide inside into the new approach in ground improvement and develops the research question. Chapter 3 discusses general theory of physico-chemical properties of clay soils together with study of the chemical reactions of the most common binders like cement and lime with clayey soil. In chapter 4, the first round of the experimental program conducted in this study is presented. In chapter 5, the history and general theories of vertical drains, surcharge preloading, and basic requirements of modeling soft ground treated with vertical drains are detailed. Chapter 6 illustrates the comprehensive laboratory test program conducted throughout this research study. In chapter 7, the consolidation behaviour of the three conceptual reclaimed layers is modeled by Plaxis. Chapter 8 presents the summary, conclusion, and recommendation for future research followed by the bibliography.. 4.
(24) Chapter 2 New Approach in Ground Improvement. Chapter 2. New Approach in Ground Improvement. 2.1 General Dredging is the term given to digging, gathering, or pulling out material from the bottom of the sea or rivers in order to maintain waterways and navigation channels for commercial and recreational vessels. Due to the scarcity of land following rapid development in many countries the dredged sediment obtained from the process of dredging may then be used as fill materials to develop new land in coastal zones. Several major infrastructure facilities like ports or airports are then strategically situated on these artificial lands. However, soft dredged deposits are intrinsically low in strength, and very high in compressibility. As a result of these inherently undesirable engineering characteristics, an appropriate ground improvement technique has to be employed so as to meet the engineering requirements necessary for the design and construction of overhead infrastructure facilities. To enhance the mechanical properties of the dredged sediments, several techniques are available in geotechnical engineering practices. One of the ground improvement schemes that may be adapted is chemical stabilization using cement or lime. In recent years, a new soil improvement technique has been developed in Japan, named the “Pneumatic Flow Mixing Method” (PFMM), in which dredged soft soil is mixed with a small amount of stabilizing agent, usually cement, by way of compressed air in a pipe during transportation and then deposited in containment ponds for sea reclamation. The soil mixture deposited and cured on site can achieve relatively high strength so that no additional soil improvement is needed for building the overhead structure. This method requires only stabilizing agent supplier facilities to an existing pneumatic vessel and no mixing blade is used to mix soil and agent. This method is recognized as an economical technique for the construction of, for example, a man-made island, within a relatively short 5.
(25) Chapter 2 New Approach in Ground Improvement period of time. It was found by the author that the only literature available in regard to the implementation of the PFMM consists of only a few journal and conference papers associated with the construction of the Central Japan International Airport (CJIA). This chapter presents the only available case history of the reclamation project where PFMM has been successfully executed in terms of relatively high shear strength development in cement-treated dredged mud. It has to be mentioned that whilst still significant, this thesis is not concerned with the development of shear strength of the treated-soft soil, as there are abundant investigations adopting various perspectives in studying this parameter of treated soil. In fact, the review of the case history of construction of the Central Japan International Airport (CJIA) merely improves our understanding about the mechanism of this method and the involved factors during its execution in the construction project of a man-made island. The insight into the mechanism of PFMM helps to detect the constraints and ultimate feasibility of the injection of a binder into dredged mud slurry in man-made island reclamation projects where only conventional dredging vessels are utilized for dredging purposes. The ongoing man-made island reclamation project of the Port of Brisbane (PoB), characteristics of the employed dredge vessels, and the current ground improvement method used on the site are briefly presented in this chapter. Following that, the research question on which this study has been developed is discussed. This research aims to introduce and evaluate, in laboratory scale, a new approach of the chemical-clay mixing in ground improvement practices associated with construction of man-made islands. The feasibility of injection of the chemical binders into dredged mud slurry prior to discharging into the containment ponds in the Port of Brisbane is also discussed in this chapter.. 2.2 Application of PFMM The Pneumatic Flow Mixing Method (PFMM) has been recently employed in construction of man-made island for Central Japan International airport at Nagoya region. The construction project started in the year 2000 and was completed in 2005. During the reclamation phase, a total of 8.6 million cubic meters of dredged mud was stabilized by. 6.
(26) Chapter 2 New Approach in Ground Improvement the PFMM to create a part of the airport island (Kitazume and Satoh, 2005). This section explains the development of PFMM and its application to the Central Japan International Airport (CJIA) project as well as demonstrates some mechanical properties of the cement treated dredged soil.. 2.2.1 Mechanism of the PFMM method Conveying dense dredged mud with a low amount of dissolved air in a pipe requires high pressure due to the occurrence of friction between soil grains and the inner surface of the pipe. As a remedy, a relatively large amount of compressed air can be injected into the pipe frequently, so that soft soil is separated into small segments as it is moved throughout the pipe by the injected air. The separated soil segment or block is called a “Plug” and is continuously moved forward to an outlet by a force of compressed air. Figure 2.1 shows the schematic flow of plugs within a pipe.. Figure 2.1 Schematic view of plug flow (Kitazume and Satoh, 2003) The formation of plugs and air cushions together in the pipe reduces the degree of friction on the pipe’s inner surface and consequently, lower air pressure would be required to transport the plugs. It should be noted that the characteristics of the plug is highly dependent on the mixing ratio of soil and air, also the diameter of the pipe. The required air pressure depends upon many factors, such as the properties of soil, volume of injected air, and diameter and length of the pipe (Kitazume and Satoh, 2005). In the CJIA project, an inlet air pressure of 400-500 kN/m2 was frequently adopted. It was found that as the speed of clay plugs exceeded 10 m/s in a pipe, turbulent flow was generated within the plugs because of friction occurring on the inner surface of the pipe (Kitazume and Satoh 2005). Under turbulent conditions, the clay plugs and stabilising agent can be mixed. Kitazume and Satoh discussed that at least a minimum pipeline length of 50-100 m is necessary to. 7.
(27) Chapter 2 New Approach in Ground Improvement ensure appropriate mixing. It has been found that this method is applicable for the treatment of a large variety of soils with sand fraction content less than 30% (Kitazume and Satoh, 2005).. 2.2.2 Characteristics of clay plugs The properties of three clay plugs obtained from preliminary field tests are presented in Table 2.1. Table2.1. Properties of clay plug measured in the field test (Mixing design for CJIA) (Kitazume and Satoh, 2003). It can be found that the clay plugs with an average volume of 0.36 m3 are conveyed at an average speed of about 12 m/s and with an average interval of about 6 seconds. The field tests also demonstrated that these properties were almost independent of the transported soil volume and amount of cement added. Due to the relatively high speed of the plug in the pipe, and as a result of friction, turbulent flow was produced within the plugs. Under this turbulent condition, the stabilising agent can be added and mixed thoroughly. Former research efforts revealed that the uniform mixing of clay with an agent can be obtained under a flow condition where the Reynolds number lies in the range of 500 to 3000. The Reynolds number is identified as:. Re = uD / v. where u is the plug speed, D is the pipe diameter, and v is the viscosity of the plug.. 8.
(28) Chapter 2 New Approach in Ground Improvement. 2.2.3 Facilities for PFMM Figure2.2 shows a group of barges with specific arrangements for the pneumatic flow mixing method utilised in Japan.. Figure 2.2 Group of barges for PFMM operation (Kitazume and Satoh, 2005) To perform the Pneumatic flow mixing method in reclamation projects, a group of different barges should be employed. This includes a pneumatic barge, a stabilising agent supplier barge and placement barge. As the most common procedure, firstly, the dredged mud is loaded into the hopper of the pneumatic barge and is transported by means of compressed air to the supplier barge via a pipe (i.e. formation of plug). A stabilising agent, usually cement, in the form of slurry, is then injected to the soft soil in the stabilising agent supplier barge and mixed well in the pipe. In general, there are two major types of methods according to which the stabilising agent is injected; compressor addition and line addition. In the former method, the stabilising agent is injected to the soft soil before the compressed air is injected into a pipe.. 9.
(29) Chapter 2 New Approach in Ground Improvement. Figure2.3. Principles of pneumatic flow mixing method (Kitazume and Satoh, 2005) In the later model of barges assembly however, the stabilisation agent is added to the pipe after air injection (Figure 2.3). In both techniques, the soil-additive mixture is allowed to be deposited in the reclamation site through a cyclone in the placement barge. The main function of the placement barge is to release the pressure transporting the soil plugs. A specific pipe is usually used to place the soil mixture under seawater. Care must be taken to avoid entrapping the seawater within treated soil plugs because seawater can cause a considerable decrease in treated soil strength. There are various suggested methods in the stabilising agent injection technique and transporting technology to improve the efficiency of the clay-binder mixture. One is an additional device installed along the pipeline to detect the location of a plug and estimate its volume in order to inject a sufficient amount of slurry directly into clay plugs. Alternatively, a flexible wall tube, where the diameter or shape of pipe is changed locally, may be used to spot the soil plug.. 2.2.4 Air pressure distribution in the pipe The longevity of air pressure injected into a pipe to transport the soil plugs is dependent on many factors. These include the characteristics of clay, the volume of injected air, the diameter of the pipe, and its length. The variation of air pressure with the transport distance from the inlet, measured in the field test, is plotted in Figure 2.4.. 10.
(30) Chapter 2 New Approach in Ground Improvement. Figure 2.4 Variation of air pressure with distance from the inlet (Kitazume and Satoh, 2003) In all three tests presented in Figure 2.4., a water content of soft marine clay was about 100% (Kitazume and Satoh, 2003). It can be seen that a relatively large reduction of pressure occurred between the pneumatic barge (P0) and stabilising agent supply barge (P1), and this was irrespective of the test condition. The large reduction of air pressure in the pipe in the short distance from P0 to P1 was attributed to the continuous presence of dredged mud in the pipe. In fact, between these two points the clay in the pipe was still in a transitional condition in the formation of plug flow. Within the distance between the stabilising agent supply barge and inlet of placement barge, P1 to P3, the air pressure decreases linearly and it reached almost zero at the outlet of the placement barge (P4). The decrease in air pressure between P1 to P4, was thought to be attributed to the wall friction in the pipe. Figure 2.4 also presents the affect of the volume of clay on the reduction of air pressure within the distance of transportation. It was found that with increasing volumes of transported soil, a higher air pressure needed to be produced at the pneumatic barge.. 11.
(31) Chapter 2 New Approach in Ground Improvement It was also found that the addition of cement causes an increase of pressure up to about 100 kN/m3 ,at the inlet P0, which is due to an increase of the cohesion and adhesion of the cement –clay mixture.. 2.2.5 Effect of amount of agent on strength properties The extent of increased strength of the treated soil is governed by a range of factors, and in particular, the nature of the chemical reaction between soil and stabilising agent. These factors may be divided into four broad categories as shown in Table 2.2.. Table 2.2 Factors affecting the strength increase of treated soil (Terashi, 1997) Characteristics of Stabilising agent Characteristics and conditions of soil (specially important for clays) Mixing conditions Curing conditions. 1- type of stabilizing agent, 2- Quality, 3- Mixing water and additives 1- physical, chemical and mineralogical properties of soil, 2- Organic content, 3- pH of pore water, 4-water content 1-Degree of mixing, 2- Timing of mixing, 3- Quality of stabilizing agent 1- Temperature, 2- Curing time, 3- Humidity, 4- Wetting and drying/ freezing and thawing. A series of laboratory and field tests was conducted by Kitazume and Satoh (2003) to investigate the strength increase and its deviation of treated soil for the mixing design of the Central Japan International Airport. The relationship between % cement and gained unconfined compressive strength, qu , of treated soils (i.e. preliminary investigation) used in the Central Japan International Airport project are presented in Figure 2.5. Two types of field strengths are plotted and shown in the Figure; (a): treated soil discharged on dry land, and (b): treated soil placed under seawater. In this investigation, the amount of cement is defined as a dry weight of cement per one cubic meter of soil to be treated. The group of treated soil, named ‘laboratory’, refer to the samples prepared and cured in a laboratory. The specimens named ‘mold’ represent the soil-cement mixture obtained at the outlet of the 12.
(32) Chapter 2 New Approach in Ground Improvement discharging pipe but having being cured in a laboratory. The specimens named as ‘core’ and ‘L core’ are in situ treated soil samples which were cured under field conditions. The specimens of ‘core’ were 5 cm in diameter and 10 cm in height, while the ‘L core’ was a cylindrical sample 50 cm in diameter and 100 cm in height. Figure 2.5 shows that of the specimens prepared in the laboratory, as % cement increased, the unconfined compressive strength increased linearly. It was found in Figure 2.5(a) that in case of discharging the treated soil on dry land, the unconfined compressive strength of all the treated soil increased almost linearly with an increase in the amount of cement irrespective of specimen type. This figure also shows that the laboratory samples achieved the highest values of strength among all the test specimens. The samples obtained and cured in the field show a large increase in strength. However, it was found that the strength development in the ‘L core’ samples was relatively less than the ‘core’ samples. Figure 2.5(a) also reveals that the minimum amount of 40 kg/m3 of cement lead to 100 kN/m2 of gained unconfined compressive strength in the laboratory but the influence of such an amount of cement on strength development in the field were negligible. Figure 2.5(b) provides a comparison between strength development of treated soil in the field and laboratory in the case where treated soil is placed under seawater. This Figure shows that the strength of the field treated soil, ‘core’, was relatively small compared with the ‘laboratory’ specimen. This difference was likely attributed to entrapped seawater with treated soil during placement. In order to compare the development of strength in cement treated dredged mud between laboratory and field-manufactured samples, the strength test results of field tests were normalised with laboratory results and the data are presented in Figure 2.6. It was found that the strength ratio of various specimens was not constant and rise with an increase in the amount of cement, irrespective of field soil type. Figure 2.6 indicates that an addition of cement less than 50 kg/m3 in a practical operation in the field yielded a negligible increase of strength in comparison with the laboratory condition (strength ratio: 0.05-0.3). Figure 2.6(a) shows that the strength ratio of the core soil lied between 0.6-0.8 for placement on dry land when the amount of added cement was 60-80 kg/m3. Figure 2.6(b) also presents. 13.
(33) Chapter 2 New Approach in Ground Improvement the strength ratio of the field core samples placed under seawater. Comparison of the figures 2.6(a) and 2.6(b) shows that with a certain amount of added cement, as a result of placement of the cured dredged mud under seawater, approximately 20% reduction of strength ratio of core samples was observed when compared with samples cured on dry land. This was likely due to increased water content of the treated soil as a result of entrapment of seawater during placement. This fact also indicates that during placement of plugs on the sea bed, great care should be taken to avoid entrapment of seawater.. Figure 2.5 Variation of UCS with the amount of cement (a) placement on land; (b) placement under seawater ( Kitazume and Satoh, 2003). 14.
(34) Chapter 2 New Approach in Ground Improvement. Figure 2.6 Strength ratio against the amount of cement (a) placement on land; (b) placement under seawater (Kitazume and Satoh, 2003) Figure 2.7 summarises the relationship between the amount of added cement and the coefficient of variation of unconfined compressive strength. It was noted that strength deviation was highly dependent on the amount of cement, the manufacturing technique, and the size of specimens. This figure presents the test results of several field-manufactured treated soils together with the specimens prepared under laboratory conditions. It was found that the coefficient of variation of laboratory specimens was relatively small and lied. 15.
(35) Chapter 2 New Approach in Ground Improvement in the constant range of approximately 15% irrespective of the amount of added cement. On the other hand, the field-manufactured treated soils demonstrated a relatively large coefficient of deviation compared with the laboratory specimens.. Figure 2.7 The correlation between coefficients of variation of strength with cement content (Kitazume and Satoh, 2003) Figure 2.7 also shows that the average coefficient of variation of the small field specimen, termed ‘core’ is about 25% irrespective of the amount of stabilizing agent. The coefficient of variation of the large specimens termed ‘L core’ was almost the same as that of the core samples as long as the amount of cement exceeds the value of 50kg/m3. Figure 2.7 shows that for a small amount of cement i.e., 38 kg/m3, in the L core the coefficient of variation was relatively large - around 60%. Overall, this Figure indicates that a small amount of cement cannot be distributed properly within the mass of dredged mud by the pneumatic flow mixing method.. 2.3 Construction of Central Japan International Airport To construct the man-made island of CJIA, a total amount of 70 million cubic meters of various soils, of which, 8.6 million cubic meters dredged mud was used (Kitazume and Satoh, 2003). The island, with a plane area of 5.8 million m2 has been constructed on the. 16.
(36) Chapter 2 New Approach in Ground Improvement seabed at about 3-10 m in depth (Ketazume and Satoh, 2005). The pneumatic flow mixing method was employed to enhance the mechanical properties of the dredged materials. Three sets of pneumatic execution systems including a pneumatic barge, a cement supply barge, and placement barge operated on the construction site to complete the project within the 15 months period (Figure 2.8).. Figure 2.8 Schematic view of Pneumatic execution system (Kitazume and Satoh, 2003) A total of 8.6 million m3 of dredged soil was excavated at 12 sites in Nagoya Port and transported by barge to the project site. After being premixed by a backhoe arm in the barge, the soft soil was poured into the hopper on the pneumatic barge. Ultra-large obstacles such as cobble and steel wire were removed by the sieve installed at the top of hopper. The soft soil was then mixed with an extra amount of seawater to adjust its initial water content to the target value in order to ensure transporting capacity and designed strength. The soil was moved forward using a sand pump and its density was measured by means of a γ-ray density meter. The water content of the soil was calculated based on the measured density to obtain the amount of cement slurry to be added, in accordance with the preliminary test results. Compressed air pressure between 390 to 490 kN/m2 was injected into the transporting pipe with a diameter of 76 cm to form a plug flow and to transport the soil to the cement supplier barge. The cement slurry was manufactured at the batching plant on the cement supplier barge, with a water/ cement ratio of about 100%. After injection of cement slurry into the soil, the soil mixture was then transported towards the outlet by means of compressed air along a maximum 1500 m long pipeline (see Figure 2.9). A. 17.
(37) Chapter 2 New Approach in Ground Improvement cyclone was installed at the outlet on the placement barge to release the air pressure and for transporting energy (see Figure 2.10).. Figure 2.9 Schematic view of soil treatment in pneumatic and cement supply barge (Kitazume and Satoh, 2003). The placement of treated soil was carried out in two stages: Firstly, placement was made under water level at a reduced level between -1.5 and -5 m. During this operation, a tremie pipe was used to place the treated soil on the seabed, so only a little amount of seawater could be entrapped within the soil mixture. The utmost care to avoid entrapping water is necessary; otherwise a remarkable reduction in the shear strength will be expected.. 18.
(38) Chapter 2 New Approach in Ground Improvement. Figure 2.10 The placement barge (Kitazume and Satoh, 2003) After several weeks of curing, to ensure the strength development of the treated soil, a layer of soil mixture was placed on the previous layer to the design level of +2.5 m. Extra care was taken not to entrap seawater within the clay mixture. The sea reclamation with treated soil started in June 2001 and was finalised in October 2002 (Kitazume and Satoh, 2005).. 2.3.1 Details of quality control of the treated soil The type of dredged mud and initial moisture content always varies with location and depth of the dredged site. During construction of CJIA, a total of approximately 8.6 millions m3 of soil was excavated at 12 sites in Nagoya Port (Kitazumeh and Satoh, 2005). The properties of the dredged soils differ from site to site as shown in table 2.3.. 19.
(39) Chapter 2 New Approach in Ground Improvement Table 2.3 Typical soil properties and mixing condition of excavated dredged soils (Kitazume and Satoh, 2005). The mixing conditions were required to be changed for each soil obtained from the particular excavated site. For ease of quality control of the treated soil, a new index, the water/cement (w/c) ratio, was introduced in the project (Kitazume and Satoh, 2005). The w/c ratio is defined as the weight of whole water, including what is apparent in both the soil and cement slurry, and the dry weight of cement. It is worthwhile mentioning that according to the preliminary test results, the unconfined compression strength, qu , of the treated samples was almost inversely proportional to the w/c, and a unique relationship was obtained for each dredged soil (Kitazume and Satoh, 2005). In order to maintain uniformity of the properties of cement treated soils obtained from various locations, a mixing control system was employed in the project as illustrated in Figure 2.11.. 20.
(40) Chapter 2 New Approach in Ground Improvement. Figure 2.11 Mixing control system (Kitazumeh and Satoh, 2005) The mixing control system operates as follows: •. First, the volume and density of the soft dredged mud in the pipe were determined by means of a flowmeter and a γ-ray densitometer respectively. The data logger acquisition unit continuously sends gathered information to the PC on the pneumatic barge.. •. Secondly, the amount of required cement to be mixed was evaluated to obtain the target ratio of water content to cement, w/c., and then the PC computer stationed on the agent supplier barge controlled the amount of cement to be injected into a plug.. During execution of PFMM of the Central Japan International Airport, the density and amount of the water content were measured by means of the data acquisition unit at a time interval of 20 seconds to determine the required amount of cement to be mixed. Figure 2.12 shows a typical example of an execution chart of the dredged mud slurry properties and the amount of cement added, which was determined during the operation of one transporting barge. It is shown in Figure 2.12 that the water content of he treated soils varied over a range of 106-118%, whereas the target water content was designed to be around 110%. The amount of cement was controlled within the range of around 50-65 kg/m3, depending on. 21.
(41) Chapter 2 New Approach in Ground Improvement the fluctuation of the water content in order to maintain w/c ratio of around 14.0. Figure 2.12 also shows the variation of water/cement ratio w/c, recorded at the same time. The w/c value was calculated from the measured volume of dredged soil and that of the injected cement slurry. Kitazume and Hayano (2007) pointed out the measured w/c was close to the targeted w/c of 14.0. A small fluctuation in w/c ratio proves the high accuracy in controlling w/c and it was expected that the strength variance of the cement-treated soil to be considered negligible.. Figure 2.12 Mixing condition of the treated dredged mud (Kitazume and Hayano, 2007). To ensure the uniformity of the mixing process, the freshly treated soil was sampled on the placement barge every 15 minutes and was poured into a mould 5 cm in diameter and 10 cm in height. The samples were cured in a laboratory for 4 weeks and then subjected to an unconfined compression test. The test results of the unconfined compressive strength of typical specimens are shown in Figure 2.13. This figure also shows the envisaged values of the gained strength based on the measured w/c ratio (Kitazumeh and Satoh, 2005). It was found that the estimated values of strength fluctuates within the range of 225-420 kN/m2, while the measured strength of the samples lies within the range 280-370 kN/m2.. 22.
(42) Chapter 2 New Approach in Ground Improvement. Figure 2.13 Quality control of treated soil strength (Kitazumeh and Satoh, 2005). 2.3.2 Strength of the fresh treated samples During the construction period which lasted up to 1.5 years, freshly treated soil was sampled on the placement barge at regular intervals from every 25000 m3 of produced dredged mud. The representative samples were poured into a mold of 5 cm in diameter and 10 cm height. After four weeks of curing in an air-conditioned laboratory, the unconfined compression test was conducted on the specimens. Figure 2.14 shows the frequency distribution of the measured unconfined compressive strength. The figure suggests that there was a relatively large scatter in the measured data, ranging from 150- 800 kN/m2. However, the gained strength of the majority of the specimens lay between 300-450 kN/m2 with an average value of 430kN/m2. The coefficient of variation was found at about 32.7%. These data proved that the manufactured process of treated dredged mud was well controlled. The measured average strength was about 37% higher than the design value of 314 kN/m2 (Kitazume and Satoh, 2005).. 23.
(43) Chapter 2 New Approach in Ground Improvement. Figure 2.14 Frequency distribution of unconfined compressive strength of freshly treated soil (Kitazume and Satoh, 2005). 2.3.3 Strength of the stabilised ground For the cement treated ground, a series of field cone tests and unconfined compressive strength tests on core samples were conducted on a regular basis. This was performed for every 25000 m3 of the placed treated mud to ensure the design strength as well as to feedback to the mix design if it was necessary (Kitazumeh and Satoh, 2005). Figure 2.15 presents the depth profile of measured unconfined compressive strength. As it is shown, there was remarkable scatter in the measured data. However, the figure shows that the average gained strength of the treated soil was considerably higher than the target value of 120 kN/m2. Figure 2.16 shows the depth profile of the sampled specimens with their associated moisture content of the samples. Again, there was considerable scatter in measured data with an average value of 105%. It was found that the average water content of the treated soils placed above and below water level were 97% and 107% respectively, which confirms the entrapping of seawater into treated soil during placement below water level. As a conclusion, it can be said that the entrapped seawater reduces the strength of treated soil placed below water level (Kitazumeh and Satoh, 2005).. 24.
(44) Chapter 2 New Approach in Ground Improvement. Figure 2.15 Unconfined compressive strength in field (Kitazumeh and Satoh, 2005). 25.
(45) Chapter 2 New Approach in Ground Improvement. Figure 2.16 Water content profile of treated soil (Kitazumeh & Satoh, 2005). 26.
(46) Chapter 2 New Approach in Ground Improvement. 2.4 Reclamation site at the Port of Brisbane in Australia The Port of Brisbane is one of the growing Ports on Australia’s east coast (Figure 2.117). Due to rapid commercial growth and high demand for space, the Port of Brisbane Corporation (PBC) has made a decision to locate all its facilities into one area on Fisherman Island and to expand this area over the period of 25 years.. Figure 2.17 Aerial view of the Port of Brisbane. To achieve this goal, POB is reclaiming a few paddocks (or containment ponds) to extend the length of Fisherman Island by 1.8 km and to create an extra 230 hectares of land. This conveyance gives the Port critical land and water area, creating an opportunity to develop significant improvements in the Port’s capacity and efficiency of its marine terminals and in-house cargo transportation services. On Fisherman Island, Port land has been developed by reclaiming and filling land utilising materials dredged from the Brisbane River berths,. 27.
(47) Chapter 2 New Approach in Ground Improvement Moreton Bay and river shipping channels. Approximately 1.2 million cubic meters of mud is dredged out of the Brisbane River and Moreton Bay each year (Kinhill, 1999). This utilises a vast amount of containment area which is usually located in the nearby marine zones. The reclaimed mud generally comprises silty clay, although a variation in material characteristics and occurrence of segregation across the paddocks are expected because of the single point discharge system, with coarser materials depositing closer to the discharge point. The utilization of this material for the reclamation project confirms that the material, that otherwise would have to be disposed of at great cost, can be used in a beneficial way. In fact, the use of this dredged material in the construction of the port reduces the demand for importing soil from inland precincts at higher price. However, it should bear in mind that the dredged materials consists of a high water content caused by the process of cutter and suction dredging. Due to high moisture content and presence of substantial fine fractions, the dredged material shows poor engineering characteristics. This material has to be settled for long periods before enough water has been squeezed out to achieve sufficient strength and stiffness. Methods of improving the dredged mud’s engineering characteristics would increase the possible uses of the material and ultimate value. Soil improvement can broadly be described as a countermeasure applied to soft soils to enhance the performance of the ground in terms of increasing strength, decreasing permeability or controlling deformation (Porbaha, 1998). The decision on which viable ground improvement technique to use depends generally on the future use, importance, and construction period of the project area. The simplest ground improvement technique is to put a surcharge preload higher than the anticipated future load so as to preconsolidate the soil to the required effective stress (Terashi and Katagiri, 2005). It should be noted that the magnitude of surcharge defines the rate of post construction secondary compression settlement. In the past, the Port of Brisbane Corporation has adopted this technique to the west and north of the project site.. 28.
(48) Chapter 2 New Approach in Ground Improvement However, due to large vertical drainage paths of the thick reclaimed deposits, this technique often requires a long consolidation period, which is not ideal in many land reclamation projects. Therefore, the application of preloading alone may not be feasible with tight construction schedules and hence, a system of vertical drains is often introduced to achieve accelerated radial drainage and consolidation by reducing the length of the drainage paths (Lau et al. 2000). The rate of expelling the pore water is governed by the compressibility, permeability and length of the drainage path. Hence, to meet a tight construction schedule, the reduction of drain spacing might seem to be a viable solution to reduce the required time for preloading. However, one should note that the increase in number of installed vertical drains for the purpose of acceleration of consolidation may contribute a significant cost to the project development which may not be desirable. Hence, increasing the rate of soft ground settlement without reducing the drainage path necessitates research into other possible innovative technologies.. 2.5 Introduction of dredging fleet in the Port of Brisbane The principal type of dredging equipment used in the land reclamation works are the cuttersuction dredger, Bottom opening dredger, trailer suction hopper dredger and the bucket dredger. For the maintenance of the port and Moreton Bay, the Port of Brisbane Corporation currently utilizes a fleet of vessels for different dredging operations. A description of the dredges and their application are reviewed.. 2.5.1 Suction Hopper Dredger Brisbane is the POB’s trailing suction hopper dredger and is the main and biggest dredger in the POB’s fleet. Brisbane has the latest state-of-art automation control and navigation systems and is capable of performing capital and maintenance dredging in accordance with the latest environmental standards. It is used for maintenance and development dredging and reclamation works in the port.. 29.
(49) Chapter 2 New Approach in Ground Improvement. Figure 2.18 Trailing suction hopper dredger The suction dredger utilizes a hydraulic system that sucks up the material using large pumps as the dredge moves, scraping the material into the inlet pipe. The dredged material is pumped into the hopper, with a capacity of 2900 cubic meters, and is transported to the disposal site then pumped via a fixed or floating pipeline to the disposal area. Through this process the water content of the material is increased by as much as five times its in situ state. This technique utilizes the increase of water content so that the material can be pumped long distances. It also minimises the plumes of muddy water associated with excavation dredging.. 2.5.2 Cutter Suction Dredger The Amity is the POB’s cutter suction dredger and is used for developing berths and associated reclamation at the river mouth. This dredger, like the trailing hopper suction dredge, utilizes a hydraulic system that sucks up the material using large pumps and with the assistance of the rotating auger tip, can cut through a wider range of materials. The dredged material can be transported via a fixed or floating pipeline to the disposal area in the same manner as the hopper suction dredger.. 30.
(50) Chapter 2 New Approach in Ground Improvement. 2.5.3 Bucket Dredger The bucket dredger utilizes a bucket to excavate the material, like the common forward loading excavator on land. There are two main types of bucket for different types of dredging applications. The Ken Harvey is a clam bucket dredger used by the POB to dredge port berths and approaches, and is usually employed in small-scale dredging operations with a 3.25 cubic meters bucket. The material is placed into a barge or hoppers and transported to the disposal area. This type of dredging process takes the material in its current state and does not significantly increase the water content, allowing relatively easy manipulation.. Figure 2.19 Bucket Dredger in Operation. 2.6 Development of the research question The case history study of the construction of CJIA with the application of PFMM, revealed the feasibility of an injection of binder into the dredged mud slurry prior to discharging into a pond. However, as far as the development of shear strength of treated dredged mud is concerned, the successful application of a pneumatic flow mixing method is highly dependent on the degree of water content of the dredged mud slurry. Higher initial or final moisture content of dredged mud, results in a remarkable reduction of gained unconfined shear strength and consequently, unsuccessful application of PFMM.. 31.
(51) Chapter 2 New Approach in Ground Improvement It also can be understood that the sophisticated design of the PFMM system, which comprises a series of different linked barges, is considered suitable to deal with the low moisture content of dredged mud. As explained in the case history, the main reason for the injection of high air pressure into a system is to form discrete plugs of dredged mud in order to reduce friction between the dredged material and inner surface of the pipe as soil flows in. Besides, the installation of a cyclone at the outlet of a placement barge is also considered necessary to release the excess air pressure before the placement of plugs on the seabed. As a conclusion, it can been said that to execute the procedure of mixing dredged mud slurry with a binder, a simpler arrangement of operational vessels might be required once the slurry moisture content condition is not a factor to negatively affect the desired properties of treated soil. This research aims to define the different objective for the addition of binders into a dredged materials used in the Port of Brisbane. In fact, in spite of PFMM where improvement in shear strength of the treated soil is considered as a target, the current study tries to evaluate some other aspects of reactions which take place between clay particles and chemical binders and investigates the effects of the reactions on the consolidation properties of the dredged mud. The study conducted here tries to blend the principles of both the surcharge preloading and PFMM techniques, in the laboratory scale, and then answer questions about the mechanical response of the treated sediment only from the point of view of consolidation and permeability and not other geotechnical aspects such as shear strength. However, to make the outcomes of this bench-scale research useful for the large industrial scale project like Port of Brisbane, high moisture content slurry is used throughout the experimental program in this study. This approach is adopted to ensure that on the basis of new defined objective, the high moisture content has no negative affect on the gained properties of the treated dredged mud. During the course of this research project, attention is directed toward the beneficial use of lime as a binder which possesses a power to modify the physico-chemical properties of clay particles. As dredged mud is mixed with certain amount of lime during a dredging operation, the clay particle surface properties would change significantly. Hence, one should expect different consolidation behaviour of a deposited reclamation layer when. 32.
(52) Chapter 2 New Approach in Ground Improvement it is later subjected to the external load of preloading during the ground improvement phase. The literature survey shows that in the case of soft ground treated with a prefabricated vertical drain, the consolidation due to radial flow towards the vertical drain is proportional to both the coefficient of consolidation and inversely proportional to the square value of the diameter of influence zone of drain (Please refer to chapter 5 for further explanation). This fact indicates that under a certain diameter of influence zone of vertical drain, with an increase in the coefficient of consolidation of dredged mud, the degree of consolidation will increase within a specific elapsed time. The literature review (Chapter 3) shows that when lime is added to the clayey soil, as a result of flocculation, the permeability will increase which leads to an increase in the coefficient of consolidation. The implicit conclusion of the above two facts may now be drawn; that if lime is added to the dredged mud during the process of dredging, when it comes to ground improvement by application of preloading with a vertical drain, due to newly gained larger values of coefficient of consolidation, a smaller number of drains needs to be installed. In other words, adding lime into dredged mud slurry increases the coefficient of consolidation of clay, which in turn offsets the requirement for smaller drain spacing to meet a scheduled preloading time. Furthermore, it is well known that the magnitude of surcharge defines the extent of postconstruction secondary compression settlement (Chapter 5). Hence, as a second beneficial aspect of the injection of lime into the dredged mud, it is envisaged that the lime treated dredged mud will require a lower surcharge to present the allowable creep settlement under the final design load. This expectation is again attributed to the mechanism of flocculation, which is brought about by lime addition.. 33.
(53) Chapter 2 New Approach in Ground Improvement. 2.7 Feasibility of injection of binder into a dredged mud slurry in the Port of Brisbane The study of the case history of the construction of Central Japan International Airport with the application of PFMM revealed the feasibility of utilizing current modern technology in the injection of the binder into the dredged mud slurry prior to discharging into a pond. However, even though the execution of this method may cut the need for further ground improvement techniques on the reclamation layer and eventually results in a shorter time period for completion of the project, this technology may attract little interest by project developers as it requires a new generation of execution vessels that may not be available for current ongoing man-made island projects around the world. The application of PFMM requires a series of different linked barges to deal with low moisture content of dredged mud. This is because, as far as the development of shear strength of treated dredged mud is concern, the successful application of a pneumatic flow mixing method is highly dependent on the degree of water content of the dredged mud slurry. Hence, the invention of the PFMM system helps to inject high air pressure into a system to form the discrete plugs of dredged mud to mitigate the friction between the dredged material and inner surface of the pipe as soil flows in. Besides, the installation of a cyclone at the outlet of the placement barge is also considered to release the excess air pressure before placement of plugs on the bed. For these reasons it can be said that when it comes to the improvement of problematic soft grounds, the application of commonplace practices like the surcharge preload may seem more desirable. As a pragmatic proposal, it can be suggested that once the initial and final moisture content of slurry is not concerned, a simpler version of chemical injection system can be carried out to add the binder into the dredged mud slurry prior to discharging into the containment ponds. However it should be noted that this suggestion is made based on the philosophy on which this research study is established. According to the viewpoint of this study, the degree of initial moisture content of dredged slurry may not be a factor to govern the. 34.
(54) Chapter 2 New Approach in Ground Improvement alteration of the physico-chemical properties of the mud where it is treated with hydrated lime. On the other word, in spite of PFMM in which development of shear strength of cement-treated dredged mud is concerned, a chemical injection system may be considered in order to add small amount of chemical to the high moisture content dredged mud to only change the physico-chemical properties of the clay particles. The alteration of clay particles with the presence of lime is discussed in detail in chapter 3. According to this approach, it seems that with increasing initial moisture content to a high level (i.e. 350-550%), there is no further need for both the Pneumatic system, to reduce friction, and the placement barge with the cyclone system to carefully handle the treated plugs (Figure 2.20). This proposed method may now be called the “Flow Mixing Method” instead.. Figure 2.20 Discharging method for high moisture content slurry. 35.
Figure

+7


Related documents
Web-based education (WBE) cannot replace the traditional approach but it can provide a necessary balance to its limitations (Driscoll, 1998) as well as support the needs of both
Figures 3.8 A-D: Correlations between protein contents and lipid absorbance values of plants and adult female and egg samples collected from basil plants fertilized with four
Refinery margins, caught as they are be- tween the ever rising crude acquisition costs and the depressed ex-refinery prices, have thus tended to shrink and, on average, have
This experiment employed the optimum thermal stimulation (group D) during the out-of-season barbel reproduction, owing to which it was possible to achieve a very high
Мөн БЗДүүргийн нохойн уушгины жижиг гуурсанцрын хучуур эсийн болон гөлгөр булчингийн ширхгийн гиперплази (4-р зураг), Чингэлтэй дүүргийн нохойн уушгинд том
The high level of coastal litter in the study region adds to the findings of the Report on the State of the Mediterranean Marine and Coastal Environment, which
Reception children and Year 1 have been working hard and learning popular christmas carols for this very festive and traditional time of the year. The Year 2 students wrote a letter
