Open Access
Research article
The risks of malaria infection in Kenya in 2009
Abdisalan M Noor*
1,2, Peter W Gething
3, Victor A Alegana
1, Anand P Patil
3,
Simon I Hay
1,3, Eric Muchiri
4, Elizabeth Juma
5and Robert W Snow
1,2Address: 1Malaria Public Health and Epidemiology Group, Centre for Geographic Medicine, KEMRI - University of Oxford - Wellcome Trust Collaborative Programme, Kenyatta National Hospital Grounds (behind NASCOP), P.O. Box 43640-00100, Nairobi, Kenya, 2Centre for Tropical Medicine, Nuffield Department of Clinical Medicine, University of Oxford, CCVTM, Oxford OX3 7LJ, UK, 3Spatial Ecology and Epidemiology Group, Tinbergen Building, Department of Zoology, University of Oxford, South Parks Road, Oxford, OX1 3PS, UK, 4Division of Vector-Borne and Neglected Diseases, Ministry of Public Health and Sanitation, P.O Box 20750, 00100 GPO, Nairobi, Kenya and 5Division of Malaria Control, Ministry of Public Health and Sanitation, P.O Box 19982, 00202 KNH, Nairobi, Kenya
Email: Abdisalan M Noor* - [email protected]; Peter W Gething - [email protected];
Victor A Alegana - [email protected]; Anand P Patil - [email protected]; Simon I Hay - [email protected]; Eric Muchiri - [email protected]; Elizabeth Juma - [email protected]; Robert W Snow - [email protected] * Corresponding author
Abstract
Background: To design an effective strategy for the control of malaria requires a map of infection and disease risks to select appropriate suites of interventions. Advances in model based geo-statistics and malaria parasite prevalence data assemblies provide unique opportunities to redefine national Plasmodium falciparum risk distributions. Here we present a new map of malaria risk for Kenya in 2009.
Methods: Plasmodium falciparum parasite rate data were assembled from cross-sectional community based surveys undertaken from 1975 to 2009. Details recorded for each survey included the month and year of the survey, sample size, positivity and the age ranges of sampled population. Data were corrected to a standard age-range of two to less than 10 years (PfPR2-10) and each survey location was geo-positioned using national and on-line digital settlement maps. Ecological
and climate covariates were matched to each PfPR2-10 survey location and examined separately and in combination for relationships to PfPR2-10. Significant covariates were then included in a Bayesian geostatistical spatial-temporal framework to predict continuous and categorical maps of mean PfPR2-10 at a 1 × 1 km resolution across Kenya for the year 2009.
Model hold-out data were used to test the predictive accuracy of the mapped surfaces and distributions of the posterior uncertainty were mapped.
Results: A total of 2,682 estimates of PfPR2-10 from surveys undertaken at 2,095 sites between 1975 and 2009 were selected for inclusion in the geo-statistical modeling. The covariates selected for prediction were urbanization; maximum temperature; precipitation; enhanced vegetation index; and distance to main water bodies. The final Bayesian geo-statistical model had a high predictive accuracy with mean error of -0.15% PfPR2-10; mean absolute error of 0.38% PfPR
2-10; and linear correlation between observed and predicted PfPR2-10 of 0.81. The majority of Kenya's 2009 population (35.2
million, 86.3%) reside in areas where predicted PfPR2-10 is less than 5%; conversely in 2009 only 4.3 million people (10.6%) lived in areas where PfPR2-10 was predicted to be ≥40% and were largely located around the shores of Lake Victoria.
Conclusion: Model based geo-statistical methods can be used to interpolate malaria risks in Kenya with precision and our model shows that the majority of Kenyans live in areas of very low P. falciparum risk. As malaria interventions go to scale effectively tracking epidemiological changes of risk demands a rigorous effort to document infection prevalence in time and space to remodel risks and redefine intervention priorities over the next 10-15 years.
Published: 20 November 2009
BMC Infectious Diseases 2009, 9:180 doi:10.1186/1471-2334-9-180
Received: 18 September 2009 Accepted: 20 November 2009
This article is available from: http://www.biomedcentral.com/1471-2334/9/180 © 2009 Noor et al; licensee BioMed Central Ltd.
Background
As most endemic countries begin to re-focus their malaria control goals, including in some cases a target of elimina-tion [1], contemporary maps that reliably define sub-national variation in disease risk are required to inform priority setting and the selection of appropriate suites of intervention. Recent efforts at developing empirical global maps of Plasmodium falciparum risk herald a new era of using maps to define regional populations at risk of malaria to guide the future global malaria control agenda [2]. However, the applicability of malaria risk mapping to make predictions at spatial scales and time points neces-sary for effective health service planning and review depends largely on the amount and resolution of infor-mation available. For example, it is recognized that conti-nental risk maps may not provide sufficient detail and precision for national and sub-national level control pri-ority setting [2].
Kenya is one of very few countries that have a plethora of malaria risk data, spanning over 30 years. The earliest attempts to describe the spatial distribution of malaria risk in Kenya were based on expert opinion of malaria sea-sons and climate [3]. Between 1998 and 2005 several attempts were made by our group to model the predictive accuracy of this historical map [4,5] or use historical par-asite prevalence data and remotely sensed proximates of climate to predict risk using sub-optimal spatial methods that were unable to define fully the uncertainty in the modeled maps [6,7]. Here we present a more robust Baye-sian model-based geo-statistical spatial-temporal method to predict the risk of malaria in Kenya in 2009 using the largest assembled contemporary empirical evidence for any country in Africa. As a new phase of malaria control in Kenya begins, the implications of the resulting malaria risk map for decision makers and the prospects for the future of malaria control nationwide are discussed.
Methods
P. falciparum parasite rate as a marker of risk
There are many measures of the intensity of malaria trans-mission [8,9]. Direct measures of transtrans-mission intensity applicable for malaria modeling include the entomologi-cal inoculation rate (EIR) and the basic reproductive number (Ro). EIR is the number of parasite-specific infec-tious bites received by a person per unit time and Ro is the average number of secondary infections resulting from one infected individual being introduced into a non-immune host population. These indices are rarely meas-ured, however, thus limiting their utility for spatial mod-eling [10]. An alternative measure of P. falciparum malaria risk is the parasite rate (PfPR), which is the proportion of a random sample of population with malaria parasites in their peripheral blood, used frequently to define transmis-sion intensity since the 1950's [11] and has a predictable
mathematical relationship to the rarely sampled measures of EIR and Ro [12-14]. The PfPR has therefore become the benchmark indicator by which malaria risk is modeled and mapped in Africa [2,6,7,15-17].
Data identification
PfPR survey data were identified using basic search princi-ples and inclusion criteria described elsewhere [18] with two notable exceptions: firstly survey data were included if surveys were undertaken from 1st January 1975, because
of the rich Ministry of Health survey data between 1975 and 1984 [19]; and secondly no restriction was placed on sample size for inclusion in the spatial modeling [2].
Data searches included online searches for peer-reviewed publications using PubMed [20] and African e-repositor-ies [21]; manual searches of monthly returns archived from over 40 field stations maintained by the Ministry of Health's Division of Vector Borne Diseases; reviews of master's and doctoral thesis titles and abstracts from the Universities of Nairobi and Jomo Kenyatta; access to household survey data supported as part of national [22] or sub-national sample surveys on malaria or nutrition [23,24]; and an extensive correspondence and data shar-ing exercise with the prolific malaria research community in Kenya or those working in the country but based over-seas [25]. Data searches began in 2005 and were com-pleted with final reviews of published reports and correspondence with national research groups on 31st
March 2009. All data were entered into a customized Microsoft Access (Microsoft 2007) database to include information on survey location, survey timing (month and year), age ranges of the sampled population, sample size, numbers reported positive for P. falciparum infection and the methods of parasite detection [18].
Pre-processing of PfPR survey data
Geo-location techniques
data-bases such Microsoft Encarta (Microsoft 2007), Alexandria Digital Library [28] and Falling Rain Genomics Inc. Global Gazetteer [29] were used. A database of enu-meration areas for the 1999 census obtained from the Kenya National Bureau of Statistics was used as a final source if survey data could not be positioned using the other sources. Survey locations were classified as points if they could be positioned to an area ≤10 km2; wide area
(>10 km2 to <25 km2); or polygon (≥25 km2) [18].
Age standardization of PfPR
Under stable endemic transmission PfPR is age-depend-ent and rises during early childhood, peaks in older chil-dren and falls through adolescence and adulthood, the rate of decline a consequence of development of anti-par-asitic immunity [14]. PfPR surveys, however, are often reported for a variety of age-ranges. The assembled PfPR data were therefore standardized to the classical age-range of 2 to less than 10 years using an algorithm based on cat-alytic conversion models first adapted for malaria by Pull and Grab [30] and modified by Smith et al., [14]. This age-standardized parasite rate, henceforth referred to as PfPR
2-10, was computed for each survey report [2].
Assembling and testing ecological and climate covariates
A number of ecological and climatic factors affect the development and survival of the P. falciparum parasite and the malaria-transmitting Anopheles vector [31]. National and regional malaria risk modelling efforts have used var-ious proximate determinants of infection and disease risk including continuous and categorical forms of urbaniza-tion [17,32,33], rainfall [4,15-17,34-37], vegetaurbaniza-tion cov-erage [15,17,32,35,38,39], aridity [36,40], distance to water bodies [5,15-17,35-37,41,42], altitude [4,5,36,37] and temperature [4,5,15-17,34-37,39,41]. We elected to explore the discriminatory effects of these covariates derived from census, meteorological, topographical and remotely sensed satellite sources all described in detail in Additional File 1. All covariates were re-sampled to 1 × 1 km spatial resolutions using ArcGIS 9.2 (ESRI, Redlands, CA, USA) and matched to survey locations where the numbers of individuals examined were ≥50 (n = 2,094).
The relationships of the covariates in their continuous and categorical forms were first visually examined against PfPR2-10 data using scatter and box plots. These were used to aggregate the covariates into suitable categories that corresponded to biologically appropriate definitions, pre-vious applications of remotely sensed variables and reten-tion of effective sample sizes (see Addireten-tional File 1). A univariate non-spatial binomial logistic regression model was then implemented for each covariate with PfPR2-10 as the dependent variable in Stata/SE Version 10 (Stata Cor-poration, College Station, TX, USA). The results of the uni-variate analyses were used to determine the relative
strength of each candidate covariate as a predictor of PfPR2-10 and identify those which qualified for inclusion in the Bayesian geostatistical model. First, where there was more than one plausible way of categorizing a covariate, the size of the odds ratio, the Wald's p-value and the value of Akaike Information Criterion (AIC), a measure of the goodness of fit of an estimated statistical model [35], were used to determine which approach resulted in categories with the strongest association with PfPR2-10 [SI 1]. Once the best categorizations were determined, a collinearity test of all the covariates was undertaken and if a pair had a correlation coefficient > 0.9 [43], the variable with the highest value of AIC was dropped from subsequent anal-ysis. The selected covariates were then analysed in a bino-mial multivariate logistic regression with PfPR2-10 as the
dependent variable. Using backwards variable elimina-tion, covariates with Wald's P > 0.2 were removed step-wise until a fully reduced model was achieved.
Bayesian space-time models
Using the Kenya PfPR2-10 data and the selected covariates, a spatial-temporal Bayesian generalized linear geostatisti-cal model [2] was implemented to predict a malaria map of Kenya for 2009. Bayesian geostatistical models provide the ability to predict values of a spatially continuous event at unsampled locations using combinations of the sam-pled data in space and time, and importantly allow for calculation of robust uncertainty estimates around model predictions [2,43,44]. The underlying assumption of the Kenya PfPR2-10 model was that the probability of preva-lence at any survey location was the product of two fac-tors. First, a continuous function of the time and location of the survey, modified by a set of covariates, and mod-elled as a transformation of a space-time Gaussian ran-dom field. Second, a factor depending on the age range of individuals sampled in each survey. The distribution of the second factor [2] was based on the procedure described by Smith et al. [14]. The Bayesian spatial-tem-poral model was implemented in two parts starting with an inference stage in which a Markov Chain Monte Carlo (MCMC) algorithm was used to generate samples from the joint posterior distribution of the parameter set and the space-time random field at the data locations. This was followed by a prediction stage in which samples were generated from the posterior distribution of PfPR2-10 at each prediction location on a 1 × 1 km grid. Details of the spatial-temporal Bayesian geostatistical models are pre-sented in Additional File 2.
Model validation and measures of uncertainty Selection of model validation test data
that was closest to each point relative to all other points around each survey location. A 10% sample of the larger Kenya PfPR2-10 dataset was then drawn randomly. Each data point had a probability of selection proportional to the area of its Thiessen polygon so that data located in densely surveyed regions had a lower probability of selec-tion than those in sparsely surveyed regions [45]. The Bayesian spatio-temporal geostatistical model was then implemented in full using the remaining 90% of data.
Computing model accuracy and uncertainty
A series of validation statistics were computed by compar-ing the predicted PfPR2-10 values to actual PfPR2-10 observed at the validation locations. The validation statis-tics were: the linear correlation coefficient; mean error (ME); and mean absolute error (MAE) is a measure of the bias of predictions (the overall tendency to over or under predict). Finally, the probability of membership of a sur-vey location to its assigned endemicity class (see next sec-tion) was computed as a measure of uncertainty. These probabilities, ranging from 1 (no uncertainty in class membership) to 0.14 (membership equally likely to all classes) were computed from the posterior distributions resulting from the Bayesian geostatistical model as explained in detail in Additional File 2.
Malaria risk classifications and estimations of populations exposed to risk
Seven endemicity classes of PfPR2-10 were selected: <0.1%; ≥0.1% and < 1%; ≥1% and <5%; ≥5% and <10%; ≥10% and <20%; ≥20% and <40%; ≥40%. These classes were selected as they can be used to compute approximates of the traditional measures of endemicity [11], are congruent with recommendations for the selection of suites of vector control and the timelines to effective transmission control [9,46,47] and allow for interpretation of lower risk catego-ries where the predominant spatial risks are not among the higher endemicity classes. The probability of member-ship to each endemicity class was estimated from the pos-terior probability distributions of PfPR2-10 for each pixel generated by the Bayesian geostatistical model, as described in Additional File 2.
A high-resolution (100 × 100 m) population distribution map of Kenya [48] was used to compute the number of people in each of the malaria endemicity classes. This map was constructed from a combination of satellite imagery and land cover maps which were used to develop models that identified the location of settlements [48,49]. The modelled settlements map was then used to redistribute census population counts within the small enumeration area polygons. The resulting high-resolution map repre-sented estimated population distribution in Kenya for the year 2000. This raster population surface was then pro-jected to 2009 using provincial inter-censal growth rates
from the 1999 national census [50]. The raster malaria endemicity map was then overlaid on the projected pop-ulation map and the number of people in each endemic-ity class, overall and by province, was extracted using ArcGIS 9.2 Spatial Analyst tool.
Results
Assembled data
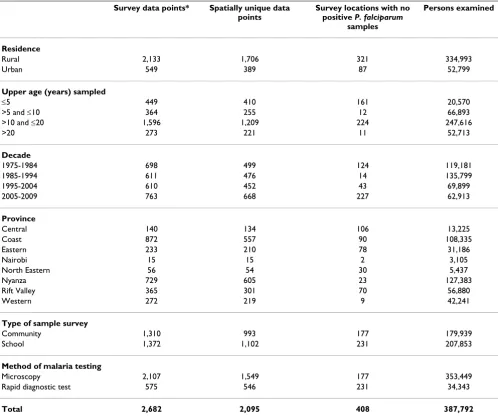
A total of 2,756 PfPR random sample surveys were assem-bled for the period 1975-2009. Of these, 74 survey loca-tions were excluded from analysis because they were polygons (n = 30); were not positioned (n = 41); or were missing survey month (n = 3). Of the remaining 2,682 data points (Table 1), 1,672 (62.3%) were obtained from Ministry of Health reports; 364 (13.6%) from peer-reviewed journal articles and conference abstracts; 111 (4.1%) from theses; and 535 (19.9%) from unpublished grey literature and personal communication sources. The majority of surveys were undertaken in rural areas (n = 2,153, 80.3%). A significant number of surveys were undertaken as part of school health surveillance since 1975 (n = 1,372, 51.1%). Of the total survey sample 2,095 (78.1%) were spatially unique locations (shown in Figure 1) while the remainder (587, 21.9%) were surveys under-taken in the same locations but at different times between 1975 and 2009. Most of the survey locations (73%) were positioned using GPS coordinates. A sample semivario-gram of the PfPR2-10 data indicated the presence of spatial autocorrelation up to lags of 1 decimal degree or the equivalent of ~111 km at the equator (Figure 2).
Testing of climate and ecological covariates
The univariate analysis showed that all the biologically selected categorical covariates were statistically significant predictors of differences in PfPR2-10 (see Additional File 1 and Table 2). There was reduced risk of infection in areas that were: urban compared to rural; of minimum average annual temperature of <16°C compared to ≥16°C; of maximum average annual temperatures of <25°C or >30°C compared to between 25°C - 30°C; of zero or 1-3 sets of three continuous months of precipitation >60 mm in an average year compared to corresponding precipita-tion patterns that occurred >3 sets in an average year; where EVI was ≤0.3 compared to >0.3; where the survey was located at an altitude of ≤500 m or >1500 m com-pared to between >500-1500 m above sea level; and were at a distance to main water bodies of >12 km relative to ≤12 km (see Additional File 1 and Table 2).
maximum temperature (R2 > 0.70) and both had
compar-atively higher AIC values [SI 1]. From the multivariate analysis the risk of malaria parasite infection was lower in locations that were: urban compared to rural (odds ratio, 95% CI: 0.50, 0.36-0.70, p < 0.001); of maximum temper-atures <25°C (0.25, 0.12-0.52, p < 0.001) or >30°C (0.61, 0.44-085, p = 0.003) compared to between 25°C- 30°C; of zero (0.53, 0.36-0.83, p = 0.005) or 1-3 (0.63, 0.46-0.85, p = 0.003) sets of three continuous months of pre-cipitation >60 mm in average year compared to >3 sets; and at distance to water bodies of >12 km (0.62, 0.49-0.77, p < 0.001) relative to ≤12 km (Table 2). Although there was a reduced risk of infection prevalence at EVI of ≤0.3 (0.77, 0.57-1.06) compared to >0.3, this was not
sta-tistically significant (p = 0.114). This, however, did not preclude the inclusion of EVI in the final model set as it still met the inclusion criteria with a P value < 0.2 and the AIC value of the multivariate model was lower with it compared to without.
Bayesian predicted risk projected to 2009
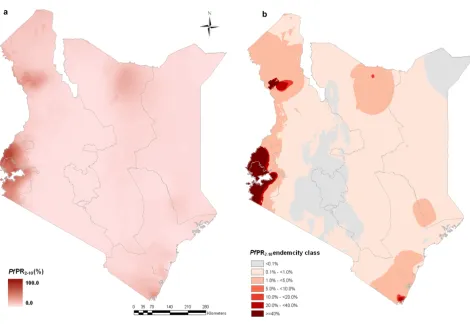
[image:5.612.57.555.110.528.2]The 2009 map of the predicted posterior mean distribu-tion of PfPR2-10 is shown in Figure 3a. The predicted malaria endemicity class map is shown in Figure 3b and indicates that the majority of the country's surface area falls into endemicity classes of <5% PfPR2-10. The lowest endemicity class (< 0.1% PfPR2-10) covers most of Nairobi and Central provinces and some parts of the Eastern and
Table 1: Summary of the Kenya PfPR survey data showing the number of survey data points and the sample size across different categories.
Survey data points* Spatially unique data points
Survey locations with no positive P. falciparum
samples
Persons examined
Residence
Rural 2,133 1,706 321 334,993
Urban 549 389 87 52,799
Upper age (years) sampled
≤5 449 410 161 20,570
>5 and ≤10 364 255 12 66,893
>10 and ≤20 1,596 1,209 224 247,616
>20 273 221 11 52,713
Decade
1975-1984 698 499 124 119,181
1985-1994 611 476 14 135,799
1995-2004 610 452 43 69,899
2005-2009 763 668 227 62,913
Province
Central 140 134 106 13,225
Coast 872 557 90 108,335
Eastern 233 210 78 31,186
Nairobi 15 15 2 3,105
North Eastern 56 54 30 5,437
Nyanza 729 605 23 127,383
Rift Valley 365 301 70 56,880
Western 272 219 9 42,241
Type of sample survey
Community 1,310 993 177 179,939
School 1,372 1,102 231 207,853
Method of malaria testing
Microscopy 2,107 1,549 177 353,449
Rapid diagnostic test 575 546 231 34,343
Total 2,682 2,095 408 387,792
Province map of Kenya showing the distribution of 2,095 spatially unique survey locations out of the 2,682 selected for analysis Figure 1
Rift Valley provinces (Figure 3b). The endemicity class of between 0.1 and 1% covers most of the North Eastern, Eastern, Rift Valley and Coast provinces. High transmis-sion areas (endemicity class ≥40% PfPR2-10) were pre-dicted mainly in small parts of Nyanza province along the shores of Lake Victoria and cover <2% of the total area of Kenya.
Model validation
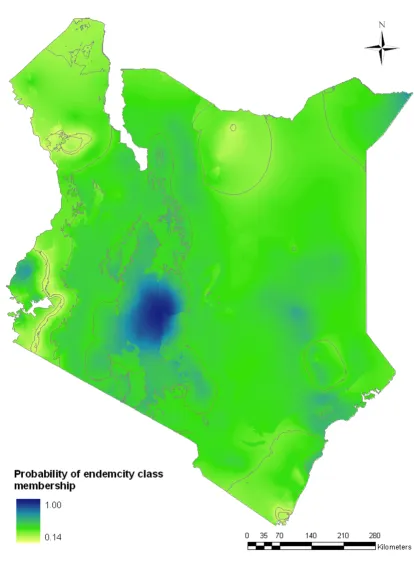
The mean error in the prediction of PfPR2-10 for 2009 revealed low overall bias with a slight tendency to under-estimate predictions by -0.15% (Table 3). The mean abso-lute error also showed a relatively moderate model preci-sion with low average error of predictions of 0.38%. The correlation between the actual and predicted values for the hold-out set was 0.81 indicating a strong linear agree-ment (Figure 4). In assessing the endemicity classes, the overall probabilities of membership of the predicted class were all greater than the chance assignment value of 0.14 and in most of the country was greater than 0.45 (Figure 5).
Population at risk in 2009
Of the estimated 40.8 million people in Kenya in 2009, the majority (65.6%) lived in areas where malaria risk was <1% PfPR2-10 with 14.8 million (36.2%) living in areas of < 0.1% PfPR2-10 (Table 4). Approximately 8.5 million
(20.8%) people lived in areas where transmission risks were predicted to be between 1% and 5% PfPR2-10 in 2009; while the remaining population (5.6 million, 13.7%) lived in areas of risk ≥5% PfPR2-10, of which 4.3 million (10.6% of Kenya's 2009 population) were pre-dicted to be living in the highest transmission areas of ≥40% PfPR2-10 (Table 4).
Discussion
We have assembled over 2,600 independent, empirical survey estimates of P. falciparum infection prevalence in Kenya and used these data to generate a contemporary map of infection prevalence at a 1 × 1 km resolution for the year 2009 using space-time geostatistical models within a Bayesian framework. The modeled distribution had a high predictive accuracy as shown by the low values of ME and MAE and high correlation between predicted and observed PfPR2-10 (Table 3 & Figure 4). The probabil-ity of endemicprobabil-ity class membership were also generally moderate to high across the country with the exception of small pockets of the low population-density areas of the northern districts where there was relatively sparse distri-bution of input data in time and space (Figure 5). This mapped distribution of malaria risk represents the most accurate depiction of parasite exposure described for Kenya since efforts to map risk began in the 1950's [2,3,5,6]. More importantly it represents a distribution of risk in 2009 serving as a contemporary basis upon which to design the future of malaria control in Kenya.
The use of a carefully selected suite of covariates to inform the prediction of risk is a departure from the current Malaria Atlas Project approach, with the exception of the use of urban-rural classification [2], but consistent with other approaches to modeling malaria distributions [5,6,15-17,35]. In fact several discrete categories of the covariates were as different in infection prevalence as the differences described for urban versus rural surveys. We elected not to include a mask of zero or unstable transmis-sion based upon temperature and aridity as developed previously by Guerra et al, [40]. Rather we have assumed that these climatic drivers of transmission would be cap-tured within the model and have chosen to bin the risk classes within much smaller PfPR2-10 ranges at the lowest
end of the transmission spectrum. The lowest risk class encompasses predicted PfPR2-10 between 0 and < 0.1% and covers approximately 91,000 km2 within the Nairobi
and Central provinces and small parts of Eastern and Rift Valley (Figure 3). Defining absolute zero transmission is conceptually difficult and practically impossible to meas-ure empirically using PfPR2-10 and we therefore feel that the more conservative and inclusive approach used here allows for the possibility of transmission until proven otherwise.
Sample semi-variograms of PfPR2-10 dataset (n = 2,682) indi-cating the presence of spatial autocorrelation in the PfPR2-10 data up to lags of 1 decimal degree or the equivalent of ~111 km at the equator
Figure 2
Table 2: Results of univariate and multivariate analysis of the ecological and climatic covariates (SI 1) against Kenya PfPR2-10 data of sample size ≥50 individuals.
PfPR2-10
Number of survey locations
Mean (median) PfPR2-10, Chi2 (P-value)
Univariate regression*: Odds Ratio (95% CI),
P-value
Multivariate regression*: Odds Ratio
(95% CI), P-value
Categorical covariates
Urban
Rural 1636 27.6 (21.9) Ref Ref
Urban 458 15.4 (11.9) 0.48 (0.34, 0.66), <0.001 0.50 (0.36, 0.70), <0.001
3300, <0.001
Maximum temperature (Degrees Celsius)
≤25 214 7.7 (2.3) 0.20 (0.10, 0.41), <0.001 0.25 (0.12, 0.52), <0.001
25-30 1628 29.8 (25.9) Ref Ref
>30 252 16.2 (9.2) 0.46 (0.35, 0.60), <0.001 0.61 (0.44, 0.85), 0.003
4700.0, <0.001
Minimum temperature (Degrees Celsius)
<16 928 23.5 (17.1) 0.81 (0.66, 0.97), <0.036
≥16 1166 27.6 (21.9) Ref
754.7, <0.001
Sets of 3 consecutive months in an average year with precipitation >60 mm
0 1398 13.7 (9.0) 0.37 (0.26, 0.51), <0.001 0.53 (0.35, 0.83), 0.005
1-3 333 19.6 (12.4) 0.56 (0.42, 0.74), <0.001 0.63 (0.46, 0.85), 0.003
>3 363 30.3 (26.1) Ref Ref
8200.0, <0.001
Enhanced vegetation index
> 0.3 1534 16.9 (11.3) Ref Ref
≤0.3 560 29.0 (24.4) 0.50 (0.39, 0.64), <0.001 0.78 (0.57, 1.06), 0.114
3300.1, <0.001
Altitude (m)
0-500 689 22.2 (13.0) 0.59 (0.47, 0.74), <0.001
>500-1500 860 32.6 (29.1) Ref
>1500 545 19.4 (13.0) 0.50 (0.39, 0.64), <0.001
4100.2, <0.001
Distance (km) to main water bodies
≤12 mean distance 1306 28.6 (23.5) Ref
>12 mean distance 788 21.1 (14.5) 0.67 (0.54, 0.82), <0.001 0.62(0.49, 0.77), <0.001
3300, <0.001
What is striking about the contemporary 2009 distribu-tion of malaria infecdistribu-tion risk is the enormity of Kenya's land surface under very low intensity transmission. Over 94% of Kenya's surface area is predicted to be exposed to a PfPR2-10 of less than 5% and is home to 86% of Kenya's
projected population in 2009 (Table 3). Approximately 66% of the 2009 population live in areas where infection prevalence is less than 1%, including a large majority
where risks are hard to detect empirically (PfPR2-10 < 0.1%) (Table 3). Conversely areas of high transmission, as defined by a PfPR2-10 of ≥40%, representing areas expected to be intractable to immediate reductions in parasite prev-alence with scaled-up use of insecticide treated nets [47] are located in the strip of land along the shores of Lake Victoria (Figure 3). In 2009 only 11% of Kenya's popula-tion was exposed to this highest transmission intensity class (Table 3). Historically holo-to-hyperendemic trans-mission (≥50% PfPR2-10) was thought to exist across much
larger reaches of the Kenyan coast, around Lake Victoria and along the Tana River [3,51]. In the present modeled iteration of PfPR2-10 holo-endemic transmission (>75%
[image:9.612.60.530.85.411.2]PfPR2-10) no longer exists and hyper-endemic transmis-sion is constrained to small pockets within the darkest red class shown in Figure 3. Although this study doesn't present change of infection risk over time, it seems plausi-ble that across much of Kenya the extent and intensity of P. falciparum transmission has undergone a recent decline with increasing spatial areas and populations becoming exposed to lower and lower risks of parasite exposure. This Spatial distribution of P. falciparum malaria in Kenya at 1×1 km spatial resolution
Figure 3
Spatial distribution of P. falciparum malaria in Kenya at 1×1 km spatial resolution. a) continuous posterior mean
PfPR2-10 prediction; b) endemicity classes: PfPR2-10 < 0.1%; ≥0.1 and < 1%; ≥1 and <5%; ≥5 and <10%; ≥10 and <20%; ≥20 and <40%; ≥40%.
Table 3: Summary of validation statistics for predicting
continuous PfPR2-10 in Kenya based on a validation set of 210 data points.
Validation measure
Linear correlation coefficient of predicted versus observed 0.81
Mean error (% PfPR2-10) -0.15
Mean absolute error (% PfPR2-10) 0.38
has implications for a changing clinical epidemiology in areas undergoing transition, with older children becom-ing increasbecom-ingly at risk of severe clinical outcomes [52-55] but more importantly as communities transition to very low levels of parasite exposure overall malaria morbidity and mortality will decline substantially [52,56].
Although the model is characterized by generally low uncertainties, the pockets of greatest predicted uncertainty are located in the northern districts of Turkana, Marsabit and Moyale (Figure 5). Surprisingly, pockets of risk >10% PfPR2-10 were observed in these hot and generally arid parts of the country traditionally regarded to be of unsta-ble low risk. These areas, which generally have low popu-lation densities and have traditionally not been targeted for scaling of malaria preventive interventions, exhibit highly focal transmission close to water features, such as the Turkwell, Tana and Kerio rivers and were referred to in historical maps as 'malarious near water' [3]. Because of their presumed low risk, few empirical studies of malaria have been undertaken in these areas. The malaria situa-tion among these poor, pastoralist communities remains ill-defined. In addition there are some important method-ological constraints to defining risk in areas of very low
transmission and new approaches to micro-geographic Bayesian modeling of risk based upon a presence/absence criterion may be required to improve risk mapping in these areas where the majority risk is negligible, seasonal and exceptionally heterogeneous, associated with the presence of water features.
Further improvements in malaria risk mapping using PfPR2-10 might be achieved if the prediction models were corrected for whether microscopy or RDT was used to examine parasitaemia given the varying sensitivities and specificities of the two methods [57]. In this study, how-ever, this was not possible because information on the type of RDT used and the quality of microscopy was lack-ing for most surveys. In future, it may be feasible to develop universal models that correct for sensitivity/spe-cificity differentials of the methods used to test for infec-tion, preferably based on large-scale population surveys which have used both RDT and microscopy for the same individuals with the appropriate quality assurance and external validity.
The prospects for Kenya to transition the majority of its population living in high transmission areas in the next Scatter plot of actual versus predicted point-values of PfPR2-10 for the selection validation set (n = 210)
Figure 4
Spatial distribution of probability of membership of P. falciparum malaria endemicity class in Kenya at 1 × 1 km spatial resolution Figure 5
10 years to areas of low (PfPR2-10 <5%) or very low ende-micity (PfPR2-10 <1%) look promising. It is however important to emphasize the control implications of this low stable endemic control. There appear to be areas along the Kenyan coast that currently experience risks associated with a PfPR2-10 <5% and are likely to have
tran-sitioned to this state from meso-hyperendemic condi-tions. If this has been achieved through the scaled-up use of insecticide treated nets (ITN) then universal coverage must be maintained as withdrawal of ITN would result in a devastating rebound where vectors persist but functional immunity has been modified among the human host population. Conversely in areas that have historically had low or very low transmission, for example in semi-arid areas, the adoption of ITN may not be the most cost-effec-tive strategy. As such all areas of similar contemporary risk may not be equivalent in terms of strategic control. One therefore must interpret contemporary distributions of risk for control planning in concert with the potential vul-nerabilities of transmission based upon vector distribu-tions or historical descripdistribu-tions of risk. For Kenya it is also important to recognize that there are vast areas where infection risks are low and have historically been low because of their ecological niches (arid, urban or at high elevation). While these communities enjoy a low risk of infection, risks are not absent and thus cost-efficient suites of interventions must be tailored to meet their needs. This poses a challenge where universal coverage of ITN and presumptive fever treatment with Artemisinin based com-bination therapy remain the single bedrock of most national malaria control strategies across Africa.
Conclusion
There remains some debate over the feasibility of malaria elimination in Africa [58-61]. Kenya is an example where infection prevalence is low across large parts of the coun-try. However moderate-to-high risks remain in well defined areas, some of which share borders with
neigh-boring countries and risks are not absent from marginal-ized hard-to-reach communities in semi-arid areas of the country. Successes in reducing infection prevalence in some areas [[55], Okiro EA, Alegana VA, Noor AM, Mutheu JJ, Juma E, Snow RW: Malaria paediatric hospital-ization between 1999 and 2008 across Kenya. Submitted] that have led to reductions in disease burden [[54,55], Okiro EA, Alegana VA, Noor AM, Mutheu JJ, Juma E, Snow RW: Malaria paediatric hospitalization between 1999 and 2008 across Kenya. Submitted] must be maintained and expanded and not viewed as 'job finished'. This alone may pose challenges for sustained financing. What is encourag-ing is that risks can be measured usencourag-ing survey data of infection prevalence; we have shown here that their spa-tial distribution can be modeled and mapped with accu-racy; and that this can become the basis for judging the future success of control nationwide using data that does not depend upon opportunistic historical surveys. To this end the Kenyan Ministry of Health proposes to maintain annual surveys of malaria infection prevalence among school children as part of its monitoring of the revised national malaria strategy 2009-2017 (E Juma, personal communication). This will represent the first attempt in Africa to serially measure, map and model changing ende-micity as part of scaled intervention coverage and where robust baseline endemicity for 2009 exists to judge suc-cess.
Abbreviations
[image:12.612.55.559.100.246.2]EA: Enumeration area; EVI: Enhanced Vegetation Index; GPS: Global Positioning System; ILRI: International Live-stock Research Institute; KNBS: Kenya National Bureau of Statistics; MAE: Mean Absolute Error; MCMC: Markov Chain Monte Carlo; ME: Mean Error; NASA: National Aer-onautics and Space Administration; NDVI: Normalized Difference Vegetation Index; NGA: National Geospatial-Intelligence Agency; PfPR: P. falciparum parasite rate; SRTM: Shuttle Radar Topography Mission.
Table 4: Total population (in millions) at different risks of P. falciparum transmission in 2009 in Kenya
PfPR2-10 < 0.1% ≥ 0.1 - <1.0% ≥ 1.0 - <5.0% ≥ 5.0-10.0% ≥ 10.0 - <20.0% ≥ 20.0 - <40.0% ≥ 40.0
Central 4.30 0.04 0.00 0.00 0.00 0.00 0.00
Coast 0.01 0.96 2.32 0.00 0.07 0.05 0.00
Eastern 1.81 3.73 0.09 0.00 0.00 0.00 0.00
Nairobi 5.51 0.00 0.00 0.00 0.00 0.00 0.00
North Eastern 0.45 1.62 0.07 0.00 0.00 0.00 0.00
Nyanza 0.00 0.43 2.17 0.00 0.01 0.61 2.22
Rift Valley 2.68 5.19 2.13 0.00 0.02 0.01 0.01
Western 0.00 0.00 1.70 0.00 0.03 0.43 2.10
Total (%)
14.77 (36.2)
11.98 (29.4)
8.48 (20.8)
0.00 (0.0)
0.13 (0.003)
1.10 (0.03)
4.33 (10.6)
Competing interests
The authors declare that they have no competing interests.
Authors' contributions
AMN was responsible for study design, data cleaning, analysis, interpretation and production of the final man-uscript. PWG contributed to the development of geostatis-tical models, analysis, interpretation and contributed to the final manuscript. VAA was responsible for geo-loca-tion of the survey data, data cleaning and preliminary analysis. APP contributed to the development of geostatis-tical models, analysis, interpretation and contributed to the final manuscript. SIH provided advice on analysis, interpretation of results and helped with the preparation of final manuscript. EM contributed to supervision of data collection and production of final manuscript. EJ contrib-uted to supervision of data collection, provision of gen-eral policy framework, and production of final manuscript. RWS was responsible for overall scientific management, analysis, interpretation and preparation of the final manuscript. All authors have read and approved the final manuscript.
Additional material
Acknowledgements
We are grateful to the many individuals and organizations who provided us with the parasite prevalence survey data and all are recognized at http:// www.map.ox.ac.uk/acknowledgements/#K. We particularly thank the Divi-sion of Malaria Control and the DiviDivi-sion of Vector Borne and Neglected Tropical Diseases of Ministry of Public Health and Sanitation, Kenya, for their support in funding recent school-based parasitological surveys. We acknowledge Dr Carlos Guerra for his help with data assembly and Dr Dave Smith for providing algorithms for age-standardization. We also thank Drs Andy Tatem and Archie Clements for their advice at preliminary anal-ysis stages. Kevin Marsh, Emelda Okiro, Archie Clements and Rosalind Howes are thanked for their comments on earlier versions of the manu-script. This paper is published with the permission of the director KEMRI.
FUNDING SOURCE
AMN is supported by the Wellcome Trust as a Research Training Fellow (#081829). SIH is supported by the Wellcome Trust as Senior Research Fellow (#079091) that also supports PWG. RWS is supported by the Well-come Trust as Principal Research Fellow (#079080) that also supports APP. The study also received partial financial support from The World Health Organization, Kenya, (# AF/KEN/BBB/200/XU/08). This work forms part of the output of the Malaria Atlas Project (MAP, http://www.map.ox.ac.uk), principally funded by the Wellcome Trust, UK. AMN, SIH and RWS also acknowledge support from the Kenya Medical Research Institute. The funders had no role in study design, data collection and analysis, decision to publish, or preparation of the manuscript.
References
1. RBM: The global malaria action plan. Roll Back Malaria partner-ship. Geneva: World Health Organization; 2008.
2. Hay SI, Guerra CA, Gething PW, Patil AP, Tatem AJ, et al.: A world malaria map: Plasmodium falciparum endemicity in 2007. PLoS Med 2009, 6:e1000048.
3. Butler RJ: Atlas of Kenya: A comprehensive series of new and authenticated maps prepared from the national survey and other government sources with gazetteer and notes on pro-nunciation and spelling. Nairobi, Kenya, the Survey of Kenya 1959. 4. Craig MH, Snow RW, le Sueur D: A climate-based distribution
model of malaria transmission in sub-Saharan Africa. Parasitol Today 1999, 15:105-111.
5. Omumbo J, Hay S, Goetz S, Snow R, Rogers D: Updating historical maps of malaria transmission intensity in East Africa using remote sensing. Photogramm Eng and Remote Sens 2002,
68:161-166.
6. Snow RW, Gouws E, Omumbo J, Rapuoda B, Craig MH, Tanser FC, le Sueur D, Ouma : Models to predict the intensity of Plasmo-dium falciparum transmission: applications to the burden of disease in Kenya. T Roy Soc Trop Med H 1998, 92:601-606. 7. Omumbo JA, Hay SI, Snow RW, Tatem AJ, Rogers DJ: Modelling
malaria risk in East Africa at high-spatial resolution. Trop Med Int Health 2005, 10:557-566.
8. Snow RW, Gilles HM: The epidemiology of malaria. In Bruce-Chwatt's essential malariology 4th edition. Edited by: Warrel DA, Gilles HM. London: Arnold; 2002.
9. Hay SI, Smith DL, Snow RW: Measuring malaria endemicity from intense to interrupted transmission. Lancet Infect Dis
2008, 8:369-378.
10. Hay SI, Snow RW: The Malaria Atlas Project: developing global maps of malaria risk. PLoS Med 2006, 3:e473.
11. Metselaar D, van Thiel PH: Classification of malaria. Trop Geogr Med 1959, 11:157-161.
12. Smith DL, McKenzie FE, Snow RW, Hay SI: Revisiting the basic reproductive number for malaria and its implications for malaria control. PLoS Biol 2007, 5:e42.
13. Smith DL, Dushoff J, Snow RW, Hay SI: The entomological inoc-ulation rate and Plasmodium falciparum infection in African children. Nature 2005, 438:492-495.
14. Smith DL, Guerra CA, Snow RW, Hay SI: Standardizing estimates of the Plasmodium falciparum parasite rate. Malaria J 2007,
6:131.
15. Kleinschmidt I, Bagayoko M, Clarke GPY, Craig MH, Le Sueur D: A spatial statistical approach to malaria mapping. Int J Epidemiol
2000, 29:355-361.
16. Kleinschmidt I, Omumbo JA, Briët O, Giesen N van de, Sogoba N, Mensah N, Windmeijer P, Moussa M, Teuscher T: An empirical malaria distribution map for West Africa. Trop Med Int Health
2001, 6:779-786.
17. Gemperli A, Vounatsou P, Sogoba N, Smith T: Malaria mapping using transmission models: application to survey data from Mali. Am J Epidemiol 2006, 163:289-297.
18. Guerra CA, Hay SI, Lucioparedes LS, Gikandi PW, Tatem AJ, et al.:
Assembling a global database of malaria parasite prevalence for the Malaria Atlas Project. Malaria J 2007, 6:17.
19. Omumbo JA, Snow RW: Plasmodium falciparum parasite preva-lence in East Africa: a review. East Afr Med J 2004, 81:649-656. 20. PUBMED: [http://www.ncbi.nlm.nih.gov/pubmed/]. Accessed 7th June
2009
Additional file 1
The relationship of ecological and climatic covariates with PfPR2-10. Detailed description of the ecological and climatic covariates and their relationship with PfPR2-10.
Click here for file
[http://www.biomedcentral.com/content/supplementary/1471-2334-9-180-S1.DOC]
Additional file 2
Bayesian model-based geostatistical modelling procedures. Technical details of the Bayesian geostatistical models including prior specifications, implementation and output.
Click here for file
21. Africa E-repositories: [http://www.connecting-africa.net]. Accessed 7th May 2009
22. Ministry of Health Kenya: Kenya National Malaria Indicator Sur-vey 2007. Nairobi, Kenya: Ministry of Health; 2008.
23. UNICEF: Vitamin E deficiency in Kenya: a report of a national micronutrient survey. United Nations Children's Fund, Nairobi, Kenya; 1994.
24. Mwaniki DL, Omwega AM, Muniu EM, Mutunga JN, Akelola R, Shako BR, Gotink MH, Pertet AM: The 1999 National Survey Report on Anaemia and the status of Iron, Vitamin A and Zinc in Kenya. Ministry of Health, Nairobi, Kenya; 1999.
25. Malaria Atlas Project: [http://www.map.ox.ac.uk/acknowledgements/ ]. Accessed 7th June 2009
26. Ministry of Education: Inception Report: Consultancy on devel-opment of a GIS database of learning Institutions (School mapping exercise), 2008. Oakar Services Ltd.
27. Ministry of Roads and Public Works: Classified Digital Road Net-work in Kenya. Roads Department, Nairobi 2004.
28. Alexandria Digital Library: [http://www.alexandria.ucsb.edu]. Accessed 15th June 2009
29. Global Gazetteer Version 2.1: [http://www.fallingrain.com/world/]. Accessed 17th June 2009
30. Pull JH, Grab B: Simple epidemiological model for evaluating malaria inoculation rate and risk of infection in infants. Bull World Health Organ 1974, 51:507-516.
31. Molineaux L: The epidemiology of human malaria as an expla-nation of its distribution, including some implications for its control. Malaria: Principles and Practice of Malariology. Vol-ume 2. Edited by: Wernsdorfer W, McGregor I. London, Churchill Livingstone; 1988:913-998.
32. Omumbo JA, Guerra CA, Hay SI, Snow RW: The influence of urbanisation on measures of Plasmodium falciparum infection prevalence in East Africa. Acta Trop 2005, 93:11-21.
33. Hay SI, Guerra CA, Tatem AJ, Atkinson PM, Snow RW: Urbaniza-tion, malaria transmission and disease burden in Africa. Nat Rev Microbiol 2005, 3:81-90.
34. Craig MH, Kleinschmidt I, Nwan JB, Le Seur D, Sharo BL: Exploring 30 years of malaria case data in KwaZulu-Natal, South Africa: Part I. The impact of climatic factors. Trop Med Int Health 2004, 9:1247-1257.
35. Craig MH, Sharp BL, Mabaso ML, Kleinschmidt I: Developing a spa-tial-statistical model and map of historical malaria preva-lence in Botswana using a staged variable selection procedure. Int J Health Geogr 2007, 6:44.
36. Kazembe LN, Kleinschmidt I, Holtz TH, Sharp BL: Spatial analysis and mapping of malaria risk in Malawi using point-refer-enced prevalence of infection data. Int J Health Geogr 2006, 5:41. 37. Cox J, Craig MH, Le Sueur D, Sharp B: MARA/HIMAL technical report Mapping malaria risk in the highlands of Africa. Lon-don School of Hygiene and Tropical medicine, UK and Medical Research Council, Durban South Africa; 1999.
38. Thomson MC, Connor SJ, D'Alessandro U, Rowlingson B, Diggle P, Cresswell M, Greenwood B: Predicting malaria infection in Gambian children from satellite data and bed net use sur-veys: the importance of spatial correlation in the interpreta-tion of results. Am J Trop Med Hyg 1999, 61:2-8.
39. Hay SI, Snow RW, Rogers DJ: From predicting mosquito habitat to malaria seasons using remotely sensed data: practice, problems and perspectives. Parasitol Today 1998, 14:306-313. 40. Guerra CA, Gikandi PW, Tatem AJ, Noor AM, Smith DL, et al.: The
limits and intensity of Plasmodium falciparum transmission: implications for malaria control and elimination worldwide. PLoS Med 2008, 5:e38.
41. Kleinschmidt I, Sharp BL, Clarke GPY, Curtis B, Fraser C: Use of Generalized Linear Mixed Models in the Spatial Analysis of Small-Area Malaria Incidence Rates in KwaZulu Natal, South Africa. Int J Epidemiol 2001, 153:1213-1221.
42. Hoek W Van Der, Konradsen F, Amerasinghe PH, Perera D, Piya-ratne M, Amerasinghe FP: Towards a risk map of malaria for Sri Lanka: the importance of house location relative to vector breeding sites. Int J Epidemiol 2003, 32:280-285.
43. Clements A, Lwambo N, Blair L, Nyandindi U, Kaatano G, Kinung'hi S, Webster J, Fenwick A, Brooker S: Bayesian spatial analysis and disease mapping: tools to enhance planning and implemen-tation of a schistosomiasis control programme in Tanzania. Trop Med Int Health 2006, 11:490-503.
44. Diggle P, Moyeed R, Rowlingson B, Thompson M: Childhood malaria in the Gambia: a case-study in model-based geosta-tistics. Appl Stat 2002, 51:493-506.
45. Isaacs E, Srivastava R: Applied geostatistics. Oxford University Press; 1989.
46. Smith DL, Hay SI: Endemicity response timelines for Plasmo-dium falciparum elimination. Malaria J 2009, 8:87.
47. Smith DL, Noor AM, Hay SI, Snow RW: Predicting changing malaria risk following expanded insecticide treated net cov-erage in Africa. Trends Parasitol25(11):511-6.
48. Tatem AJ, Noor AM, von Hagen C, di Gregorio A, Hay SI: High res-olution population maps for low income nations: combining land cover and census in East Africa. PLoS One 2007, 2:e1298. 49. Tatem AJ, Noor AM, Hay SI: Defining approaches to settlement
mapping for public health management in Kenya using medium spatial resolution satellite imagery. Remote Sens Envi-ron 2004, 93:42-52.
50. Central Bureau of Statistics: 1999 Population and housing Cen-sus, Vol. 1: population distribution by administrative areas and urban Centers. Nairobi Kenya 2001.
51. Lysenko AJ, Semashko : IN Geography of malaria. A medicoge-ographic profile of an ancient disease [in Russian]. Edited by: Lebedew AW. Itogi Nauki: Medicinskaja Geografija. Moscow: Acad-emy of Sciences, USSR; 1968:25-146.
52. Snow RW, Omumbo JA, Lowe B, Molyneux CS, Obiero J, Palmer A, Weber M, Pinder M, Nahlen B, Obonyo C, Newbold C, Gupta S, Marsh K: Relation between severe malaria morbidity in chil-dren and level of Plasmodium falciparum transmission in Africa. Lancet 1997, 349:1650-1654.
53. Okiro EA, Al-Taiar A, Reyburn H, Idro R, Berkley J, Nokes DJ, Snow RW: Age patterns of severe paediatric malaria and their rela-tionship to Plasmodium falciparum transmission intensity. Malaria J 2009, 8:e4.
54. Okiro EA, Hay SI, Gikandi PW, Sharif SK, Noor AM, Peshu N, Marsh K, Snow RW: The decline in paediatric malaria admissions on the coast of Kenya. Malaria J 2008, 6:151.
55. O'Meara WP, Bejon P, Mwangi TW, Okiro EA, Snow RW, Newton CJRC, Marsh K: Dramatic reductions in malaria morbidity and mortality are heralded by changes in age and presentation of disease. Lancet 2008, 372:1555-1562.
56. Snow RW, Marsh K: The consequences of reducing transmis-sion of Plasmodium falciparum in Africa. Adv Parasitol 2002,
52:235-264.
57. World Health Organization: Malaria Rapid Test Diagnostic Per-formance. Results of WHO product testing of malaria RDTs: Round 1 WHO, Geneva; 2008.
58. Roberts L, Enserink M: Did they really say.eradication? Science
2007, 318:1544-45.
59. Feachem R, Sabot O: A new global malaria eradication strat-egy. Lancet 2008, 371:1633-1635.
60. Greenwood B, Fidock D, Kyle D, Kappe S, Alonso P, Collins F, Duffy P: Malaria: progress, perils, and prospects for eradication. J Clin Invest 2008, 118:1266-1276.
61. Lines J, Schapira A, Smith T: Tackling malaria today. BMJ 2008,
337:869.
Pre-publication history
The pre-publication history for this paper can be accessed here: