R E S E A R C H A R T I C L E
Open Access
Analysis of CDC social control measures using an
agent-based simulation of an influenza epidemic
in a city
Yong Yang
1*, Peter M Atkinson
2and Dick Ettema
3Abstract
Background:The transmission of infectious disease amongst the human population is a complex process which requires advanced, often individual-based, models to capture the space-time details observed in reality.
Methods:An Individual Space-Time Activity-based Model (ISTAM) was applied to simulate the effectiveness of non-pharmaceutical control measures including: (1) refraining from social activities, (2) school closure and (3) household quarantine, for a hypothetical influenza outbreak in an urban area.
Results:Amongst the set of control measures tested, refraining from social activities with various compliance levels was relatively ineffective. Household quarantine was very effective, especially for the peak number of cases and total number of cases, with large differences between compliance levels. Household quarantine resulted in a decrease in the peak number of cases from more than 300 to around 158 for a 100% compliance level, a decrease of about 48.7%. The delay in the outbreak peak was about 3 to 17 days. The total number of cases decreased to a range of 3635-5403, that is, 63.7%-94.7% of the baseline value.
When coupling control measures, household quarantine together with school closure was the most effective strategy. The resulting space-time distribution of infection in different classes of activity bundles (AB) suggests that the epidemic outbreak is strengthened amongst children and then spread to adults. By sensitivity analysis, this study demonstrated that earlier implementation of control measures leads to greater efficacy. Also, for infectious diseases with larger basic reproduction number, the effectiveness of non-pharmaceutical measures was shown to be limited.
Conclusions:Simulated results showed that household quarantine was the most effective control measure, while school closure and household quarantine implemented together achieved the greatest benefit. Agent-based models should be applied in the future to evaluate the efficacy of control measures for a range of disease outbreaks in a range of settings given sufficient information about the given case and knowledge about the transmission processes at a fine scale.
Background
Since the beginning of the new millennium, epidemics of severe acute respiratory syndrome (SARS), avian influenza (bird flu) and H1N1 influenza (swine flu) have emerged repeatedly amongst the human population raising public concerns, particularly over future risk of disease, and underlying the need for increased under-standing of transmission processes and the efficacy of
alternative methods of control [1-9]. The transmission of an infectious disease amongst the human population is a complex process involving the time lines of infec-tious diseases, infection probability, contacts between individuals, demographic dynamics that determine the contact pattern and the occasional imported infection. At both the micro (for a single infection) and macro levels (the infection network) there exist a plethora of factors, objects and processes that combine to create complex scenarios, and this complexity varies from set-ting to setset-ting.
* Correspondence: [email protected] 1
Department of Epidemiology, University of Michigan, Ann Arbor, 48109, USA
Full list of author information is available at the end of the article
Although several studies [10-12] have investigated the infection process directly by infecting healthy volunteers with the influenza virus in an experimental setting, for ethical reasons and because of the complexity involved, scientific experiments generally do not provide a feasible solution for the study of infectious disease transmission and the testing of control measures in a real world set-ting. This is especially true across whole communities or cities. It is, therefore, difficult to gain enough insight into the interplay of the various factors to predict the development of epidemics and formulate appropriate mitigation strategies. In these circumstances, modelling and simulation are potentially the most powerful tools available to increase understanding of infectious disease transmission processes and disease outbreaks. Impor-tantly, modelling and simulation provide an important foundation for testing possible control measures [13].
It is difficult to build a satisfactory model of the transmission of infectious diseases due to deficiencies in both theory and data [14]. On the one hand, human knowledge of the infectious disease transmission pro-cess is limited at both the micro and macro levels. At the micro level, the exact process of a single infection for most types of infectious disease is unclear, even today [15]. At the macro level, disease diffusion amongst the human population is a complex process, as many factors, both social and physical, can contri-bute with different magnitudes to disease outcomes. On the other hand, it is difficult to obtain all the data required for model building, validation and simulation, especially for bottom-up approaches that require knowledge at the micro level.
In this paper, we argue that agent-based models (ABM) provide a powerful means to increase our under-standing of infectious disease transmission. ABMs are computational models for simulating the actions and interactions of autonomous individuals within a hetero-geneous population. ABMs are bottom-up models. That is, the macro-level behaviour of the whole system is generated by the simulation of the behaviour of agents at the micro-level. ABMs, formulated in different disci-plines such as computer science [16], geography [17-20], epidemiology [21-25], and other interdisciplinary fields [26-28], can be applied to simulate the outbreak of infectious diseases and bio-terror attacks, and to explore the efficacy of control measures. The most important advantages of ABMs are that they can consider the het-erogeneity of both individuals and environment, and also the stochastic essence of infectious disease trans-mission. ABMs can express explicitly the differences between individuals in terms of the attributes that influ-ence the process of disease transmission such as physi-cal, social, economic and environmental characteristics. For example, age, gender, occupation and lifestyle
variables all contribute to the subsequent disease experi-ence of an individual and the probability of infecting other individuals [29]. The interaction between indivi-duals, which is one of the key components determining infectious disease transmission, can be expressed expli-citly in the model. Using ABMs, the heterogeneity of the time lines of infectious diseases, infection probabil-ity, demographic dynamics that determine the contact pattern, and the occasional imported infection, can all be considered.
Influenza, an illness caused by ribonucleic acid (RNA) viruses that infect the respiratory tract, is transmitted mainly through the air by coughs or sneezes. Due to the high mutation rate of the virus, protection from any vaccine normally lasts only one year. In February 2007, the Centers for Disease Control and Prevention (CDC) in the United States issued the Community Strategy for Pandemic Influenza Mitigation [30] which is based upon an early, targeted, layered application of multiple par-tially effective non-pharmaceutical measures. Coupled with specific uses of antiviral influenza medications, these strategies aim to reduce transmission of pandemic influenza and mitigate the disease. Briefly, the main four interventions are: (1) isolation of influenza cases; (2) voluntary home quarantine of members of households with influenza; (3) school closure, which includes the dismissal of students from school (also including col-leges, universities and childcare facilities) and school-based activities; (4) social distancing measures to reduce contact in the community and workplace. It also recom-mended that the intervention duration should be up to 12 weeks.
According to the Community Strategy for Pandemic Influenza Mitigation [30], the three major goals of miti-gating a community-wide epidemic are: (1) delay the exponential growth in incident cases; (2) reduce the epi-demic peak, and (3) reduce the total number of incident cases.
In this study, three properties of an epidemic outbreak were used to evaluate the effectiveness of a set of con-trol measures. These were: (1) the total number of cases, (2) the number of cases at the peak and (3) the day number when the outbreak peaks.
This paper presents an analysis in which control mea-sures are tested for a hypothetical influenza outbreak in Eemnes, a small city in the Netherlands, generated from
the simulation of individuals’ movements around the
city and consequent interactions using a published ABM: Individual Space-Time Activity-based Model (ISTAM) [39,40]. ISTAM was applied to simulate an influenza outbreak for the same city in an earlier study, and the analysis included the spatial distribution of infection within the city, infection distribution at differ-ent types of locations and network analysis. This paper focuses on testing the CDC’s suggested control measure strategies. This research provides new information which may be beneficial to the design of a control strat-egy for epidemic outbreaks, especially for some contro-versial intervention options such as school closure. Since the novel ABM framework, upon which the paper builds, was published previously by the authors, the basic structure and parameters of the model can be obtained from [32] and only a brief summary is given here. For the sake of brevity and clarity, the focus is on the efficacy of three of the CDC control measures.
The paper is organised as follows. The next section outlines the research methods. Then the simulation results and analysis are presented, followed by a section that discusses the merits and limitations of our approach. The last section draws conclusions regarding the application of ISTAM and remaining research issues.
Methods
ISTAM is a bottom-up ABM in which the transmission network is built on the simulated physical contacts between individuals at a fine space-time scale [39,40]. At this scale, human social behaviour, the environment’s physical conditions and the transmission mode of the specific infectious disease are considered. Activity bun-dle (AB) is a key concept in ISTAM. An AB is a seman-tic space where contact probability varies as a function of the dynamics of humans inside the bundle. The simu-lation is at two levels: people’s movements between ABs and contact between individuals within ABs.
It is accepted that the possibility of infection for sus-ceptible individuals increases with proximity to
infectious individuals [41-43]. In addition, there exist social rules for how close humans can approach each other. Hall [44] identified four distances: intimate tance, personal distance, social distance and public dis-tance. The values of the above distances vary between populations from different cultures, ages, genders etc. This knowledge provides a basis for within-AB simula-tion. For example, the model should focus on the chan-ging distances between individuals and, specifically, when the distances are small enough for infection. The contacts between individuals are driven by social pur-poses or constrained by physical conditions or both, while infectionper se is a physical process. Some con-tacts are indispensable for undertaking some activities. For example, an individual who goes shopping will gen-erally make contact with the salesperson when checking out. Some contacts, although not purposeful, occur due to the restriction of the environment. For example, on a crowded bus, passengers must sit or stand in proximity. The first type of contact is voluntary and is determined by the individuals. The second type of contact is invo-luntary and is not wholly determined by the individuals.
The spatial distribution pattern of individuals can be observed in most types of AB. One example is provided by a restaurant: people sit in clusters which reflect the existence of different groups. Another example is pro-vided by individuals visiting a library: people may try to find an empty table and sit as far as possible from each other [45]. In some ABs, such as in a lecture room, indi-viduals are assumed to remain static during the simula-tion time unit. In other ABs, movements must be considered. At fine spatial scales, individuals’movement patterns may be strongly confined by the physical condi-tion of the current AB and the status of other indivi-duals. Three properties of humans’space-time dynamics within ABs that have been observed in reality are con-sidered when modelling individuals within ISTAM: (1) individuals’static spatial distribution patterns, (2)
indivi-duals’movement patterns and (3) minimum distances
between individuals. For more details about within-AB simulation using ISTAM, see [39].
every household and properties such as age and gender, and activity patterns, were assigned to every individual. Among the whole population of 8382 people, 3.2% were 4 years old or younger, 3.5% were between 5 and 9, 6.4% were between 10 and 17, 71.3% were between 17 and 64, and 15.6% were 65 years or older.
During the simulation, individuals’ daily activities were generated from a distribution of observed activity
patterns and then individuals’ movements between ABs
and the interaction of individuals within ABs were simulated. During these interactions, infection was possible conditional upon contact between individuals. For the latter case, parameters such as the contact fre-quency and contact intimacy which determine how often individuals come into contact and the probability for a contact to bring about infection in the model were calibrated by studies which indicated the average number of daily contacts for a person and the basic
reproductive number for influenza R0 (the average
number of secondary cases caused by each case of an infectious disease), respectively. In ISTAM, the latent period for influenza was assumed to be 1 to 3 days, the incubation period was one day longer than the latent period and the infectious period was 3 to 6 days [47-49]. The proximity and duration required for infec-tion were assumed to be 1.5 m and 10 minutes, respectively.
A baseline simulation of a hypothetical disease out-break in the city of Eemnes based on ISTAM was pre-sented previously [39]. This paper extends the baseline model by testing three CDC control measures for a hypothetical influenza outbreak in Eemnes using ISTAM. These were:
(1) refrain from social activities (A): the probability of an individual to visit certain places such as social, leisure and sports facilities was decreased to a cer-tain level;
(2) school closure (S): the probability of a pupil to visit school was decreased to 0;
(3) household quarantine (H): a certain proportion of individuals was required to stay at home at all times.
Because in reality, compliance to a control measure may be less than 100%, especially for the cessation of social activities and household quarantine, a series of compliance levels (25%, 50%, 75% and 100%) were tested
for both A andH. Two or three control measures can
work together denoted by the abbreviationsAS,AH,SH
andSHA, with a default 50% compliance level for both
AandHand 100% compliance level for S. The scenario
with no control measures (denoted by N) was also
tested for comparison purposes.
An alert value (a threshold number of infection cases) was used to denote how quickly the control measure was implemented. At the beginning of each day, if the number of infection cases is greater than the alert value, the control measure will be implemented. This meant that there was a small delay of less than one whole day duration between exceeding the alert threshold and intervention. All control measures were assigned an alert value of 20 cases exceptN. Additionally, for con-trol measureSH, a series of alert values (20, 50, 100, 200, 500 and 1000) and a series of rates of transmission (with R0 of 1.24, 1.79, 2.42, and 2.60) were explored. For each of the above scenarios, 300 simulations were run.
Results
Firstly, baseline simulations (N) were analyzed. Five indi-viduals were selected randomly to be the index cases (the initial patients with influenza) andR0was calibrated to be 1.79 [48]. Figure 1 shows the number of new cases from different ABs over time (in weeks). The three basic properties can be found in Table 1: on average, it took 31 days for the number of new infection cases to reach the peak, that is, 308 cases per day. The total number of cases during the outbreak was 5703.
Table 2 shows the distribution of infection across dif-ferent classes of AB. The four main infection sources were household (36%), social place (22.2%), workplace (10.9%) and school (11.9%). The peak day (i.e., day of the outbreak peak) of new infections was the fourth week for most types of AB (Figure 1), although, notably, was the third week for schools. Most infections at schools occurred from pupil to pupil. This implied that the epidemic outbreak was strengthened amongst chil-dren and then spread to adults. The control measure specific to schools may, therefore, be important, espe-cially during the early stages of an outbreak.
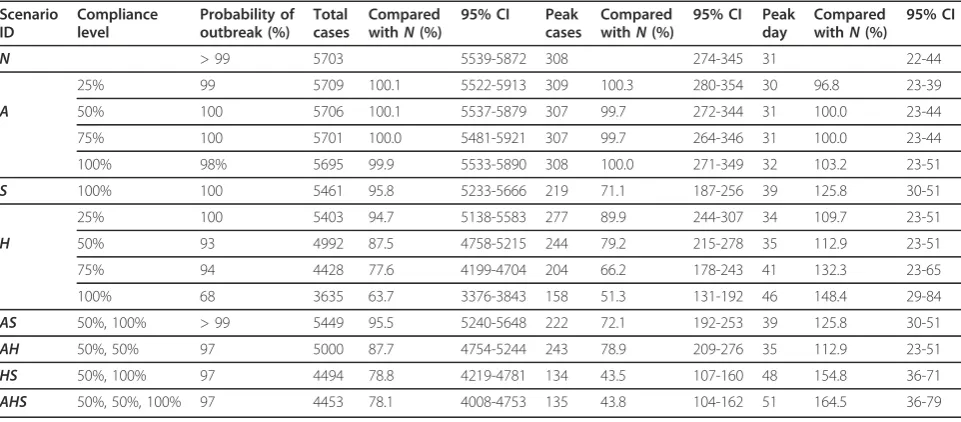
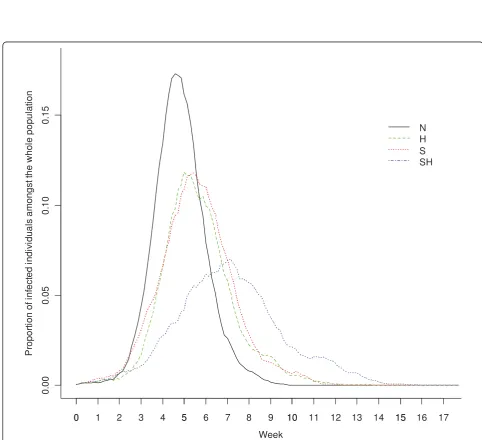
For different control measures, the three properties of the outbreak under each scenario are given in Table 1. The proportion of infected individuals was plotted against time in Figure 2 for scenarios N, S, H and SH (for each scenario, the result of a “typical” simulation run is shown in which the three properties of the out-break were similar to the average values for the 300 simulation runs). The implications from Table 1 and Figure 2 are:
(1) Amongst each single control measure, A was
relatively ineffective. The values of all three
proper-ties for Awere similar to those under the baseline
scenarioN, with almost no variation with
compli-ance level.
compliance levels. The decrease in the peak number
of cases for H was from more than 300 to around
158 for a 100% compliance level, a decrease of about 48.7%. The delay in the peak day was about 3 to 17 days. Moreover, the total number of cases decreased to a range of 3635 - 5403, that is, 63.7% - 94.7% of the baseline value.
(3) The effectiveness of Swas less than that of H: the peak number of cases decreased to about 71.1% and the peak day was delayed by about 8 days. The
effectiveness of Sin reducing the total number of
cases was small, a reduction of about 4.2%.
(4) For multiple control measures, since A had
almost no effect, it is not surprising to see thatAH
0 2 4 6 8 10
0
100
200
300
40
0
500
600
Home Social facilities School Workplace Others
Week
Ca
s
e
[image:5.595.56.540.86.358.2]s
Figure 1Number of new cases from different ABs plotted against time (aggregated to units of a week) for the scenarioN, estimated
over 300 simulations.
Table 1 Total number of cases, peak number of cases and peak day under different control measures
Scenario ID
Compliance level
Probability of outbreak (%)
Total cases
Compared withN(%)
95% CI Peak cases
Compared withN(%)
95% CI Peak day
Compared withN(%)
95% CI
N > 99 5703 5539-5872 308 274-345 31 22-44
25% 99 5709 100.1 5522-5913 309 100.3 280-354 30 96.8 23-39
A 50% 100 5706 100.1 5537-5879 307 99.7 272-344 31 100.0 23-44
75% 100 5701 100.0 5481-5921 307 99.7 264-346 31 100.0 23-44
100% 98% 5695 99.9 5533-5890 308 100.0 271-349 32 103.2 23-51
S 100% 100 5461 95.8 5233-5666 219 71.1 187-256 39 125.8 30-51
25% 100 5403 94.7 5138-5583 277 89.9 244-307 34 109.7 23-51
H 50% 93 4992 87.5 4758-5215 244 79.2 215-278 35 112.9 23-51
75% 94 4428 77.6 4199-4704 204 66.2 178-243 41 132.3 23-65
100% 68 3635 63.7 3376-3843 158 51.3 131-192 46 148.4 29-84
AS 50%, 100% > 99 5449 95.5 5240-5648 222 72.1 192-253 39 125.8 30-51
AH 50%, 50% 97 5000 87.7 4754-5244 243 78.9 209-276 35 112.9 23-51
HS 50%, 100% 97 4494 78.8 4219-4781 134 43.5 107-160 48 154.8 36-71
AHS 50%, 50%, 100% 97 4453 78.1 4008-4753 135 43.8 104-162 51 164.5 36-79
[image:5.595.57.538.513.724.2]Table 2 The proportion of infections between different types of AB using different control measures
N 95% CI % S 95% CI % H 95% CI % HS 95% CI %
Home 2049 1931-2137 36.0 2284 2197-2367 42.1 2129 2012-2246 42.7 2197 2043-2347 49.3
Work 618 570-660 10.9 630 580-678 11.6 478 430-524 9.6 469 422-529 10.5
Shops, post offices and banks 429 387-472 7.5 454 413-487 8.4 312 268-347 6.3 315 269-362 7.1
Healthcare facilities 493 458-538 8.7 536 481-580 9.9 359 325-404 7.2 385 345-432 8.6
Sports and cultural facilities 171 141-206 3.0 194 157-232 3.6 130 106-157 2.6 154 113-194 3.4
Social facilities 1253 1181-1339 22.0 1312 1224-1416 24.2 936 855-1016 18.8 926 856-1002 20.8
School 677 653-706 11.9 20 9-43 0.4 637 606-663 12.8 16 7-34 0.3
Alert value is 20 for all scenarios exceptN; compliance level is 50% forH.
0 5 10 15
0.
00
0.
05
0
.1
0
0.
15
N H S SH
0 1 2 3 4 5 6 7 8 9 10 11 12 13 14 15 16 17
Week
P
ropo
rt
ion of
i
n
fe
c
ted
i
n
d
iv
idua
ls
a
m
ong
s
t t
h
e w
hol
e po
pul
at
io
n
Figure 2Proportion of infected individuals amongst the whole population plotted against time (aggregated to units of a day) for the
[image:6.595.54.537.264.704.2]was similar to H, ASwas similar to SandAHS was similar toHS.HS(andAHS) were the most effective control strategies: the peak number of cases decreased by 56% to 57%, the total number of cases decreased by 21% to 22% and the peak day was delayed by 17 to 20 days.
Table 2 lists the distribution of infections between dif-ferent types of AB amongstS,H andHS(Ais excluded due to its ineffectiveness). Compared with N, Sreduced the infection in schools to a very low level, but infection within other ABs also increased in absolute number,
compensating for the gain. Compared with N, H
reduced the total infection, and the effectiveness varied amongst different types of AB. Thus, the transmission environments (ABs) most resistant to control were home and school, with decreases of 33% and 41%, respectively, while for all other ABs the total number of
cases decreased by 63 - 69%. HSwas the most effective
control measure for all types of AB, with the lowest infection rates for any AB type.
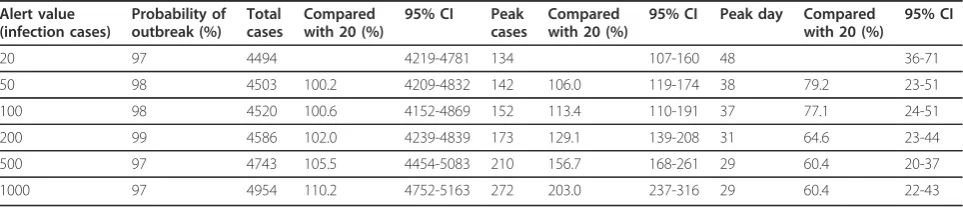
Table 3 shows the three properties of the outbreak
controlled by HS (with a 50% compliance level for
household quarantine), with alert values increasing from 20 to 1000. Clearly, the higher the alert value, the larger the total number of cases and peak number of cases, and the earlier the peak day. With a lower alert value, that is, intervening earlier, control measures were more effective.
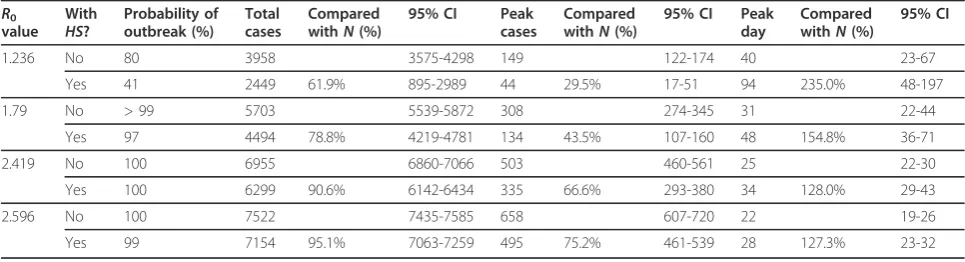
Table 4 shows the three properties of the outbreak
controlled by HS (with a 50% compliance level for
household quarantine) for four values of R0 (1.24, 1.79, 2.42, and 2.60). By comparing the set of outcomes
under control measure HS with the corresponding N
scenario (for the same R0) (Table 4), it can be seen
that the control measure HS was more effective for
smaller R0 values. Because the smaller the R0, the
lower the probability of an outbreak, the greater the relative decrease in total number of cases and peak number of cases, and the greater the relative delay in the peak day.
Discussion
From the ISTAM model, school closure resulted in about a 4.2% reduction in the total number of cases and a 28.9% reduction in the peak number of cases. These reductions were rather low compared with some empiri-cal studies [36,37] which suggest approximately a 15% reduction in the total number of cases and a 40% reduc-tion in the peak number of cases. As Table 2 shows, with school closure, infection in schools was reduced to a very low level, but infection within other ABs increased in absolute number. The explanation is that school closure alone can move pupils’ daily activities from school to home, and infection risk at home and other ABs may actually increase. This is consistent with other studies [31,32,50-53]. Milne et al. [51] argued in a comparison study that differences in effectiveness can arise from differences in assumptions about the timing and duration of school closure. It would be interesting to implement such finer level differences within the ISTAM model in future. Another explanation is that the current model does not consider the age dependence of susceptibility and infectiousness. For example, children may be more susceptible and infectious than adults [54,55]. This should be explored in the future.
[image:7.595.57.539.610.714.2]This research highlighted the importance of combin-ing control measures. As shown in Table 1, school clo-sure alone was not particularly effective, but when combined with home quarantine, it reduced the total number of cases more than the sum of these two con-trol measures alone. It should be noted that although the three control measures are applicable to different levels of aggregation (refraining from social activity is applicable to individuals, household quarantine is applic-able to all members within households and school clo-sure is applicable to all students), they are not independent of each other. For example, individuals under household quarantine automatically refrain from social activities, and students under household quaran-tine do not go to school. The overlap between control measures may explain the enhancing effect of combining measures. The combination of non-pharmaceutical
Table 3 Total number of cases, peak number of cases and peak day underHScontrol with various alert values
Alert value (infection cases)
Probability of outbreak (%)
Total cases
Compared with 20 (%)
95% CI Peak cases
Compared with 20 (%)
95% CI Peak day Compared with 20 (%)
95% CI
20 97 4494 4219-4781 134 107-160 48 36-71
50 98 4503 100.2 4209-4832 142 106.0 119-174 38 79.2 23-51
100 98 4520 100.6 4152-4869 152 113.4 110-191 37 77.1 24-51
200 99 4586 102.0 4239-4839 173 129.1 139-208 31 64.6 23-44
500 97 4743 105.5 4454-5083 210 156.7 168-261 29 60.4 20-37
1000 97 4954 110.2 4752-5163 272 203.0 237-316 29 60.4 22-43
measures with pharmaceutical measures needs to be investigated in the future, particularly as for infectious diseases with largeR0, the effectiveness of non-pharma-ceutical measures was shown to be limited.
ISTAM is a novel model for simulating the transmis-sion of infectious disease. The two-level structure (separating between-AB and within-AB activities) makes ISTAM flexible such that it can be applied to novel cir-cumstances. The concept of AB plays a key role: both the building of individual activity patterns and simula-tion within ABs depends on how well the ABs are defined and classified. The merits of simulation by ISTAM are: (1) ISTAM is straightforward and provides a process-based representation of the real world, (2) using ISTAM, it is easy to account for important factors, neglect less important factors and include random fac-tors in the model and (3) ISTAM facilitates the model-ling of human actions (both active and reactive) and the interaction between humans at fine scales. ISTAM, if fed with activity pattern data, can simulate effectively
individuals’ movements at between-AB and within-AB
levels. Providing data sources are sufficient, the model can be extended readily to larger study areas although the effort involved in data collection and model imple-mentation is likely to be substantial and time-consuming.
Despite the above advantages of ISTAM, the utility of the results presented here in terms of control measures depends on the ability of the ISTAM model to represent real-world processes such as human behaviour and movement patterns, both between and within ABs (gen-erally buildings), the spatial structure of the set of ABs themselves, particularly at within-AB level, transmission probability as a function of the space-time separation between individuals, and the natural history of the tar-geted disease such as the time lines describing the evo-lution of infection and disease within the host (e.g., latent, infectious, incubation and symptomatic periods). For example, it is assumed that one requirement for transmission is a susceptible person within a certain
distance of an infectious person. In fact, for most air-borne infectious diseases, airair-borne disease agents may stay suspended in the air or survive on some surfaces such as door handles for an extended period of time. This suggests co-location may not be a strict require-ment for infection. Applying an extended definition of effective contact will be a challenge for future research. Another problem arises due to limited validation. It was not possible to validate the model directly due to the lack of historical data on the impact of non-pharmaceu-tical control measures on disease outbreaks in Eemnes. Nevertheless, several strategies were implemented to validate the model indirectly [39], with satisfactory results.
The emergent space-time pattern of disease in a given region depends on the parameters of both the disease transmission model and the spatial and social network structures in place in the environment in which trans-mission takes place. In particular, it is expected that changes in the parameters of the (simulation) model will lead to observable changes in the space-time pattern of disease. Simulation models provide an important means for evaluating the sensitivity of emergent patterns and their space-time character to changes in model para-meters. Thus, while the results of ABMs such as ISTAM depend on model parameterization, sensitivity analysis can be used to investigate the range of parameter values that leads to similar evidence for decision-making, pro-viding reassurance to decision-makers.
[image:8.595.56.539.100.231.2]If the association between elements of environmental and social structures and disease outcomes can be quan-tified then it should be possible to map the vulnerability of entire settlements to specific diseases. It is well-known that the behaviour characteristics of individuals can be modified to reduce the likelihood of disease transmission. However, the effects of spatial structural elements such as boarding school versus day school education for children and settlement structure (e.g., out-of-town supermarkets versus local shops) are less well studied. Again, such knowledge would be useful in
Table 4 Total number of cases, peak number of cases and peak day with or withoutHScontrol for four values ofR0
R0
value With
HS?
Probability of outbreak (%)
Total cases
Compared withN(%)
95% CI Peak cases
Compared withN(%)
95% CI Peak day
Compared withN(%)
95% CI
1.236 No 80 3958 3575-4298 149 122-174 40 23-67
Yes 41 2449 61.9% 895-2989 44 29.5% 17-51 94 235.0% 48-197
1.79 No > 99 5703 5539-5872 308 274-345 31 22-44
Yes 97 4494 78.8% 4219-4781 134 43.5% 107-160 48 154.8% 36-71
2.419 No 100 6955 6860-7066 503 460-561 25 22-30
Yes 100 6299 90.6% 6142-6434 335 66.6% 293-380 34 128.0% 29-43
2.596 No 100 7522 7435-7585 658 607-720 22 19-26
terms of planning containment strategies and such knowledge can only be provided by simulation models such as ISTAM.
Conclusions
ISTAM was used to quantify the efficacy of three of the social control measures recommended by the CDC. Such quantification, while carrying uncertainty due to model structure and parameterization, is not possible by other means such asin vivo, real life, epidemiological or biological experiments. Sensitivity analysis was used to explore the outcome of the simulation for a range of parameter values (compliance level, alert value,R0). For the simulated influenza outbreak in the city of Eemnes, the Netherlands, household quarantine was the most effective control measure in terms of the three indices including total number of cases, peak number of cases and peak day used to assess efficacy. Refraining from social activities was the least effective control measure. School closure alone was of limited efficacy, unless com-bined with other control measures such as household quarantine. When school closure was used singly, a pro-portion of infections were displaced to other settings. This conclusion has important implications and is con-sistent with other research [31,32,52,53].
ABMs should be applied in future to evaluate the effi-cacy of control measures for a range of disease out-breaks in a range of settings, conditional upon the availability of sufficient information about the scenario (e.g., demographics, the built environment and humans’ daily activities) and knowledge about the transmission processes at a fine scale (specifically, the relationship between transmission and the space-time dynamics of individuals).
Acknowledgements
The authors are grateful to the Worldwide Universities Network (WUN) for funding a research visit of YY to the University of Utrecht during which the ISTAM model was fitted to the city of Eemnes.
Author details
1Department of Epidemiology, University of Michigan, Ann Arbor, 48109,
USA.2Centre for Geographical Health Research, Geography and Environment, University of Southampton, Southampton, SO17 1BJ, UK. 3Department of Human Geography and Planning, Utrecht University,
Utrecht, 3508 TC, the Netherlands.
Authors’contributions
All three authors contributed to the study design. YY implemented the model, analysed the results and drafted the paper. PMA took a key part in paper writing. DE provided the data sources and contributed to data preparation. All authors critically reviewed and revised versions of the manuscript.
Competing interests
The authors declare that they have no competing interests.
Received: 27 September 2010 Accepted: 18 July 2011 Published: 18 July 2011
References
1. Bauch CT, Lloyd-Smith JO, Coffee MP, Galvani AP:Dynamically Modeling SARS and Other Newly Emerging Respiratory Illnesses.Epidemiology2005, 16:791-801.
2. Ginsberg J, Mohebbi MH, Patel RS, Brammer L, Smolinski MS, Brilliant L: Detecting influenza epidemics using search engine query data.Nature 2009,457(7232):1012-1014.
3. Cohen J, Enserink M:As Swine Flu Circles Globe, Scientists Grapple With Basic Questions.Science2009,324(5927):572-573.
4. Fraser C, Donnelly CA, Cauchemez S, Hanage WP, van Kerkhove MD, Hollingsworth TD, Griffin J, Baggaley RF, Jenkins HE, Lyons EJ, Jombart T, Hinsley WR, Grassly NC, Balloux F, Ghani AC, Ferguson NM, Rambaut A, Pybus OG, Lopez-Gatell H, Alpuche-Aranda CM, Chapela IB, Zavala EP, Guevara DME, Checchi F, Garcia E, Hugonnet S, Roth C, The WHO Rapid Pandemic Assessment Collaboration:Pandemic Potential of a Strain of Influenza A (H1N1): Early Findings.Science2009, 324(5934):1557-1561.
5. Medlock J, Galvani AP:Optimizing Influenza Vaccine Distribution.Science 2009,325(5948):1705-1708.
6. van Rijswoud E:Flu: weighing up conflicting expert information.Nature 2009,460(7255):571.
7. Yang Y, Sugimoto JD, Halloran ME, Basta NE, Chao DL, Matrajt L, Potter G, Kenah E, Longini IM Jr:The Transmissibility and Control of Pandemic Influenza A (H1N1) Virus.Science2009,326(5953):729-733.
8. Riley S, Fraser C, Donnelly CA, Ghani AC, Abu-Raddad LJ, Hedley AJ, Leung GM, Ho L-M, Lam T-H, Thach TQ, Chau P, Chan K-P, Lo S-V, Leung P-Y, Tsang T, Ho W, Lee K-H, Lau EMC, Ferguson NM,
Anderson RM:Transmission Dynamics of the Etiological Agent of SARS in Hong Kong: Impact of Public Health Interventions.Science2003, 300(20):1961-1966.
9. Ferguson NM, Fraser C, Donnelly CA, Ghani AC, Anderson RM:Public Health Risk from the Avian H5N1 Influenza Epidemic.Science2004, 304(5673):968-969.
10. Carrat F, Vergu E, Ferguson NM, Lemaitre M, Cauchemez S, Leach S, Valleron A-J:Time Lines of Infection and Disease in Human Influenza: A Review of Volunteer Challenge Studies.American Journal of Epidemiology 2008,167(7):775-785.
11. Lau LLH, Cowling BJ, Fang VJ, Chan K-H, Lau EHY, Lipsitch M, Cheng CKY, Houck PM, Uyeki TM, Peiris JSM, Leung GM:Viral Shedding and Clinical Illness in Naturally Acquired Influenza Virus Infections.Journal of Infectious Diseases2010,201(10):1509-1516.
12. Suess T, Buchholz U, Dupke S, Grunow R, Mad Heiden, Heider A, Biere B, Schweiger B, Haas W, Krause G:Shedding and Transmission of Novel Influenza Virus A/H1N1 Infection in Households - Germany, 2009. American Journal of Epidemiology2010,171(11):1157-1164. 13. Hethcote HW:The Mathematics of Infectious Diseases.Society for
Industrial and Applied Mathematics Review2000,42:599-653. 14. Koopman JS:Infection transmission science and models.Journal of
infectious disease2005,58:S3-S8.
15. Koopman JS:Modeling Infection Transmission.Annual Review of Public Health2004,25:303-326.
16. Carley K, Fridsma D, Casman E, Yahja A, Altman N, Chen L, Kaminsky B, Nave D:BioWar: Scalable Agent-based Model of Bioattacks.IEEE Transactions on Systems, Man and Cybernetics2004,36:252-265.
17. Bian L:A conceptual framework for an individual-based spatially explicit epidemiological model.Environment and Planning B: Planning and Design 2004,31:381-395.
18. Bian L, Liebner D:Simulating Spatially Explicit Networks for Dispersion of Infectious Diseases.InGIS, Spatial Analysis and Modelling.Edited by: Maguire D, Batty M, Goodchild M. USA: ESRI Press; 2005:245-264. 19. Dibble C, Feldman PG:The GeoGraph 3D Computational Laboratory:
Network and Terrain Landscapes for RePast.Journal of Artificial Societies and Social Simulation2004,7(1).
20. Perez L, Dragicevic S:An agent-based approach for modeling dynamics of contagious disease spread.International Journal of Health Geographics 2009,8(1):50.
21. Halloran ME, Longini IM, Nizam A, Yang Y:Containing bioterrorist smallpox.Science2002,298:1428-1432.
23. Longini IM, Nizam A, Xu S, Ungchusak K, Hanshaoworakul W, Cummings DAT, Halloran ME:Containing pandemic influenza at the source.Science2005,309:1083-1087.
24. Ferguson NM, Cummings DAT, Cauchemez S, Fraser C, Riley S, Meeyai A, Iamsirithaworn S, Burke DS:Strategies for containing an emerging influenza pandemic in Southeast Asia.Nature2005,437(8):209-214. 25. Ferguson NM, Cummings DAT, Fraser C, Cajka JC, Cooley PC, Burke DS:
Strategies for mitigating an influenza pandemic.Nature2006, 442:448-452.
26. Epstein JM, Cummings DAT, Chakravarty S, Singa RM, Burke DS:Toward a Containment Strategy for Smallpox Bioterror: An Individual-Based Computational Approach.Center on Social and Economic Dynamics, Johns Hopkins University; 2002.
27. Epstein JM:Controlling Pandemic Flu: The Value of International Air Travel Restrictions.PloS ONE2007,5.
28. Eubank S, Guclu H, Anil Kumar V, Marathe M, Srinivasan A, Toroczkai Z, Wang N:Modelling disease outbreaks in realistic urban social networks. Nature2004,429:180-184.
29. Elliott P, Wakefield JC, Best NG, Briggs DJ:Spatial Epidemiology: methods and applications.InSpatial epidemiology: methods and applications.Edited by: Elliott P, Wakefield JC, Best NG, Briggs DJ. Oxford, UK: Oxford University Press; 2000:.
30. Interim Pre-Pandemic Planning Guidance: Community Strategy for Pandemic Influenza Mitigation in the United States, Early, Targeted, Layered Use of Nonpharmaceutical Interventions.[http://www. pandemicflu.gov/professional/community/community_mitigation.pdf]. 31. Aledort JE, Lurie N, Wasserman J, Bozzette SA:Non-pharmaceutical public
health interventions for pandemic influenza: an evaluation of the evidence base.BMC Public Health2007,7(208).
32. Hatchett RJ, Mecher CE, Lipsitch M:Public health interventions and epidemic intensity during the 1918 influenza pandemic.Proceedings of the National Academy of Sciences2007,104(18):7582-7587.
33. Markel H, Lipman HB, Navarro JA, Sloan A, Michalsen JR, Stern AM, Cetron MS:Nonpharmaceutical interventions implemented by US cities during the 1918-1919 influenza pandemic.JAMA2007,298(6):644-654. 34. Yasuda H, Yoshizawa N, Kimura M, Shigematsu M, Matsumoto M,
Kawachi S, Oshima M, Yamamoto K, Suzuki K:Preparedness for the Spread of Influenza: Prohibition of Traffic, School Closure, and Vaccination of Children in the Commuter Towns of Tokyo.Journal of Urban Health2008, 85(4):619-635.
35. Kawaguchi R, Miyazono M, Noda T, Takayama Y, Sasai Y, Iso H:Influenza (H1N1) 2009 outbreak and school closure, Osaka Prefecture, Japan. Emerging Infectious Diseases2009,15(10):1685.
36. Cauchemez S, Valleron A-J, Boelle P-Y, Flahault A, Ferguson NM:Estimating the impact of school closure on influenza transmission from Sentinel data.Nature2008,452(7188):750-754.
37. Cauchemez S, Ferguson NM, Wachtel C, Tegnell A, Saour G, Duncan B, Nicoll A:Closure of schools during an influenza pandemic.The Lancet Infectious Diseases2009,9(8):473-481.
38. Group WHOW:Nonpharmaceutical Interventions for Pandemic Influenza, National and Community Measures.Emerging Infectious Diseases2006, 12(1):88-94.
39. Yang Y, Atkinson PM, Ettema D:Simulation of Infectious Disease Transmission within a City: the Application of ISTAM to Eemnes by Role-based AB Simulation.Journal of the Royal Society Interface2008,5:759-772. 40. Yang Y, Atkinson PM:Individual space-time activity-based model: a
model for simulation of airborne infectious disease transmission by activity bundle simulation.Environment and Planning B: Planning and Design2008,35(1):80-99.
41. Oppong JR, Mikler AR, Moonan P, Weis S:From Medical Geography to Computational Epidemiology - Dynamics of Tuberculosis Transmission in Enclosed Spaces.Innovative Internet Community SystemsHeidelberg: Springer Berlin; 2006, 189-197.
42. Hutton MD, Stead WW, Cauthen GM, Bloch AB, Ewing WM:Nosocomial transmission of tuberculosis associated with a draining abscess.Journal of Infectious Disease1990,161:286-295.
43. Noakes CJ, Beggs CB, Sleigh PA, Kerr KG:Modelling the transmission of airborne infections in enclosed spaces.Epidemiology and Infection2006, 1-10.
44. Hall ET:The Hidden Dimension.New York, USA: Doubleday; 1966.
45. Given LM, Leckie GJ:“Sweeping”the library: Mapping the social activity space of the public library.Library and Information Science Research2003, 25:365-385.
46. Ettema D, Jong KD, Timmermans H, Bakema A:PUMA: Multi-agent modelling of urban systems.InLand use modeling.Edited by: Koomen E, Bakema A, Stillwell J. Scholten H: Springer; 2006:237-258.
47. Elveback LR, Fox JP, Ackerman E:Stochastic stimulation models for two immunization problems.SIMS Conference on Epidemiology: 19751975, 90-103.
48. Longini IM, Halloran ME, Nizam A, Yang Y:Containing pandemic influenza with antiviral agents.American Journal of Epidemiology2004,159:623-633. 49. Longini I, Nizam A, Xu S, Ungchusak K, Hanshaoworakul W, Cummings D,
Halloran M:Containing pandemic influenza at the source.Science2005, 309:1083-1087.
50. Glass RJ, Glass LM, Beyeler WE, Min HJ:Targeted social distancing design for pandemic influenza.Emerging Infectious Diseases2006,
12(11):1671-1681.
51. Milne GJ, Kelso JK, Kelly HA, Huband ST, McVernon J:A Small Community Model for the Transmission of Infectious Diseases: Comparison of School Closure as an Intervention in Individual-Based Models of an Influenza Pandemic.PloS ONE2008,3(12):e4005.
52. Koonin LM, Cetron MS:School Closure to Reduce Influenza Transmission. Emerging Infectious Diseases2009,15(1):137-138.
53. Germann TC, Kadau K, Longini IM, Macken CA:Mitigation strategies for pandemic influenza in the United States.Proceedings of the National Academy of Sciences2006,103(15):5935-5940.
54. Nishiura H, Oshitani H:Household Transmission of Influenza (H1N1-2009) in Japan: Age-specificity and Reduction of Household Transmission Risk by Zanamivir Treatment.The Journal of International Medical Research 2011,39:619-628.
55. van Boven M, Donker T, van der Lubben M, van Gageldonk-Lafeber RB, te Beest DE, Koopmans M, Meijer A, Timen A, Swaan C, Dalhuijsen A, Hahne S, van den Hoek A, Teunis P, van der Sande MAB, Wallinga J:Transmission of Novel Influenza A(H1N1) in Households with Post-Exposure Antiviral Prophylaxis.PloS ONE2010,5(7):e11442.
Pre-publication history
The pre-publication history for this paper can be accessed here: http://www.biomedcentral.com/1471-2334/11/199/prepub
doi:10.1186/1471-2334-11-199
Cite this article as:Yanget al.:Analysis of CDC social control measures using an agent-based simulation of an influenza epidemic in a city. BMC Infectious Diseases201111:199.
Submit your next manuscript to BioMed Central and take full advantage of:
• Convenient online submission
• Thorough peer review
• No space constraints or color figure charges
• Immediate publication on acceptance
• Inclusion in PubMed, CAS, Scopus and Google Scholar
• Research which is freely available for redistribution