Int. J. Electrochem. Sci., 12 (2017) 3561 – 3575, doi: 10.20964/2017.05.21
International Journal of
ELECTROCHEMICAL
SCIENCE
www.electrochemsci.org
Synthesis of Highly Active Pt-Pd-Cu/C Catalysts for Formic
Acid Oxidation
Yange Suo*, Yuxin Guo, Chenbin Rong, Zhiguo Zhang, Guilin Hu
Department of Energy and Environmental Systems Engineering, Zhejiang University of Science and Technology, Liuhe Road 318#, Hangzhou, Zhejiang Province 310023, China
*
E-mail: [email protected]
Received: 11 January 2017 / Accepted: 2 March 2017 / Published: 12 April 2017
This work reports the synthesis of a series of carbon supported Pt-Pd-Cu (Pt-Pd-Cu/C) nano-catalysts for formic acid oxidation. The trimetallic catalysts were prepared by a one-pot protocol through reduction of Pt, Pd and Cu ions using ethylene glycol and sodium citrate as the reducing and stabilizing reagents. XRD characterization suggests that Pt-Pd-Cu alloys with different lattice parameters can be successfully prepared through adjusting the atomic ratios of Pt, Pd and Cu ions in the precursor solutions. The average crystal sizes of the Pt-Pd-Cu/C catalysts are in the range of 2.7-3.1 nm. TEM images shows that the metallic nanoparticles are well dispersed on the carbon surface, with Pt1Pd3Cu3/C catalyst showing obvious aggregation. XPS was carried out to analyze the surface
compositions, as well as the chemical states of the novel metals in the catalysts. The real atomic ratios of the metals in the catalysts based on ICP-OES evaluation are consistent with the stoichiometric values. Electrochemical analysis suggests that the activities the Pt-Pd-Cu/C catalysts towards formic acid oxidation are dependent on the composition of the catalysts, with Pt1Pd4Cu2/C exhibiting the best
performance. A mass normalized peak current density of 3.02 A/mg(Pt+Pd) was observed on
Pt1Pd4Cu2/C catalyst.
Keywords: PtPdCu, nano-catalyst, formic acid oxidation, fuel cell
1. INTRODUCTION
poisonous COads, which could only be removed at high potential range. On Pt surface, the dehydration
of formic acid oxidation is dominant and thus the activity of Pt is greatly affected [4]. Although Pd favors the dehydrogenation of formic acid to form CO2 [5], the poor electrochemical stability of Pd
greatly affects its practical applications [6]. Besides, both Pt and Pd are precious metals, resulting in the high cost of the catalysts for fuel cell. Therefore, development of less expensive and more active materials for formic acid oxidation is still highly demanding.
Alloying Pt or Pd with another metals is one of the most effective ways to reduce the loading of noble metals. Moreover, the electronic or geometric structure of Pt-based or Pd-based binary materials could be greatly different from the monometallic Pt or Pd, and thus enhanced activity of Pt-based or Pd-based binary catalysts have been obtained. For instance, PtCo [7], PtFe [8], PtBi [9], PtAg [10], PtSn [11], PtCu [12], PdIr [13], PdCo [14], PdNi [15], PdRh [16], PdAg [17], PdCr [18], PdCu [19], PdAu [20], PdPt [21] have been reported to exhibit better performance towards formic acid oxidation than single Pt or Pd. The enhanced activities are usually ascribed to the adjusted electronic effect [22], structural effect [23] or synergistic effect [24]. Besides binary catalysts, some efforts have also been put to explore ternary material due to the more flexibility of adjusting the electronic properties. For instance, Yu et al., [25] have prepared carbon supported ternary Pd-Cu-Fe catalyst with high performance for formic acid oxidation. Fu et al., [26] have synthesized trimetallic PtAgCu@PtCu core@shell concave nanooctahedrons through a one-pot hydrothermal reduction method. The as-prepared catalyst exhibit a superior electro-catalytic activity towards formic acid oxidation compared with commercial Pt black. Cui et al., [27] have studied the active site of PtPdCu catalyst for formic acid oxidation. The coverage of Pt atoms on the topmost surface layer has an influence on its activity. Jiang et al., [28] have synthesized Pd-Pt-Cu nanocatalysts through reduction by NaBH4 with either
disodium ethylenediamine tetraacetate (EDTA) as the stabilizer in aqueous solution or oleylamine (OAm) as the stabilizer in anhydrous ethanol, as well as using ethylene glycol as the reducing reagent and sodium citrate or urea as the stabilizing reagent. Electrochemical evaluation suggests that Pd-Pt-Cu nanocatalysts synthesized using ethylene glycol as the reducing reagent and sodium citrate as the stabilizing reagent exhibits the highest activity towards formic acid oxidation. They have also synthesized three Pd-Pt-Cu nanocatalysts containing trace amount of Pt (atomic content of Pt lower than 7%) and investigated the composition-dependent activity. However, they have not explored the activity of Pd-Pt-Cu with a relatively high content of Pt towards formic acid oxidation.
In this work, a series of carbon supported Pt-Pd-Cu trimetallic (Pt-Pd-Cu/C) nano-catalysts (metallic loading of 20 wt %, atomic ratios of Pt to Pd to Cu being 1:1:1, 1:2:1, 1:5:1, 1:4:2, 1:3:3) were prepared towards formic acid oxidation reaction. The trimetallic catalysts were prepared through simply co-reduction of Pt, Pd and Cu ions using ethylene glycol and sodium citrate as the reducing and stabilizing reagents. XRD, TEM, XPS, ICP-OES were carried out to characterize the physiochemical properties of the catalysts. Electrochemical analysis suggests that the mass activities of the Pt-Pd-Cu/C activities are dependent on the composition of the catalysts, with Pt1Pd4Cu2/C exhibiting the highest
2. EXPERIMENTAL
2.1. Chemicals
Chloroplatinic acid hexahydrate (H2PtCl6·6H2O), copper (II) sulfate pentahydrate
(CuSO4·5H2O), ethylene glycol (C2H6O2), perchloric acid (HClO4), sodium citrate
(C6H5Na3O7·2H2O), and ethanol (C2H5OH) were purchased from Sinopharm Chemical Reagent Co.,
Ltd. Ammonium tetrachloropalladate ((NH4)2PdCl4) and formic acid (HCOOH) were ordered from
Aladdin. Vulcan XC-72 carbon was purchased from E-TEK. Nafion solution (5 %) was received from Dupont. All chemicals were of analytical grade and used as received.
2.2. Synthesis of the catalysts
Carbon supported Pt-Pd-Cu catalysts with different compositions (metallic loading of 20 wt %, atomic ratios of Pt to Pd to Cu being 1:1:1, 1:2:1, 1:5:1, 1:4:2, 1:3:3) were prepared according to our previous report [29]. The synthesis of carbon supported Pt-Pd-Cu catalyst with atomic ratio of Pt to Pd to Cu of 1:1:1 was taken as an example to describe the detailed synthesis procedure. Firstly, 0.5793 g sodium citrate was dissolved into a solution containing 40 ml water and 40 ml ethylene glycol, and then 96 mg Vulcan XC-72 carbon was poured into the above solution which was stirred and ultrasonically mixed for 2 h to obtain the sodium citrate suspension. At the same time, 3.5 ml chloroplatinic acid hexahydrate (H2PtCl6·6H2O) aqueous solution (1 g / 100 ml), 23.32 mg ammonium
tetrachloropalladate ((NH4)2PdCl4) and 16.6 mg copper (II) sulfate pentahydrate (CuSO4·5H2O) were
dissolved into 15 ml water / ethylene glycol mixture solution (containing 7.5 ml water and 7.5 ml ethylene glycol) to obtain the precursor solution. After removing air with N2 bubbling for 30 minutes,
the sodium citrate suspension was refluxed at 170 oC oil bath for 15 minutes. Then, the precursor solution was added into the heated sodium citrate suspension drop by drop. Another 55 ml water / ethylene glycol solution (volume / volume = 1:1) was added into the reaction system, which was then continued to be heated for another 2 h. The reaction product was filtered and washed with water and ethanol. The residue was dried at 60 oC for 12 h and then grounded in an agate mortar to get the carbon supported Pt-Pd-Cu nanoparticles (denoted as Pt1Pd1Cu1/C). Carbon supported Pt-Pd-Cu catalysts with
atomic ratios of Pt to Pd to Cu of 1:2:1, 1:5:1, 1:4:2, 1:3:3 were denoted as Pt1Pd2Cu1/C, Pt1Pd5Cu1/C,
Pt1Pd4Cu2/C and Pt1Pd3Cu3/C respectively. Carbon supported Pd nanoparticles (denoted as Pd/C) with
Pd loading of 20 wt % and carbon supported Pt nanoparticles (denoted as Pt/C) with Pt loading of 20 wt % were also prepared using the same protocol for comparison.
2.3. Physicochemical characterization
microscopy (TEM) was carried out with a JEM 2100 TEM system operated with LaB6 filament at 200
kV. X-ray photoelectron spectroscopy (XPS) was carried out with a PHI500 system. Inductively coupled plasma-Optical Emission Spectrometer (ICP-OES) was carried out with a VISTAMPXICP-720 system.
2.4. Electrochemical evaluation
Electrochemical measurements were carried out using a CHI potentiostat (CHI600E). To do the electrochemical experiments, a conventional three-electrode cell, with a catalyst coated glassy carbon electrode (working electrode), a Pt coil (counter electrode) and a saturated Ag/AgCl electrode (reference electrode), was put into a 25 oC water tank. The glassy carbon substrate was polished with alumina suspension prior to use. To prepare the working electrode, 10 mg catalyst was dispersed ultrasonically in 2 ml diluted nafion solution (0.05 wt % in ethanol) for 30 minutes and 10 µl of the suspension was pipetted onto the glassy carbon electrode (d = 5 mm) by a microsyringe and left to dry at room temperature. Prior to the activity measurement, the working electrode was cleaned by cyclic voltammogram (CV) sweeping in N2-saturated 0.5 M HClO4 solution. Then, certain amount (in order
to keep the concentration in the electrolyte as 0.5 M) of formic acid was added into the electrolyte to do the activity measurements. The currents in this manuscript were normalized by the total mass of Pt and Pd (analyzed by ICP-OES) on the glassy carbon electrode to give mass current densities, whose units are A/mg(Pt+Pd).
3. RESULTS AND DISCUSSION
[image:4.596.154.443.497.724.2]3.1. Structure and morphology characterization
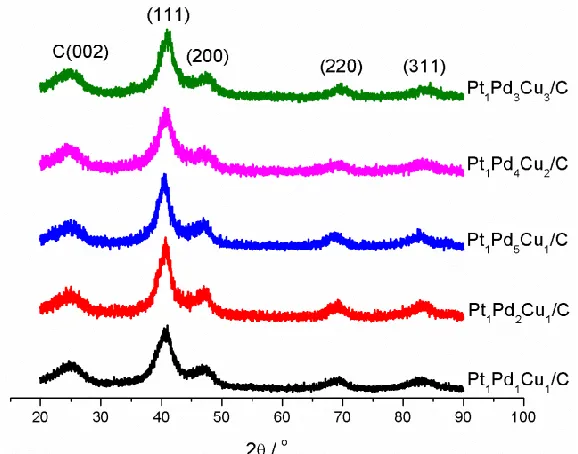
Figure 1. XRD patterns of the Pt1Pd1Cu1/C, Pt1Pd2Cu1/C, Pt1Pd5Cu1/C, Pt1Pd4Cu2/C, Pt1Pd3Cu3/C
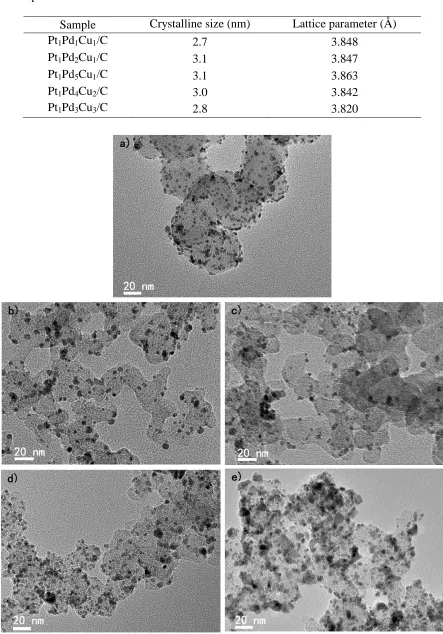
Table 1. Crystalline sizes and lattice parameters of the Pt-Pd-Cu/C catalysts with different compositions based on XRD characterization
Sample Crystalline size (nm) Lattice parameter (Å)
Pt1Pd1Cu1/C 2.7 3.848
Pt1Pd2Cu1/C 3.1 3.847
Pt1Pd5Cu1/C 3.1 3.863
Pt1Pd4Cu2/C 3.0 3.842
Pt1Pd3Cu3/C 2.8 3.820
Figure 2. TEM images of the a) Pt1Pd1Cu1/C; b) Pt1Pd2Cu1/C; c) Pt1Pd5Cu1/C; d) Pt1Pd4Cu2/C; e)
[image:5.596.76.519.96.730.2]
Figure 3. XPS spectra of the Pt1Pd1Cu1/C, Pt1Pd2Cu1/C, Pt1Pd5Cu1/C, Pt1Pd4Cu2/C, Pt1Pd3Cu3/C
catalysts
XRD patterns of the Pt1Pd1Cu1/C, Pt1Pd2Cu1/C, Pt1Pd5Cu1/C, Pt1Pd4Cu2/C, Pt1Pd3Cu3/C
catalysts are shown in Figure 1. The broad diffraction peak at about 25 o is assigned to the (002) plane of Vulcan XC-72 carbon. A single group of characteristic diffraction peaks of face centered cubic (fcc) crystalline structure can be observed on all the Pt-Pd-Cu/C catalysts. The lattice parameters of the catalysts calculated based on Bragg’s law [30] using (220) diffraction peak are shown in Table 1. The lattice parameters of the Pt-Pd-Cu/C catalysts are smaller than that of the standard value of Pt (3.924 Å) or Pd (3.891 Å). Since the atomic radius of Cu is smaller than that of Pt or Pd, incorporation of Cu to the lattice of Pt or Pd could induce the lattice strain phenomena. Therefore, the reduced lattice parameters of the Pt-Pd-Cu/C catalysts could suggest the formation of alloy structure. From the data of Pt1Pd5Cu1/C, Pt1Pd4Cu2/C, Pt1Pd3Cu3/C, it can be seen that when the content of Pt keeps unchanged,
the lattice parameter of the trimetallic catalyst decreases with the increase of Cu content. The average crystalline sizes of the Pt-Pd-Cu/C are in the range of 2.7-3.1 nm.
TEM images of the Pt1Pd1Cu1/C, Pt1Pd2Cu1/C, Pt1Pd5Cu1/C, Pt1Pd4Cu2/C, Pt1Pd3Cu3/C
catalysts are shown in Figure 2. It can be seen that, the nanoparticles in Pt1Pd1Cu1/C, Pt1Pd2Cu1/C
catalysts are well dispersed on the carbon surface. However, when the content of Pt is low, as in the Pt1Pd5Cu1/C, Pt1Pd4Cu2/C, Pt1Pd3Cu3/C catalyst, particle aggregation can be observed, with
[image:6.596.106.492.70.383.2]
Figure 3 shows the XPS spectra of the Pt1Pd1Cu1/C, Pt1Pd2Cu1/C, Pt1Pd5Cu1/C, Pt1Pd4Cu2/C,
Pt1Pd3Cu3/C catalysts. Pt 4f, Pd 3d and Cu 2p spectra can be observed on all the catalysts. Figure 4
shows the Pt 4f high resolution spectra of all the Pt-Pd-Cu/C catalysts. A doublet including a low energy band (Pt 4f7/2) and a high energy band (Pt 4f5/2) can be observed. The chemical valance of Pt
can be obtained through fitting the spectra to three pairs of overlapping curves, labeled as 1, 2, and 3, which can be ascribed to be Pt(0) chemical state, Pt(II) chemical state and Pt(IV) chemical state respectively [10]. The binding energies and relative intensities of the Pt 4f of the three catalysts are shown in Table 2. The relative intensities of Pt(0) in the Pt1Pd1Cu1/C, Pt1Pd2Cu1/C, Pt1Pd5Cu1/C,
Pt1Pd4Cu2/C, Pt1Pd3Cu3/C catalysts are 37 %, 46 %, 42 %, 50 % and 39 % respectively. Figure 5
shows the regional Pd 3d spectra of all the Pt-Pd-Cu/C catalysts. Similar to Pt 4f, Pd 3d also shows a doublet containing a low energy band (Pd 3d5/2) and a high energy band (Pd 3d3/2). Two pairs of
overlapping curves labeled as 1, and 2 can be ascribed to be Pd(0) chemical state and Pd(II) chemical state respectively. As shown in Table 3, the relative intensity of Pd(0) in the Pt1Pd1Cu1/C,
Pt1Pd2Cu1/C, Pt1Pd5Cu1/C, Pt1Pd4Cu2/C, Pt1Pd3Cu3/C catalysts are 40 %, 42 %, 39 %, 54 % and 47 %
respectively. Table 4 shows the surface metallic atomic ratios analyzed from XPS. It can be seen that the contents of Pd on the surface of the catalysts are consistent with the stoichiometric values. The contents of Pt are lower than their stoichiometric values, while the contents of Cu are higher than their stoichiometric values, indicating an enrichment of Cu on the surface.
Table 2. Binding energies, and relative intensities of different chemical states of Pt in the Pt1Pd1Cu1/C, Pt1Pd2Cu1/C, Pt1Pd5Cu1/C, Pt1Pd4Cu2/C, Pt1Pd3Cu3/Ccatalysts
Sample Species Binding energy (eV) Relative intensity (%)
Pt1Pd1Cu1/C Pt(0) 71.6 37
Pt(II) 72.6 52
Pt(IV) 74.9 11
Pt1Pd2Cu1/C Pt(0) 71.6 46
Pt(II) 72.4 33
Pt(IV) 73.9 21
Pt1Pd5Cu1/C Pt(0) 71.5 42
Pt(II) 72.4 32
Pt(IV) 74.9 26
Pt1Pd4Cu2/C Pt(0) 71.5 50
Pt(II) 72.6 21
Pt(IV) 75.6 29
Pt1Pd3Cu3/C Pt(0) 71.5 39
Pt(II) 72.4 22
[image:7.596.101.496.435.722.2]
Figure 4. Pt 4f spectra of the Pt1Pd1Cu1/C, Pt1Pd2Cu1/C, Pt1Pd5Cu1/C, Pt1Pd4Cu2/C, Pt1Pd3Cu3/C
catalysts
[image:8.596.191.445.72.244.2] [image:8.596.322.575.279.447.2][image:9.596.60.538.341.689.2]
stoichiometric values. Besides, the metallic loadings of the Pt-Pd-Cu/C are close to the stoichiometric value (i. e., 20 wt %).
Figure 5. Pd 3d spectra of the Pt1Pd1Cu1/C, Pt1Pd2Cu1/C, Pt1Pd5Cu1/C, Pt1Pd4Cu2/C, Pt1Pd3Cu3/C
Table 3. Binding energies, and relative intensities of different chemical states of Pd in the Pt1Pd1Cu1/C, Pt1Pd2Cu1/C, Pt1Pd5Cu1/C, Pt1Pd4Cu2/C, Pt1Pd3Cu3/Ccatalysts
Sample Species Binding energy (eV) Relative intensity (%)
Pt1Pd1Cu1/C Pd(0) 335.8 40
Pd(II) 337.6 60
Pt1Pd2Cu1/C Pd(0) 335.8 42
Pd(II) 336.7 58
Pt1Pd5Cu1/C Pd(0) 335.8 39
Pd(II) 336.6 61
Pt1Pd4Cu2/C Pd(0) 335.7 54
Pd(II) 336.6 46
Pt1Pd3Cu3/C Pd(0) 335.8 47
Pd(II) 336.9 53
Table 4. The stoichiometric, real atomic ratios analyzed from XPS in the Pt1Pd1Cu1/C,
Pt1Pd2Cu1/C, Pt1Pd5Cu1/C, Pt1Pd4Cu2/C, Pt1Pd3Cu3/C catalysts
Sample Stoichiometric atomic ratio of Pt to Pd to Cu
Atomic ratio of Pt to Pd to Cu from XPS Pt1Pd1Cu1/C 33: 33: 33 16: 35: 49
Pt1Pd2Cu1/C 25: 50: 25 19: 52: 29
Pt1Pd5Cu1/C 14: 72: 14 9: 65: 26
Pt1Pd4Cu2/C 14: 57: 29 7: 61: 32
[image:10.596.100.496.111.265.2]Pt1Pd3Cu3/C 14: 43: 43 9: 42: 49
Table 5. The stoichiometric, real atomic ratios and real metallic loadings analyzed from ICP -OES in the Pt1Pd1Cu1/C, Pt1Pd2Cu1/C, Pt1Pd5Cu1/C, Pt1Pd4Cu2/C, Pt1Pd3Cu3/C catalysts
Sample Stoichiometric atomic ratio of Pt to Pd to Cu
Atomic ratio of Pt to Pd to Cu from ICP-OES
Metallic loading (wt %)
Pt1Pd1Cu1/C 33: 33: 33 35: 35: 30 16.9
Pt1Pd2Cu1/C 25: 50: 25 28: 52: 20 17.7
Pt1Pd5Cu1/C 14: 72: 14 16: 72: 12 19.0
Pt1Pd4Cu2/C 14: 57: 29 15: 61: 24 18.8
Pt1Pd3Cu3/C 14: 43: 43 17: 50: 33 20.0
3.2. Electrochemical characterization
Figure 6 shows the cyclic voltammograms of the Pt1Pd1Cu1/C, Pt1Pd2Cu1/C, Pt1Pd5Cu1/C,
Pt1Pd4Cu2/C, Pt1Pd3Cu3/Ccatalysts in N2-saturated HClO4 solution. The typical CV characteristics of a
[image:10.596.120.481.335.446.2] [image:10.596.70.525.517.630.2]
Cu/C catalysts. Besides, the Pt-Pd-Cu/C catalysts with different compositions exhibit similar mass-normalized surface oxidation/reduction currents, indicating similar electrochemical surface areas of the five catalysts.
Figure 6. Cyclic voltammograms of the Pt1Pd1Cu1/C, Pt1Pd2Cu1/C, Pt1Pd5Cu1/C, Pt1Pd4Cu2/C,
Pt1Pd3Cu3/C catalysts in N2-saturated 0.5 M HClO4 solution at 25 oC with scan rate of 50
mV/s
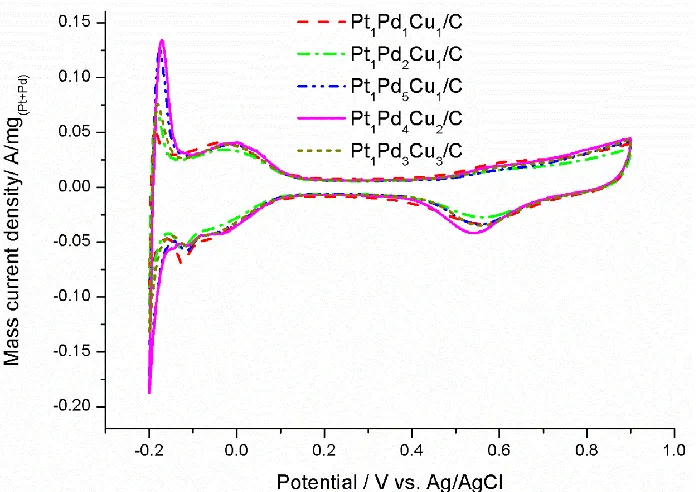
Figure 7 shows the polarization curves of formic acid oxidation on Pt/C, Pd/C, Pt1Pd1Cu1/C,
Pt1Pd2Cu1/C, Pt1Pd5Cu1/C, Pt1Pd4Cu2/C, Pt1Pd3Cu3/C catalysts. The currents were normalized to the
total mass of Pt and Pd on the glassy carbon electrode to give mass current densities. Typical CV feature of formic acid oxidation on Pt, with two anodic peaks in the forward scan and one anodic peak in the backward scan can be observed on the Pt/C catalyst. The mechanism of formic acid oxidation on Pt has been widely studied and it is now accepted that formic acid oxidation on Pt follows a dual-path mechanism, which involves a dehydrogenation pathway to form CO2 directly and a dehydration
pathway with the formation of adsorbed intermediate species (COads). The adsorbed CO species could
occupy the active surface of Pt and thus inhibit formic oxidation reaction on Pt. The COads can be
removed by the aid of adsorbed OHads species formed at high potential range. In the forward scan, the
first oxidation peak at low potential range (i. e., lower than 0.4 V) corresponds to the direct oxidation of formic acid on the unblocked Pt surface and the second oxidation peak at high potential range (i. e., higher than 0.6 V) is related to the oxidation of COads. Removal of the COads releasing fresh Pt surface,
results in the large oxidation peak in the backward scan. The peak current densities of the first and second oxidation peaks in the forward scan are denoted as Ipad and Ipaind respectively. The peak current
[image:11.596.126.474.151.397.2]
Figure 7. a) Cyclic voltammograms of the Pt1Pd1Cu1/C, Pt1Pd2Cu1/C, Pt1Pd5Cu1/C, Pt1Pd4Cu2/C,
Pt1Pd3Cu3/C catalysts in N2-saturated 0.5 M HCOOH + 0.5 M HClO4 at 25 oC with scan
rate of 50 mV/s; b) The forward scan (Figure 7a) of formic acid oxidation on the different catalysts
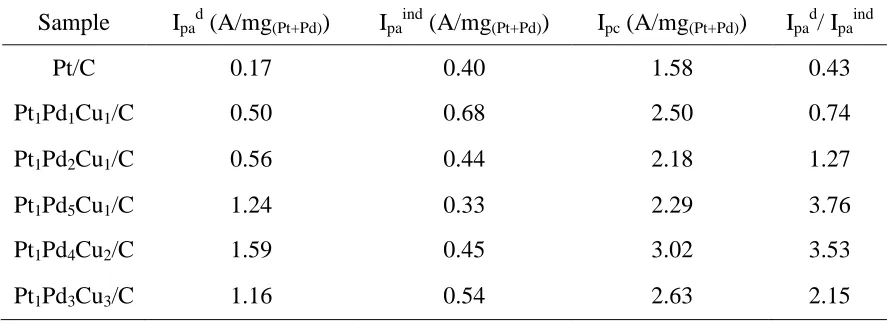
Table 6 shows the values of Ipad, Ipaind and Ipc on all the catalysts containing Pt. It can be seen
that both the peak current densities of the first oxidation peak in the forward scan (Ipad) and the peak
current densities in the backward scan (Ipc) on all the five Pt-Pd-Cu/C catalysts are much higher than
that on Pt/C. Especially, Pt1Pd4Cu2/C exhibits the highest mass current density, with Ipad of 1.59, which
is about 9.4 times that of Pt/C. The ratio of Ipad to Ipaind is considered to be the indication for which
pathway is dominant [31]. From Table 6, it can be seen that the ratios of Ipad to Ipaind on the all the
Pt-Pd-Cu/C catalysts are larger than that on Pt/C. Especially, the ratio of Ipad to Ipaind on Pt1Pd5Cu1/C,
Pt1Pd4Cu2/C are larger than 3, suggesting formic acid oxidation mainly follows the dehydrogenation
pathway with much less COads formation on these two catalysts. It is now accepted that the dehydration
of formic acid to form COads requires at least more than one adjacent Pt atoms [32-34]. The
[image:12.596.161.436.69.463.2]
of the forward scan, the potentials of the first oxidation peak on Pt1Pd5Cu1/C, Pt1Pd4Cu2/C,
Pt1Pd3Cu3/C catalysts are much lower than that on Pd/C. The oxidation current densities on the five
Pt-Pd-Cu/C catalysts in the backward scan are all much larger than that on Pd/C (as shown in Figure 7a), suggesting high activities of the Pt-Pd-Cu/C catalysts compared with Pd/C. Moreover, the mass normalized peak current density on our Pt1Pd4Cu2/C catalyst in the backward scan (i. e., 3.02
A/mg(Pt+Pd)) is higher than the previous reports, such as 0.186 A/mg(Pt) on Pt79Fe21/nitrogen-doped
graphene catalyst (0.5 M H2SO4 + 1 M HCOOH, scan rate of 50 mV/s) [8], about 0.81 A/mg(Pt) on
Pt10Au10Cu80/C catalyst (0.5 M H2SO4 + 0.5 M HCOOH, scan rate of 50 mV/s) [35], about 0.63
A/mg(Pt+Pd) on PtPd/CNTs catalyst (0.5 M H2SO4 + 0.5 M HCOOH, scan rate of 50 mV/s) [36], about
1.1 A/mg(Pt+Pd) on Pt0.5Pd0.5/C catalyst (0.1 M H2SO4 + 0.1 M HCOOH, scan rate of 10 mV/s ) [37],
2.471 A/ mg(Pd) on PdNi/C (0.1 M HClO4 + 0.5 M HCOOH, scan rate of 50 mV/s) [38]. Our results
[image:13.596.76.524.372.534.2]demonstrate the importance of Pt-Pd-Cu/C trimetallic material as formic acid oxidation catalyst.
Table 6. The peak current densities of the first formic acid oxidaiton peak (Ipd), the second formic
acid oxidation peak (Ipind) in the forward scan and the peak current densities in the
backward scan (Ipb) on the Pt/C, Pt1Pd1Cu1/C, Pt1Pd2Cu1/C, Pt1Pd5Cu1/C, Pt1Pd4Cu2/C,
Pt1Pd3Cu3/C catalysts
Sample Ipad (A/mg(Pt+Pd)) Ipaind (A/mg(Pt+Pd)) Ipc (A/mg(Pt+Pd)) Ipad/ Ipaind
Pt/C 0.17 0.40 1.58 0.43
Pt1Pd1Cu1/C 0.50 0.68 2.50 0.74
Pt1Pd2Cu1/C 0.56 0.44 2.18 1.27
Pt1Pd5Cu1/C 1.24 0.33 2.29 3.76
Pt1Pd4Cu2/C 1.59 0.45 3.02 3.53
Pt1Pd3Cu3/C 1.16 0.54 2.63 2.15
4. CONCLUSIONS
ACKNOWLEDGEMENTS
This work is financially supported by the Zhejiang Provincial Natural Science Foundation of China (LQ16B030001), the Project of Interdisciplinary Research in Zhejiang University of Science and Technology (2015JC02Y) and the Project of Key Laboratory of Food Logistics Equipment and Technology of Zhejiang Province (KF2016016zd).
References
1. J. Jiang and A. Kucernak, J. Electroanal. Chem., 520 (2002) 64.
2. Z. Liu, L. Hong, M. Tham, T. Lim and H. Jiang, J. Power Sources, 161 (2006) 831. 3. A. Capon and R. Parsons, J. Electroanal. Chem., 44 (1973) 1.
4. J. Lović, A. Tripković, S. Gojković, K. Popović, D. Tripković, P. Olszewski and A. Kowal, J. Electroanal. Chem., 581 (2005) 294.
5. M. Arenz, V. Stamenkovia, T. Schmidt, K. Wandelt, P. Ross and N. Markovia, Phys. Chem. Chem. Phys., 5 (2003) 4242.
6. W. Jung, J. Han, S. Yoon, S. Nam, T. Lim and S. Hong, J. Power Sources, 196 (2011) 4573.
7. Y. Qin, X. Zhang, X. Dai, H. Sun, Y. Yang, X. Li, Q. Shi, D. Gao, H. Wang, N. Yu and S. Sun, Small, 12 (2016) 524.
8. Y. Sun, T. Zhou, Q. Pan, X. Zhang and J. Guo, RSC Advances, 5 (2015) 60237.
9. B. Zhang, C. He, Y. Jiang, M. Chen, Y. Li, L. Rao, and S. Sun, Electrochem. Commun., 25 (2012) 105.
10. J. Xu, T. Zhao, Z. Liang and L. Zhu, J. Phys. Chem. C, 112 (2008) 17362. 11. B. Habibi and N. Delnavaz, RSC Advances, 2 (2012) 1609.
12. H. Qiu, H. Xu, X. Li, J. Wang and Y. Wang, J. Mater. Chem. A, 3 (2015) 7939.
13. J. Chen, Y. Li, S. Liu, G. Wang, J. Tian, C. Jiang, S. Zhu and R. Wang, Appl. Surf. Sci., 287 (2013) 457.
14. X. Wang and Y. Xia, Electrochem. Commun., 10 (2008) 1644.
15. K. Ding, L. Liu, Y. Cao, X. Yan and H. Wei, Int. J. Hydrogen Energy, 39 (2014) 7326. 16. Z. Bai, L. Yang, J. Zhang, L. Li, J. Lv, C. Hu and J. Zhou, Catal. Commun. 11 (2010) 919. 17. Y. Lu and W. Chen, ACS Catalysis, 2 (2012) 84.
18. W. Wen, C. Li, W. Li and Y. Tian, Electrochim. Acta, 109 (2013) 201.
19. Y. Fan, Y. Zhang, H. Li, W. Shen, J. Wang and M. Wei, RSC Advances, 6 (2016) 43980.
20. S. Lee, N. Jung, J. Cho, H. Park, J. Ryu, I. Jang, H. Kim, E. Cho, Y. Park, H. Ham, J. Jang and S. Yoo, ACS Catalysis, 4 (2014) 2402.
21. J. Lee, D. Kwak, Y. Lee, S. Lee and K. Park, Phys. Chem. Chem. Phys., 17 (2015) 8624. 22. S. Hu, L. Scudiero and S. Ha, Electrochim. Acta, 83 (2012) 354.
23. J. Chen, Y. Li, Z. Gao, G. Wang, J. Tian, C. Jiang, S. Zhu and R. Wang, Electrochem. Commun., 37 (2013) 24.
24. S. Li, D. Cheng, X. Qiu and D. Cao, Electrochim. Acta, 143 (2014) 44.
25. B. Yu, W. Wen, W. Li, Y. Yang, D. Hou and C. Liu, Electrochim. Acta, 196 (2016) 223. 26. G. Fu, B. Xia, R. Ma, Y. Chen, Y. Tang and J. Lee, Nano Energy, 12 (2015) 824. 27. C. Cui, H. Li, H. Cong, S. Yu and F. Tao, Chem. Commun., 48 (2012) 12062. 28. K. Jiang and W. Cai, Appl. Catal. B-Environ., 147 (2014) 185.
29. Y. Suo and I. Hsing, Electrochim. Acta, 56 (2011) 2174.
30. R. Jenkins and R. Snyder, Introduction to X-ray powder diffractometry, John Wiley & Sons, Inc., (1996) New York , USA.
33. M. Neurock, M. Janik and A. Wieckowski, Faraday Discuss., 140 (2008) 363. 34. B. Gralec and A. Lewera, Appl. Catal. B-Environ., 192 (2016) 304.
35. M. Wang, Y. He, R. Li, Z. Ma, Z. Zhang and X. Wang, Electrochim. Acta, 178 (2015) 259. 36. B. Liu, H. Li, L. Die, X. Zhang, Z. Fan and J. Chen. J. Power Sources, 186 (2009) 62.
37. E. Baranova, N. Miles, P. Mercier, Y. Page and B. Patarachao, Electrochim. Acta, 55 (2010) 8182. 38. M. Matin, J. Jang and Y. Kwon, J Power Sources, 262 (2014) 356.