Int. J. Electrochem. Sci., 12 (2017) 1389 – 1400, doi: 10.20964/2017.02.02
International Journal of
ELECTROCHEMICAL
SCIENCE
www.electrochemsci.orgHighly Effective PdCu Electrocatalysts Supported on
Polyelectrolyte Functionalized Titanium Dioxide for Direct
Formic Acid Fuel Cells
Qizhi Dong*, Wenxia Zeng,Hansheng Wan, Shumin Yu, Cancheng Guo*, Meiling Huang
State Key Laboratory of Chemo/Biosensing and Chemometrics, College of Chemistry and Chemical Engineering, Hunan University, Changsha 410082, PR China
*
E-mail: [email protected]
Received: 25 October 2016 / Accepted: 12 December 2016 / Published: 30 December 2016
A highly efficient and CO tolerant PdCu electrocatalysts supported on amino-rich, cationic
poly(diallyl dimethyl ammonium chloride)(PDDA) functionalized TiO2 (PdCu/TiO2(P)-C) has been
developed. The catalysts were characterized by transmission electron microscopy (TEM),X-ray diffraction (XRD),cyclic voltammograms and chronoamperometry. The PtCu particles with average size ∼3.5 nm are well dispersed on TiO2(P). PdCu/TiO2(P)-C catalysts exhibit a superior
electrocatalytic activity and stability for the formic acid oxidation reaction compared with the Pd/TiO2(P)-C . Electrochemical measurements indicate that PdCu/TiO2(P)-C(1:2) catalyst has the best
performance for formic acid electro-catalytic oxidation in terms of durability and Pd-mass activity among three catalysts (Pd1Cu1,Pd1Cu2,Pd1Cu3). The possible reason is that the addition of Cu is
beneficial to lower appropriately the d-band center of Pd and increase the electrochemical active surface area of the PdCu/TiO2(P)-C nanocatalysts, but when the content of Cu rises to a certain extent,
the morphology of the catalyst nanoparticles will transform into linear structure leading to increased particle size.
Keywords: Formic acid fuel cells; PdCu; electrocatalysts; titanium dioxide
1. INTRODUCTION
Direct formic acid fuel cells (DFAFCs) have many advantages, such as fast anode kinetics (similar with hydrogen PEMFCs), easy fuel storage and a higher theoretical voltage. Furthermore, formic acid exhibits low permeability through Nafion® membrane, which allows high concentrations of formic acid (up to 15 M) to be used in fuel cells. For these reasons, DFAFCs have received great attention[1-3].
widely recognized for the electrochemical oxidation of formic acid[6-7]. One path was known as the direct path, which involves the direct oxidation of formic acid to carbon dioxide.
HCOOH→CO2+2H++2e
-HCOOH→COads+H2O→CO2+2H++2e
-while another path relates to an inhibiting intermediate like adsorbed carbon monoxide (COads),
which produced from the dehydration of formic acid (indirect path). The inhibiting intermediate results in severe poisoning of the catalyst. Over Pt/C catalysts, formic acid oxidizes primarily through the indirect pathway. On the other hand, Pd/C catalysts oxidize formic acid mainly through the direct pathway, where the forming of CO intermediate is suppressed. Therefore, researchers generally believe that Pd/C catalyst is the more desirable catalyst for the electrochemical oxidation of formic acid[8]. However, even though the formic acid is mainly oxidized via the direct pathway on the Pd/C catalysts, a small amount of formic acid still can be oxidized via the indirect pathway. Consequently, COads
slowly accumulates over the Pd catalysts,which leads to the poor long-term stability of the catalysts[9]. In addition, Pd is a noble metal and very expensive. So, it is necessary to improve its overall electrochemical performance and develop less expensive Pd-based catalysts.
In order to further improve the electrocatalytic performance of the Pd catalysts, the Pd-based bimetallic and trimetallic catalysts have been investigated, such as PdNi[10], PdCo[11], PdFe[12], PdCuIr[13], PdCoIr[14] and PdNiCu[15]. Bimetallic and trimetallic catalysts usually show better performance than monometallic catalysts because the addition of the second element usually decreases the Pd d-band center ,which results in the weakening of the adsorption of reaction intermediates[16-17].
It is well known that support exerts an important impact on the performance of fuel cell catalyst[18]. Carbon black is generally used to support noble metal in catalyst. Nevertheless, carbon materials are corroded easily in the environment of fuel cell, which will lead to the aggregation of Pd nanoparticles and result in the deterioration of catalyst performance[19]. Many researchers use non-carbon materials as catalyst support to solve this problem. For example, TiN[20], WOX[21], WC[22]
and SiO2[23]. In our previous research, we also found that the use of TiO2 as a catalyst support
improves the activity and stability of the catalyst[24]. Recently, we developed a strategy to prepare highly dispersed Pd nanoparticles supported on TiO2 modified by poly(diallyl dimethyl ammonium
chloride)(PDDA),where PDDA employed as effective functional agents for the self-assembly of PdCl42- and in situ deposition on the surface of TiO2[25].
Based on our previous researches, PdCu/TiO2(P)-C catalysts with different mass ratios of Pd
and Cu are prepared in this paper by the self-assembly between the positively charged PDDA、 negatively charged Pd and the positively charged Cu precursor, and then in situ deposition on the surface of TiO2 modified by PDDA, aiming to have a less expensive electro-catalyst in the DFAFC.
2. EXPERIMENTAL SECTION
Materials used in this research,such as sulfuric acid (H2SO4), and hydrochloric acid (HCl),
formic acid (HCOOH),palladium chloride (PdCl2), Copper sulfate pentahydrate (CuSO4·5H2O),
sodium borohydride (NaBH4),trisodium citrate (Na3C6H5O7·2H2O),were purchased from Sinopharm
Chemical Reagent Co., Ltd. All reagents, unless stated otherwise, were of analytical reagent grade and can be used directly.Anatase-TiO2 (particle size =15~20 nm) and poly (diallyl dimethyl ammonium
chloride) (PDDA, average MW:100,000~200,000) were obtained from Aladdin Industrial Corporation. VXC-72 carbon black (SBET = 240 m2·g1) was purchased from Cabot and then refluxed in 5M HNO3.
Water used was always deionized water.
2.1. Catalysts preparation
For the catalyst preparation, TiO2 firstly treated by PDDA. The process of non-covalent
functionalization of TiO2 with PDDA can be described as follows. Firstly, 200 mL of 0.5 wt.% PDDA
aqueous solution was prepared, which acted as the functionalization polyelectrolyte. After that, 1 g of pristine TiO2 was dispersed in it and keep the solution in ultrasonic treatment for 1 h. Then, 4 g NaCl
was added into the above solution and being stirred for overnight. The Addition of NaCl is for increasing the ionic strength of solution and the attractive force between PDDA and the TiO2 surface,
thus resulting in higher functionalization degree on TiO2. Finally, the solution was filtrated and washed
[image:3.596.149.452.468.660.2]using deionized water for many times to move away the redundant PDDA. Than the material retained on the filter was dried at 80℃for 10 h in vacuum to obtain TiO2(P).
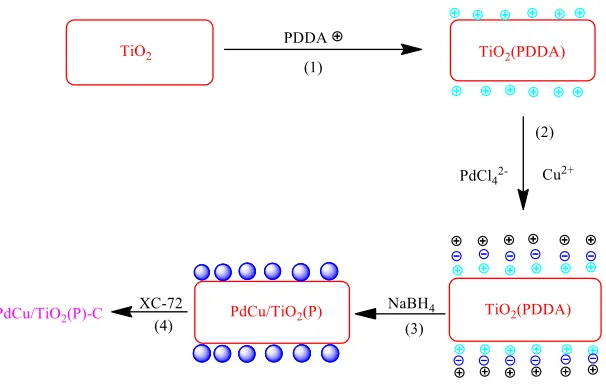
Figure 1. The preparation process of PdCu/TiO2 (P)-C
Weigh a certain amount of TiO2(P) and Na3C6H5O7·2H2O, and dispersed in water. Then, a
stoichiometric amount of H2PdCl4 solution (PdCl2 dissolved in 0.1 M HCl) and CuSO4 aqueous
amounts of 0.01 M freshly prepared NaBH4 under ice-water conditions. After that, the carbon slurry
was added into the above mixture, which was still stirred continually. After 10 min of stirring, the mixture was filtered and then washed with deionized water for many times, which is in order to completely ensure all excess reducing agents were completely removed. Finally, the remained solids were dried in vacuum for 12 h at 80℃. PdCu/TiO2(P)-C catalysts with different mass ratios of Pd and
Cu denoted as PdCu/TiO2(P)-C(1:1)、PdCu/TiO2(P)-C(1:2)、PdCu/TiO2(P)-C(1:3) and Pd/TiO2(P)-C
were prepared by the above method and the metal content of all four catalysts theoretically was 20% . The preparation process is demonstrated in figure.1.
2.2 Characterization of catalysts
TEM micrographs of all catalysts were taken on JEM-3010 transmission electron microscope, which operated under the condition of 0.17 nm spatial resolution and 300 kV voltage. Firstly, the catalysts were ground into fine particles, and then well dispersed in alcohol for ultrasonic treatment. After that, a drop of the dispersion was transferred onto a standard carbon-film-coated copper grid to take electron micrographs.
XRD patterns of all researched catalysts were obtained by the SHIMADZU (XRD-6100) diffractometer with Cu K irradiation at 40 kV and 30 mA. The angular resolution (2θ) of the diffractometer was 0.05° and the scan rate was 4 º·min1.
2.3 Electrode preparation and measurement
Glassy carbon electrode with 5 mm of diameter was used as the underlying substrate of the working electrode. Before using in each experiment, this glassy carbon electrode was polished successively with 0.3 μm and 0.05 μm alumina slurry to have the high mirror finish. The catalysts were loaded onto the underlying substrate as follows. The dilute suspension of catalysts was fully dispersed under the condition of ultrasonic vibration, after that 10 μL of the dispersed catalyst suspension was dropped onto the surface of polished glassy carbon electrode. After electrode dried, 10 μL of Nafion, which was 5 wt.% dilute solution mixed Nafion with ultrapure water and lower aliphatic alcohols, was dropped onto the electrode surface.
All electrochemical measurements were conducted using the Ingsens 3040 electrochemical workstation, which linked with an SAMSUNG PC, in a conventional three-electrode system at 25℃. In this experiment, the Pt net (1 cm2) was used as the counter electrode. Saturated calomel electrode (SCE) selected as reference electrode in this work. Prior to each measurement, ultrapure argon was kept bubbling into the 0.5 M H2SO4 with or without 0.5 M HCOOH for 20 min as the electrolyte
3. RESULTS AND DISCUSSION
10 20 30 40 50 60 70 80
intensity/a.u.
2θ/degree
Pd/TiO2(P)-C
PdCu/TiO2(P)-C(1:1)
PdCu/TiO2(P)-C(1:2)
PdCu/TiO
2(P)-C(1:3)
a b c d
Pd(111) Pd(200)
Pd(220)
Figure 2. XRD patterns of (a) Pd/TiO2 (P)-C, (b) PdCu/TiO2(P)-C(1:1),(c) PdCu/TiO2(P)-C(1:2), (d)
PdCu/TiO2(P)-C(1:3).
Fig. 2 shows the XRD patterns of the Pd/TiO2(P)-C and PdCu/TiO2(P)-C catalysts with
different mass ratios of Pd and Cu. It was observed from Fig. 2a that the three diffraction peaks at 39.8, 44.9 and 67.9°(2θ) from NP-Pd can be assigned to the (111), (200), and (220) diffractions for a face-centered cubic (fcc) pure Pd respectively (JCPDS standard 05-0681 (Pd))[26]. It should be noticed three kinds of PdCu/TiO2(P)-C only show the peak of plane (111)and(200), and the peak of Pd (220)
was not observed because the strength is too weak. For each of three PdCu/TiO2(P)-C catalysts, (111)
and (200) diffraction peaks were located between the values of pure Pd and Cu, which indicated that face-centered cubic PdCu alloy structure has formed[27]. The (111) and (200) diffraction peaks of three PdCu/TiO2(P)-C catalysts shift to higher angles with an increase in Cu content compared with the
Pd/TiO2(P)-C catalyst. This result presents that the lattice parameter of PdCu alloy becomes smaller
[image:5.596.183.407.109.282.2] [image:5.596.130.466.565.734.2]
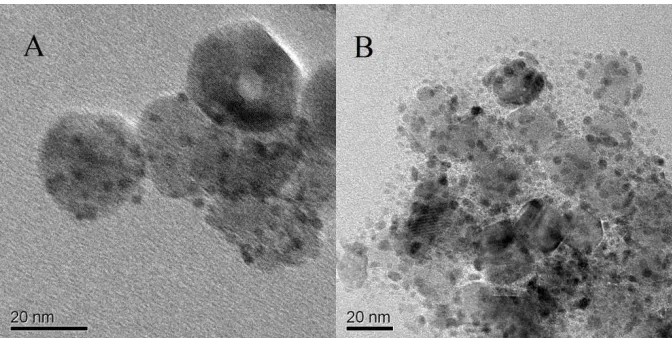
Figure 3. TEM images of (A) Pd/TiO2(P)-C,(B) PdCu/TiO2(P)-C(1:1),(C) PdCu/TiO2(P)-C (1:2),(D,E)
PdCu/TiO2(P)-C(1:3) and HRTEM image of the PdCu/TiO2(P)-C(1:1).
Fig. 3 shows TEM images of all four catalysts and HRTEM of PdCu/TiO2(P)-C(1:1). It was
observed from Fig. 3 that the spherical particles of catalysts possess good dispersion and uniformity. Meanwhile, we also observed a small amount of linear structure in TEM Figure 3(E), which did not appear in other two bimetallic catalysts. Therefore, we hypothesized that using this method of catalyst preparation in the project, the morphology of the catalyst nano-particles will transform into linear structure when the content of Cu rises to a certain extent.
1.0 1.5 2.0 2.5 3.0 3.5 4.0 4.5
0 5 10 15 20 25 30
Count
/%
Particle size/nm
Pd/TiO2(P)-C
1.5 2.0 2.5 3.0 3.5 4.0 4.5 5.0 5.5
0 5 10 15 20 25 30
Count/%
Particle size/nm
[image:6.596.298.490.596.729.2]
2.0 2.5 3.0 3.5 4.0 4.5 5.0 5.5
0 5 10 15 20 25 30
Count/%
Particle size/nm
PdCu/TiO2(P)-C(1:2)
2.0 2.5 3.0 3.5 4.0 4.5 5.0 5.5
0 5 10 15 20 25 30
Count/%
Particle size/nm
PdCu/TiO2(P)-C(1:3)
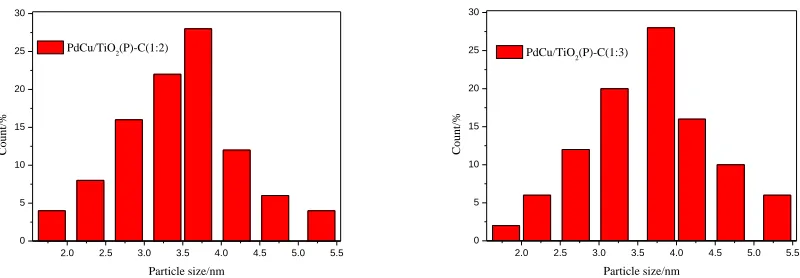
Figure 4. Particle size distribution histograms of Pd NPs in Pd/TiO2 (P)-C, PdCu/TiO2(P)-C(1:1),
PdCu/TiO2(P)-C(1:2), PdCu/TiO2(P)-C(1:3).
Fig. 3(F) provides a high-resolution TEM (HRTEM) image of PdCu/TiO2(P)-C(1:1).The
continuous ordered lattice fringes have been seen clearly in Fig.3(F) and the lattice spacing is calculated to be 0.218 nm, which corresponded to the distance of the (111) crystal planes of fcc Pd50Cu50 alloy[28]. The results of TEM measurement indicated that PdCu alloy structure has formed,
which is consistent with the result of XRD patterns.
Fig. 4 provides the corresponding particle size distribution histograms of all four catalysts. According to size distribution histograms, the average sizes of PdCu particles in PdCu/TiO2
(P)-C(1:1)、PdCu/TiO2(P)-C(1:2)、PdCu/TiO2(P)-C(1:3) catalysts are 3.2,3.5,3.7 nm respectively. The
average size of the Pd particles in the Pd/TiO2(P)-C catalyst is 3.0 nm. This result can be explained by
that when the content of Cu rises to a certain extent, the morphology of the catalysts will transform into linear structure, thus resulting the increase in the average particle size.
-0.2 0.0 0.2 0.4 0.6 0.8 1.0
-0.15 -0.10 -0.05 0.00 0.05 0.10
I
/Amg
-1 Pd
E/V(vs.SCE)
Pd/TiO2(P)-C
PdCu/TiO2(P)-C(1:1)
PdCu/TiO2(P)-C(1:2)
[image:7.596.95.495.84.223.2]PdCu/TiO2(P)-C(1:3)
Figure 5. CV curves of Pd/TiO2(P)-C, PdCu/TiO2(P)-C(1:1), PdCu/TiO2(P)-C(1:2) and PdCu/TiO2
[image:7.596.143.418.498.693.2]
The cyclic voltammetry (CV) of Pd/TiO2(P)-C, PdCu/TiO2(P)-C(1:1), PdCu/TiO2(P)-C(1:2)
and PdCu/TiO2(P)-C(1:3) in 0.5 M H2SO4 are shown in Fig.5. It should be noted that all the
electrochemical results shown in this article are after 20 cycles in 0.5 M H2SO4 to remove exposed Cu
and only leave Pd on the surface. On the one hand, this is done for the purpose of removing impurities on the surface of catalyst and activating the catalyst. On the other hand, it is in order to dissolve Cu on the catalyst surface( known as de-alloy)and form rough surface so that more Pd atoms exposed to the solution, thereby improving the utilization of precious metals[29]. In Fig.5, all catalysts exhibit similar behaviors and we can clearly see the hydrogen adsorption/desorption peaks at -0.200V, the PdOx reduction peaks at 0.350.55V by reverse scan and the peak of PdOx formation at higher potentials by forward scan [30]. The absence of Cu oxidation peaks indicates that all the exposed Cu atoms were removed during the CV cycles. In our previous study, the intensity of hydrogen adsorption/desorption peaks in cyclic voltammogram of Pd catalysts in 0.5 M H2SO4 and the strength of PdOx reduction peak
presented proportional relationship. In other word, greater the intensity of PdOx reduction peak show,
bigger the intensity of hydrogen adsorption/desorption peaks is[24]. However, in Figure 5, we found three alloy catalysts do not comply with the above rule. The reason may be the different patterns of hydrogen adsorption on the surface of single metal Pd and alloy catalysts. Hydrogen adsorption on Pt metal surface generally is monolayer adsorption, so we can calculate the electrochemical surface area of Pt by hydrogen adsorption/desorption peak areas. The hydrogen adsorption on Pd surface is more complex and not the monolayer adsorption. Therefore, hydrogen adsorption/desorption peak areas could not be used to calculate the electrochemical surface area of Pd. The cyclic voltammetry curves of PdCu alloy catalyst in 0.5 M H2SO4 differ from Pd catalyst can be attributed to the change in the
Adsorption pattern of hydrogen due to the interaction between Pd and Cu.
-0.2 0.0 0.2 0.4 0.6 0.8 1.0
0.0 0.2 0.4 0.6 0.8 1.0 1.2 1.4 1.6 1.8 2.0
I
/Amg
-1 Pd
E/V(vs.SCE)
Pd/TiO2(P)-C
PdCu/TiO2(P)-C(1:1)
PdCu/TiO2(P)-C(1:2)
PdCu/TiO2(P)-C(1:3)
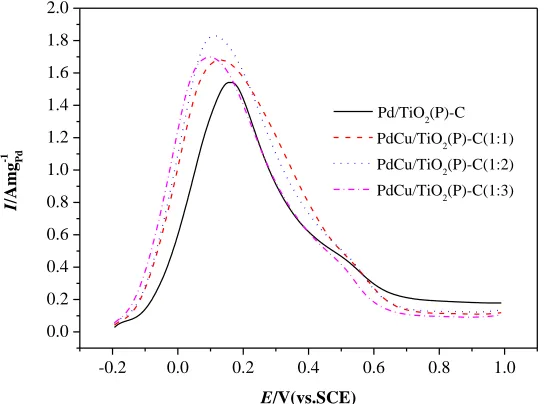
Figure 6. CV curves of formic acid electrooxidation on Pd/TiO2(P)-C, PdCu/TiO2(P)-C(1:1),
PdCu/TiO2(P)-C(1:2) and PdCu/TiO2(P)-C(1:3) catalysts in a solution of 0.5M H2SO4+0.5M
[image:8.596.150.423.468.670.2]
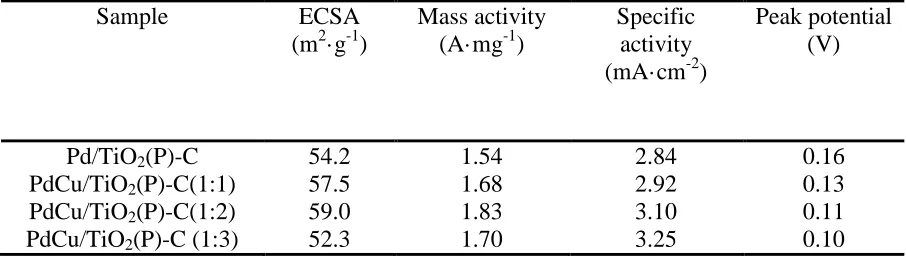
We calculated the electrochemical surface area(ECSA )of catalysts by the charge consumed in PdOx reduction during the cathodic scan. the charge consumed in monolayer oxide reduction was assumed to be 0.424 mC·cm2.This method is widely accepted in the literature.All these calculated ECSA values are summarized in Table 1. ECSAs of Pd/TiO2(P)-C, PdCu/TiO2(P)-C(1:1),
PdCu/TiO2(P)-C(1:2) and PdCu/TiO2(P)-C(1:3) are 54.2、57.5、59.0、52.3 m2·g-1。With the content
increase of Cu, ECSA first increases, and then decreases. The reason for the increase may be due to that the surface of Pd was more exposed after de-alloying. When the Cu content increases to a certain extent, the morphology of the alloy is changed and the particles begin to gather into linear structure, causing the reduced ECSA.
The activities for the Pd/TiO2(P)-C, PdCu/TiO2(P)-C(1:1), PdCu/TiO2(P)-C(1:2) and
PdCu/TiO2(P)-C(1:3) toward the formic acid electrochemical oxidation are measured by cyclic
voltammetry tests in 0.5 M H2SO4 with 0.5 M formic acid (Fig. 6). The peak current densities in the
forward scan for Pd/TiO2(P)-C, PdCu/TiO2(P)-C(1:1), PdCu/TiO2(P)-C(1:2) and PdCu/TiO2(P)-C(1:3)
are 1.54, 1.68, 1.83 and 1.70 A·mg1 respectively. The peak potential of formic acid oxidation on Pd/TiO2(P)-C, PdCu/TiO2(P)-C(1:1), PdCu/TiO2(P)-C(1:2) and PdCu/TiO2(P)-C(1:3) are
0.16,0.13,0.11,0.10,respectively. With the content increase of Cu, The peak current densities first increases, and then decreases. This may be mainly due to the decreases of ECSA of PdCu/TiO2(P)-C
(1:3). The peak potentials of formic acid oxidation on PdCu/TiO2(P)-C were shifted negatively
compared with that of Pd/TiO2(P)-C, which demonstrates that HCOOH is more susceptible to
oxidization on the surface of PdCu/TiO2(P)-C.
Table 1 also lists the specific activities of all catalysts. Specific activity of catalysts is very important parameter, which can evaluate its catalytic activity. The specific activities of Pd/TiO2(P)-C,
PdCu/TiO2(P)-C(1:1), PdCu/TiO2(P)-C(1:2) and PdCu/TiO2(P)-C(1:3) are 2.84, 2.92, 3.10, 3.25
mA·cm-2, respectively. The specific activities increase with the content increase of Cu. Since the adsorption of CO on Pd in alloy catalyats weakened, more reactive sites release, thereby enhancing the specific activities. When the Cu content is higher, this effect will be greater[31,32].
Table 1. Summary of the electrochemical data of Pd/TiO2(P)-C, PdCu/TiO2(P)-C(1:1), PdCu/TiO2(P)-C(1:2), PdCu/TiO2(P)-C (1:3) composite catalysts (derived from fig.5 and 6).
Sample ECSA
(m2·g-1)
Mass activity (A·mg-1)
Specific activity (mA·cm-2)
Peak potential (V)
Pd/TiO2(P)-C
PdCu/TiO2(P)-C(1:1)
PdCu/TiO2(P)-C(1:2)
PdCu/TiO2(P)-C (1:3)
[image:9.596.72.525.582.710.2]
0 500 1000 1500 2000 2500 3000 3500 4000 0.2
0.4 0.6 0.8 1.0 1.2 1.4 1.6
I
/Amg
-1 Pd
T/s
Pd/TiO2(P)-C
[image:10.596.151.426.93.295.2]PdCu/TiO2(P)-C(1:1) PdCu/TiO2(P)-C(1:2) PdCu/TiO2(P)-C(1:3)
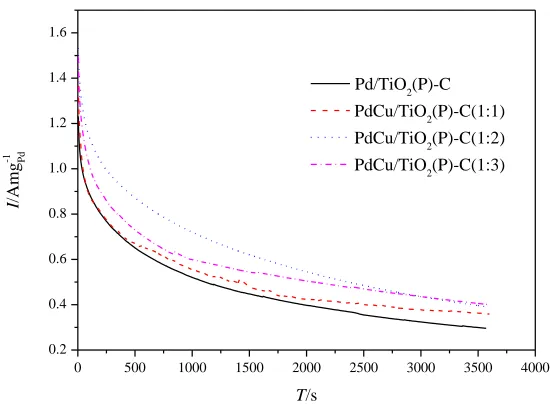
Figure 7. The i–t curves of formic acid electro-oxidation on the Pd/TiO2(P)-C, PdCu/TiO2(P)-C(1:1),
PdCu/TiO2(P)-C(1:2) and PdCu/TiO2(P)-C(1:3) catalysts at 0.1V in a solution of 0.5 M
H2SO4+0.5 M HCOOH
To further compare the performance and stability of the Pd/TiO2(P)-C, PdCu/TiO2(P)-C(1:1),
PdCu/TiO2(P)-C(1:2) and PdCu/TiO2(P)-C(1:3), chronoamperometry measurements were carried out
in the solution of 0.5 M H2SO4 and 0.5 M HCOOH at 0.1 V for 3600s (see Figure 7). The current
densities of formic acid electro-oxidation on the four catalysts change in the similar way, which is declining sharply and then remaining relatively stable. Wherein, the declining tendency reflects catalyst poisoning, which caused by COads adsorbed on the surface of Pd[33].The current densitys of three PdCu/TiO2(P)-C catalysts are greater than that of Pd/TiO2(P)-C throughout 3600s, which
revealed that three PdCu/TiO2(P)-C catalysts have superior CO-tolerance ability. After an hour of
testing, the current density of Pd/TiO2(P)-C, PdCu/TiO2(P)-C(1:1), PdCu /TiO2(P)-C(1:2) and
PdCu/TiO2(P)-C(1:3) remain 22.06, 22.78, 23.53, 24.22 % of the initial. This result suggests that
stability of three PdCu alloy catalysts is higher than a single metal Pd, the reason may be that the adsorption of CO on Pd in alloy catalyats weakened.
4. CONCLUSION
Pd/TiO2(P)-C, PdCu/TiO2(P)-C with different mass ratio of Pd and Cu are successfully
synthesized by the self-assembly and then in situ deposition on the surface of TiO2 modified by
PDDA. TEM micrographs showed that Pd and PdCu nanoparticles were uniformly dispersed on the surface of TiO2. when the content of Cu rises to a certain extent, the morphology of the catalyst
different ratios of PdCu on catalyst activity was also discussed in this research. Taken all together, PdCu/TiO2(P)-C(1:2) catalyst presents the best catalytic activity and stability for the formic acid
electro-oxidation.
ACKNOWLEDGEMENTS
This research was supported by the National undergraduate training programs for innovation (201510532035) and the Hunan Provincial Natural Science Foundation of China (13JJ5018)
References
1. Y. Hung, K. M. El-Khatib and H. Tawfik, Journal of Power Sources, 163 (2006) 509.
2. L. Zhang, L. Wan, Y. R. Ma, Y. Chen, Y. M. Zhou,Y. W. Tang and T. H. Lu, Applied Catalysis B: Environmental, 138 (2013) 229.
3. Y. Liang, M. N. Zhu, J. Ma, Y. W. Tang, Y. Chen and T. H. Lu, Electrochimica Acta, 2011, 56 (2011) 4696.
4. B. J. Kim, K. Kwon, C. K. Rhee, J. Han and T. H. Lim, Electrochimica Acta, 53 (2008) 7744. 5. L. Lu, L. P. Shen, Y. Shi, T. T. Chen, G. Q. Jiang, C. W. Ge, Y. W. Tang, Y. Chen and T. H. Lu,
Electrochimica Acta, 85 (2012) 187.
6. R. Parsons and T. VanderNoot, Journal of electroanalytical chemistry and interfacial electrochemistry, 257 (1988) 9.
7. S. Ha, R. Larsen, Y. Zhu and R. I. Masel, Fuel Cells, 4 (2004) 337.
8. B. Y. Yu, W. J. Wen, W. P. Li, Y. Yang, D. D. Hou and C. S. Liu, Electrochimica Acta, 196 (2016) 223.
9. S. J. Li, D. J. Cheng, X. G. Qiu and D. P. Cao, Electrochimica Acta, 143 (2014) 44. 10.R. S. Li, Z. Wei, T. Huang and A. S. Yu, Electrochimica Acta, 56 (2011) 6860.
11.D. Morales-Acosta, J. Ledesma-Garcia, L. A. Godinez, H. G. Rodriguez, L. Álvarez-Contreras and L. G. Arriaga, Journal of Power Sources, 195 (2010) 461.
12.M. A. Matin, J. H. Jang, and Y. U. Kwon, Journal of Power Sources, 262 (2014) 356.
13.J. W. Chen, J. Zhang, Y. W. Jiang, Y. Liu, J. Zhong G. Wang and R. L. Wang, Applied Surface Science, 357 (2015) 994.
14.R. F. Wang, S. J. Liao and S. Ji, Journal of Power Sources, 180 (2008) 205.
15.S. Z. Hu, F. Munoz, J. Noborikawa, J. Haan, L. Scudiero and S. Ha, Applied Catalysis B: Environmental, 180 (2016) 758.
16.L. P. Shen, H. Z. Li, L. Lu, Y. F. Luo, Y. W. Tang,Y. Chen and T. H. Lu, Electrochimica Acta, 89 (2013) 497.
17.X. Y. Lu, F. Luo, H. Y. Song, S. J. Liao and H. L. Li, Journal of Power Sources, 246 (2014) 659. 18.J. Cao, Q. Wang and H. J. Dai, Nature materials, 4 (2005) 745.
19.Y. J. Wang, D. P. Wilkinson and J. J. Zhang, Chemical reviews, 111 (2011) 7625. 20.M.M. Ottakam Thotiyl, S.Sampath , Electrochimica Acta, 56 (2015) 3549.
21.P. J. Kulesza, L. R. Faulkner, Journal of electroanalytical chemistry and interfacial electrochemistry, 259 (1989) 81.
22.R. B. Levy, M. Boudart, Science, 181 (1973) 547.
23.B. Seger, A. Kongkanand, K. Vinodgopal and P. V. Kamat, Journal of Electroanalytical Chemistry, 621 (2008) 198.
24.H. S. Wan, Q. Z. Dong, G. M. Zhu, G. Yu, T. W. Yin and M. L. Huang, International Journal of Hydrogen Energy, 40 (2015) 14179.
(2016) 804.
26.W. L. Qu, Z. B. Wang, X. L. Sui, D. M. Gu and G. P. Yin, International journal of hydrogen energy, 37 (2012) 15096.
27.C. X. Xu, Y. Q. Liu, J. P. Wang, H. R. Geng and H. J. Qiu, Journal of Power Sources, 199 (2012) 124.
28.C. X. Xu, A. H. Liu, H. J. Qiu and Y. Q. Liu, Electrochemistry Communications, 13 (2011) 766. 29.L. Dai, S. Z. Zou, Journal of Power Sources, 196(2011) 9369.
30.M. Chen, Z. B. Wang, K. Zhou and Y. Y. Chu, Fuel Cells, 10 (2010) 1171.
31.L. Wang, J. J Zhai, K. Jiang, J. Q. Wang and W. B. Cai, International Journal of Hydrogen Energy, 40 (2015) 1726.
32.L. Lu, L. P. Shen, Y. Shi, T. T. Chen, G. Q. Jiang, C. W. Ge, Y. W. Tang, Y. Chen and T. H. Lu, Electrochimica Acta, 85 (2012) 187.
33.F. C. Zhu, G. S. Ma, Z. C. Bai, R. Q. Huang, B. Tang, Z. H. Zhang and X. G. Wang, Journal of Power Sources, 242 (2013) 610.