This is a repository copy of
A Review of Generic Preference-Based Measures for Use in
Cost-Effectiveness Models
.
White Rose Research Online URL for this paper:
http://eprints.whiterose.ac.uk/118043/
Version: Accepted Version
Article:
Brazier, J., Ara, R., Rowen, D.L. orcid.org/0000-0003-3018-5109 et al. (1 more author)
(2017) A Review of Generic Preference-Based Measures for Use in Cost-Effectiveness
Models. PharmacoEconomics, 35 (Suppl 1). pp. 21-31. ISSN 1170-7690
https://doi.org/10.1007/s40273-017-0545-x
The final publication is available at Springer via
http://dx.doi.org/10.1007/s40273-017-0545-x
[email protected] https://eprints.whiterose.ac.uk/ Reuse
Items deposited in White Rose Research Online are protected by copyright, with all rights reserved unless indicated otherwise. They may be downloaded and/or printed for private study, or other acts as permitted by national copyright laws. The publisher or other rights holders may allow further reproduction and re-use of the full text version. This is indicated by the licence information on the White Rose Research Online record for the item.
Takedown
If you consider content in White Rose Research Online to be in breach of UK law, please notify us by
1
A REVIEW OF GENERIC PREFERENCE-BASED MEASURES FOR USE IN COST-EFFECTIVENESS MODELS
Running header: Generic preference-based measures
John Brazier, PhD1; Roberta Ara, MSc1; Donna Rowen, PhD1; Helene Chevrou-Severac, PhD2,
1
University of Sheffield
School of Health and Related Research (ScHARR) Regent Court
Regent Street Sheffield UK
2
Takeda Pharmaceuticals International AG
Thurgauerstrasse 130 8152 Glattpark-Opfikon Switzerland
2
ABSTRACTGeneric preference-based measures (GPBMs) of health are used to obtain the quality adjustment weight required to calculate the quality adjusted life year (QALY) in health economic models. GPBMs have been developed to use across different interventions and medical conditions and
typically consist of a self-complete patient questionnaire, a health state classification system, and preference weights for all states defined by the classification system.
Of the six main GPBMs, the three most frequently used are: the HUI3, the EQ-5D (3 and 5 level), and
the SF-6D. There are considerable differences in GPBMs in terms of the content and size of descriptive system (i.e. the numbers of dimensions of health and levels of severity within these), the methods of valuation (e.g. time-trade off (TT0), standard gamble (SG)) and the populations (e.g. general population, patients) used to value the health states within the descriptive system. Although GPBM are anchored at one (full health) and zero (dead) they produce different health state
utility values (HSUV) when completed by the same patient.
Considerations when selecting a measure for use in a clinical trial include practicality, reliability, validity and responsiveness. Requirements of reimbursement agencies may impose additional restriction on suitable measures for use in economic evaluations such as the valuation technique
(TTO, SG) or the source of values (general public versus patients).
KEY POINTS FOR DECISION MAKERS
A generic preference-based measure (GPBM) is a measure of health related quality of life
that has a set of preference weights that enable a health state utility value (HSUV) to be generated for each completion of the measure.
Despite being anchored on the same zero (for dead) to one scale (full health), GPBMs
generate different HSUVs for the same patient and these differences have important implications for incremental cost-effectiveness ratios.
The selection of a GPBM for any given study should be based on: a) the psychometric
3
1. A REVIEW OF GENERIC PREFERENCE-BASED MEASURES
Increasingly reimbursement agencies require health care products to be evaluated in terms of their cost-effectiveness, where effectiveness is measured in terms of the quality adjusted life year (QALY). The purpose of health utility measurement is to provide the quality adjustment weight, in order to calculate the QALY in health economics. Generic preference-based measures (GPBMs) of health
(also known as multi-attribute utility scales) are commonly used methods for obtaining this weight known as a health state utility value (HSUV).
2. What is a generic preference-based measure of health?
GPBMs -complete patient standardized
questionnaire (i.e. a generic multi-attribute utility instrument), a health state classification system (i.e. descriptive system), and preference weights for all states defined by the classification system. In practice, each patient (or their proxy) completes the questionnaire and their responses are used to assign them to a unique health state from the health state classification system. The utility score
for the unique health state is then obtained using an existing tariff or value set of preference weights.
GPBMs have been developed to be comparable across different interventions and medical conditions. They are accepted by many different agencies around the world concerned with
assessing the cost-effectiveness of health care including the National Institute for Health and Care Excellence (NICE) and others [1]. The self-complete questionnaires used to collect health state data can be easily included in clinical trials or routine data collection systems with little respondent burden, and the existing scoring algorithms are quickly and easily used to generate the health state
utility values.
3. Description of the generic preference-based measures
3.1 Generic multi-attribute utility measures overview
The number of GPBMs has proliferated over the last two decades. These include the Quality of
Well-being self-administered (QWB-SA) scale [2], the Health Utilities Index version 3 (HUI3) [3], the EQ-5D (3 and 5 level) [4,5], the Short Form 6 dimension (SF-6D) [6,7] and the Assessment of Quality of Life 8 dimension (AQOL-8D) [8]. Whilst these measures all claim to be generic, in other words they can be used in any (adult) patient population across a range of health issues; they differ considerably in
4
summary of the main characteristics of these six measures is presented in Table 1 and Table 2 (see [9] for further details).
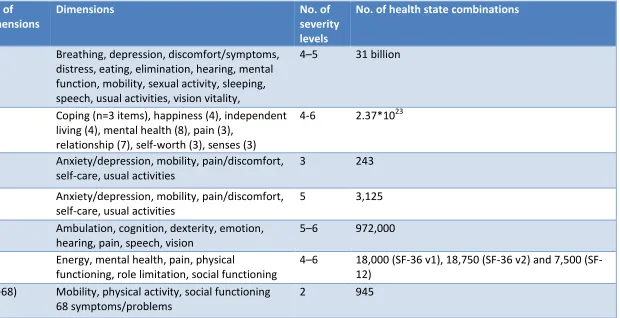
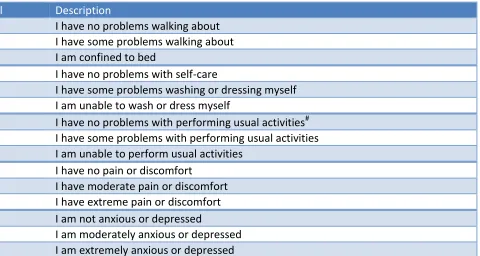
Table 1 summarises the descriptive content of these measures including their dimensions and severity levels. The original EQ-5D with 3 levels (i.e. EQ-5D-3L) has the smallest classification system,
defining 243 states and the self-complete EQ-5D-3L questionnaire is reproduced in full in Table 3. Recently a new 5-level version of the EQ-5D has been published which covers the same dimensions but now generates 3,125 states. The largest system is the AQOL-8D with 2.37*1023 states. A review of articles published on Web of Science (2004-2010) reported that the most widely used
multi-attribute utility (MAU) instrument by far is the EQ-5D, with 63.2% of studies employing a GPBM using it, followed by HUI3 (9.8%) and then SF-6D (8.8%) [10]. T NICE preference for EQ-5D ([11] and later replaced by [12]).
The responses given by the patient to the MAU instrument define their health state within the
A
across all items within the instrument thus in theory, a p EQ-5D-3L. A hypothetical patient with impairments in mobility (level 2) and in pain/discomfort (level 2) (but no impairment in the other items) would likely report a health
EQ-5D-3L.
3.2 Valuation methods
The objective of valuing the health states is to provide preference weights for all states defined within the classification system. The resulting set of preference weights enables a HSUV to be
generated T
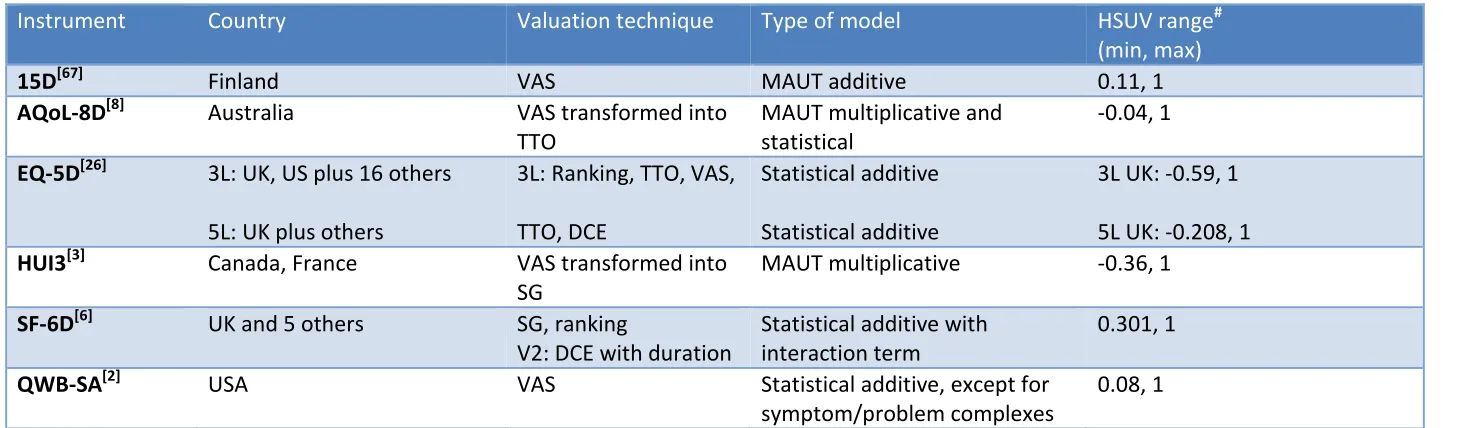
that can be used to obtain the preference weights and Table 2 summarises the valuation methods used in terms of the valuation technique and the method of modelling the valuation data. The two main techniques of valuation have been time trade-off (TTO), where respondents are asked to trade life years in the ill health state for a better health state in full health, and standard gamble (SG)
where respondents are asked the risk of death they are willing to take in order to be in full health (for further details see [9]). More recently, researchers have been using discrete choice experiments (DCE) to value health states [13-18], but DCE alone has not been used to provide the official tariff for any GPBM though it has been used as a hybrid model with TTO for the recent UK
5
For all instruments a selected subset of health state combinations has been valued by a representative sample of the public and then a scoring algorithm has been obtained to estimate values for the remaining combinations. The scoring algorithm is estimated from the health states that have been valued. The main method has been to use statistical regression based approaches, where the value of a health state is assumed to be a function of that state; hence, by estimating a
relationship between the descriptive system and the observed values we can infer values for all states. Most models have been additive, which means they assume no interactions between dimensions. Any model specification should deal with the skewed and truncated nature of the distribution of health state values, and the fact that the data are likely to be clustered by
respondents [20]. Estimation has mainly used generalised least squares (GLS) or maximum likelihood estimate (MLE) [9], though more recently alternative techniques for analysing preference data have been explored including: Bayesian non-parametric (e.g. SF-6D, [21], semi-parametric approaches [22] and a hybrid approach that combines cardinal preference data with the results of paired data from a discrete choice experiment (e.g. EQ-5D-5L) [19,23]. The statistical validity of
models for estimating preference weights are published by the authors, though not independently tested..
The multi-attribute utility theory (MAUT), which specifies a functional form in advance and uses the values for the levels of each dimension combined with values for corner states to mathematically
solve the function, has also been used (see [9] for an overview). MAUT has been explored to allow for interactions using a multiplicative form that allows for some highly restrictive forms of interaction (e.g. HUI3). However, evidence suggests statistical approaches are better at predicted health state values than MAUT (see [9] for details).
3.2 Valuation surveys
Valuation surveys have been undertaken across many countries for EQ-5D [24], but rather fewer for the others. For example, Szende et al [25] published value sets for EQ-5D-3L for a range of countries. All measures have an upper-bound health state utility value of 1.0 for full health but
differ in terms of their lower-bound value ranging from 0.301 (SF-6D [7]) to -0.59 (EQ-5D-3L) when using the UK valuations [26]. It is worth noting that some measures include negative utility values representing health states that are valued by the general public as being ´worse-than-dead´. Worked examples of how to calculate UK EQ-5D-3L HSUVs for patients with differing responses (e.g.
6
Table 1 Descriptive systems of GPBMsInstrument
No. of
dimensions
Dimensions
No. of
severity
levels
No. of health state combinations
15D
[67]15
Breathing, depression, discomfort/symptoms,
distress, eating, elimination, hearing, mental
function, mobility, sexual activity, sleeping,
speech, usual activities, vision vitality,
4 5
31 billion
AQoL-8D
[8]8
Coping (n=3 items), happiness (4), independent
living (4), mental health (8), pain (3),
relationship (7), self-worth (3), senses (3)
4-6
2.37*10
23EQ-5D-3L
[26]5
Anxiety/depression, mobility, pain/discomfort,
self-care, usual activities
3
243
EQ-5D-5L
[5]5
Anxiety/depression, mobility, pain/discomfort,
self-care, usual activities
5
3,125
HUI3
[3]8
Ambulation, cognition, dexterity, emotion,
hearing, pain, speech, vision
5 6
972,000
SF-6D
[6]#6
Energy, mental health, pain, physical
functioning, role limitation, social functioning
4 6
18,000 36 v1), 18,750 36 v2) and 7,500
(SF-12)
QWB-SA
[2]3 (+68)
Mobility, physical activity, social functioning
68 symptoms/problems
2
945
#
7
Table 2 Valuation methods of GPBMsInstrument
Country
Valuation technique
Type of model
HSUV range
#(min, max)
15D
[67]Finland
VAS
MAUT additive
0.11, 1
AQoL-8D
[8]Australia
VAS transformed into
TTO
MAUT multiplicative and
statistical
-0.04, 1
EQ-5D
[26]3L: UK, US plus 16 others
5L: UK plus others
3L: Ranking, TTO, VAS,
TTO, DCE
Statistical additive
Statistical additive
3L UK: -0.59, 1
5L UK: -0.208, 1
HUI3
[3]Canada, France
VAS transformed into
SG
MAUT multiplicative
-0.36, 1
SF-6D
[6]UK and 5 others
SG, ranking
V2: DCE with duration
Statistical additive with
interaction term
0.301, 1
QWB-SA
[2]USA
VAS
Statistical additive, except for
symptom/problem complexes
0.08, 1
#
8
Table 3 EQ-5D-3L classificationDimension
Level
Description
Mobility (MOB)
1
I have no problems walking about
2
I have some problems walking about
3
I am confined to bed
Self-Care (SC)
1
I have no problems with self-care
2
I have some problems washing or dressing myself
3
I am unable to wash or dress myself
Usual activities (UA)
1
I have no problems with performing usual activities
#2
I have some problems with performing usual activities
3
I am unable to perform usual activities
Pain/discomfort (Pain)
1
I have no pain or discomfort
2
I have moderate pain or discomfort
3
I have extreme pain or discomfort
Anxiety/depression (AD)
1
I am not anxious or depressed
2
I am moderately anxious or depressed
3
I am extremely anxious or depressed
9
Box 1 Example of using the EQ-5D-3L tariff for the UKWorked examples of how to generate a HSUV for responses to the EQ-5D-3L questionnaire using the UK tariff [26]
HSUV responses to MOB SC UA Pain and AD all equal i e no problems on any dimension otherwise
HSUV MOB MOB SC SC UA UA Pain Pain
AD AD any level or any level
Health dimension Level selected by patient A, B, C and D
A B C D
Mobility (MOB) 1 1 2 3
Social care (SC) 1 2 2 3
Usual activities (UA) 1 1 2 3
Pain 1 2 3 3
Anxiety/depression (AD) 1 1 2 3
HSUV generated
Apply tariff weights If all responses on all 5 dimensions are 1, then HSUV = 1
SC Pain
any level
MOB UA Pain AD
any level or any level
MOB SC
UA Pain
any level or any level
10
4. Do different GPBMs produce the same scores?All GPBMs are anchored at one for full health and zero this does not imply they generate the same values because of the differences in their descriptions of health and the methods of valuation. Indeed there is a substantial body of evidence to show they do not produce the same values when administered to the same patients. A review of 24 studies found that agreement
between HSUVs (i.e. the utility values) from different GPBMs was generally poor to moderate (around 0.3-0.5 as measured by the intra class correlation coefficient) [9]. Whilst aggregate differences in mean HSUVs scores in large patient samples obtained from the SF-6D, EQ-5D and HUI3 have often been found to be little more than 0.05, this statistic (i.e. the mean HSUV) masks
considerable differences within patient groups, and hence the HSUV estimates for differences and changes used to estimate cost-effectiveness used to calculate the mean HSUV. Some GPBM are
possible health state. The EQ-5D has the largest proportion at the ceiling (i.e.
and corresponding HSUV: 1.0), followed by HUI3 and 15D. Important differences have been found
for specific conditions like vision and hearing [27,28] and large differences were found in the size of gain in total hip arthroplasty patients [10].
A recent on-line survey involving six countries (Australia, USA, UK, Norway, Germany, Canada)
GPBM
health conditions (asthma, cancer, depression, diabetes, hearing loss, arthritis, heart disease, chronic obstructive pulmonary disease, stroke) [10]. When comparing the mean HSUVs for six individual conditions with the general population, the mean differences were found to be largest for the HUI3, followed by EQ-5D, AQoL, QWB and SF-6D. Such differences have important implications
for the cost-effectiveness of interventions. Ranking by effect sizes (i.e. dividing through by their standard deviations) resulted in the QWB having the largest difference between the six diseases and the general population, followed by 15D, SF-6D with HUI3 and EQ-5D having the least difference. This has implications for sample sizes, since those with larger effect sizes have more power to detect a given difference. For example, the EQ-5D and HUI3 would need to be collected in a much larger
11
5. The psychometric properties of the GPBMsPatient reported outcome measures are typically evaluated using the psychometric criteria of practicality, reliability, validity and responsiveness. Please refer to Box 2 for a description of the criteria to select a GBPM. All six commonly used generic measures have been shown to be practical, though the longer ones raise more concerns about patient burden and achieve lower levels of
completion (see [10,30] for an overview). There is no evidence of differences in re-test reliability between the generic measures in terms of their ability to re-produce scores in patients who complete the scores on two occasions close apart when there has been no change in health. The most contentious area is validity due to the absence of a gold standard measure of health and it is
12
Table 4 Comparison of the content of six GPBMsDomains
N
Physical domains and somatic sensations
AQ L
EQ-5D
[26]HUI
QWB
-
“A
“F
-
D
D
M
2
1
B
-
1
D
P
2
1
“
2
U
1
C
V
“
Psychosocial or emotional domains
AQoL
EQ-5D
HUI
QWB
-
“A
“F
-
D
D
W
H
A
“
-M
“
C
U
13
5.1 Validity and responsiveness criteriaContent validity is defined as the extent to which the classification comprehensively covers the different dimensions of a health condition and whether it misses important ones. To be accepted as generic, a measure should cover at least the following overarching dimensions: physical, mental, social health WHO [32], and somatic sensations (e.g. pain) [33].
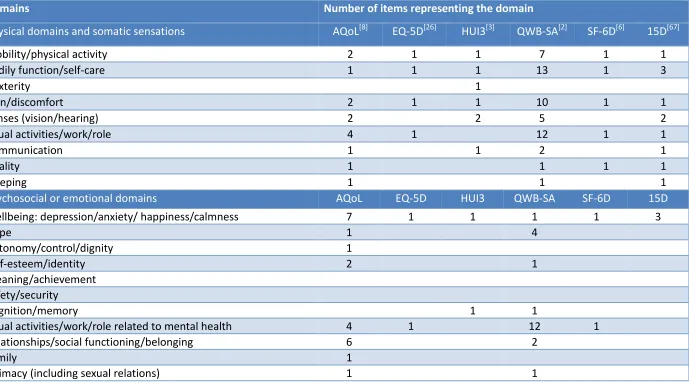
The coverage of the 6 measures is shown in Table 4 against a list of physical and psychosocial health domains (adapted from [10]). The measures differ in size with EQ-5D covering the least number of domains and AQoL-8D the most. The vast majority of items in EQ-5D, HUI3 and 15D are concerned with physical domains, while SF-6D and particularly AQoL cover more psychosocial and wellbeing
domains. QWB-SA is mainly concerned with symptoms or problems and so predominantly covers physical aspects (although it covers more mental health aspects than the earlier version of QWB). There are notable gaps in many of the measures including cognition in EQ-5D, SF-6D and QWB-SA; and sleep in EQ-5D, SF-6D and HUI3. However, care must be taken in using the list in Table 4 since it may not be comprehensive, and at the same time the domains are not mutually exclusive, so for
example family and work activities may be considered to be covered by usual activities. Furthermore, even where there appears to be a relevant item analysts should examine the specific content of the item to verify whether it seems relevant to the concept they wish to measure (e.g. the EQ-5D-5L mobility is concerned with walking but this may not be relevant for use in populations with large proportions of wheel chair users).
Construct validity is measured empirically in terms of the extent to which a measure reflects known differences between groups, or known group validity (KGV), and correlates with other indicators of health, or convergent validity (CV). For KGV tests based on known group differences this depends on
the basis for the groupings. Where there are other self-report measures of dimensions of interest (that may not be preference-based), such as scales of mobility or self-care, they can be useful in assessing whether the GPBM descriptive system is sensitive to such differences. In practice, studies in the literature often use clinical measures that may have only a weak relationship to health related quality of life (HRQoL) , such as visual acuity, respiratory function or symptoms of schizophrenia.
Great care must be taken to scrutinise the measures being used to establish known group differences or convergence and to establish that these are themselves appropriate indicators of preferences [34]. A further problem is most published studies use overall preference weighted scores and so conflate the measure of health namely the description of health with general
14
Responsiveness is related to construct validity and assesses the ability to reflect known changes in health. This too depends on having an appropriate indicator that the health of a patient has changed and the direction of change. Sometimes an instrument is described as being insensitive, and this simply means it is not able to reflect differences or changes in a population, or seems to be
less sensitive compared to another measure (e.g. small standardised differences or changes).
Box 2 Criteria for selecting preference-based measures
The usual psychometric selection criteria are practicality, reliability and validity, but these need to be considered alongside the valuation methods and requirements of different jurisdictions.
Practical: The practicality depends on acceptability to patients and the cost of administration (e.g. in terms of time). All six measures have been found to be practical for self-administration, though shorter measures may be easier to include in trials.
Reliability: This is the ability of a measure to reproduce the same values on two separate administrations when there has been no change in health. All the GPBMs achieve similar levels of re-test reliability.
Content validity: This is defined as the extent to which the descriptive system covers the different dimensions of health of relevance to the patient population. The shorter measures inevitably struggle to achieve this in some populations, such as the absence of cognition in EQ-5D and SF-6D making them less valid in dementia. On the other hand the longer measures suffer from overlap and may be more difficult to value.
Construct validity: This is measured empirically in terms of the extent to which a measure reflects known differences between groups, or known group validity (KGV), and correlates with other indicators of the health, or convergent validity (CV). There are too few head to head comparisons to select one measure over another in many cases. Evidence suggests that EQ-5D (the three level version) is able to detect differences in many populations (despite the shorter size), but there are some important exceptions (e.g. vision and hearing).
Responsiveness: This is related to construct validity and assesses the ability of a measure to reflect known changes in health. As for construct validity, GPBMs have been shown to be unresponsive in some conditions.
Valuation: It is not possible to prescribe one valuation technique as valid compared to another, but most economists have advocated choice-based methods like TTO or SG. The appropriateness of valuation methods depends on the extent to which the technique and source of values meet the requirements of the relevant policy maker. For those requiring choice based methods this would rule out 15D, HUI3 and QWB, and some jurisdictions require country specific preference values.
15
5.2 Review of studies comparing measuresThe literature on the empirical evidence of validity and responsiveness is too large to provide a systematic review for this article. Instead we draw heavily on a recent review of reviews conducted across the five measures [30]. The majority of published studies reviewed just one or two measures with very few examples of three or more instruments being compared.
Thirty reviews of measures were identified across more than 25 conditions covering several hundred studies [30]. However, the vast majority of the evidence was for the three level version of the EQ-5D (n = 29 studies), followed by SF-6D (n = 12) and then HUI3 (n = 8), with very little on the AQoL (n = 3)
or 15D (n = 2), and none for the EQ-5D-5L. The number of studies in each review varied from 5 to 22. This evidence base in part reflects the tendency for more research into the EQ-5D, following the publication of NICE s preference for EQ-5D in 2008 [11]. This makes it very difficult to make statements about the comparative performance across the measures (Box 2). Furthermore, there is considerable variation in the way reviews report evidence. Only a broad summary of findings is
given here (for more details see [30]).
Box 3 Evidence on construct validity and responsiveness of EQ-5D
Major areas of concern:
- Senses of vision and hearing
- Severe and complex mental health problems - Elderly and dementia
- Infants (age 0-5)
Problematic conditions:
- Chronic obstructive airways disease - Orthopaedic leg-reconstruction
- Rehabilitation patients (with musculosketal, cardiovascular or psychosomatic disorders)
Areas where EQ-5D has been shown to perform well (examples):
- Rheumatoid arthritis16
NB: This is based on available evidence
Source: based on findings from [34,35,36,9]
Whenever evidence is available, it often supports the performance of GPBMs in many conditions, with differences and changes usually in the expected direction and often significant. This includes known group differences between patient populations and healthy populations and between
severity groups of patients. The GPBMs have been shown to correlate with one another moderately and more highly in some cases. They have also been shown to respond to hypothesised changes in health for many conditions.
It is difficult to compare the psychometric performance of the measures, since there are few head to
head comparisons, but there are a few findings of note (see Box 3):
The first concerns situations where the evidence on EQ-5D suggests mixed or poor levels of
performance. Three areas stand out from the literature: the senses of vision and hearing [34], elderly populations with dementia [37] and more severe and complex mental health condition like schizophrenia and bipolar disorder [36].
There are other areas where EQ-5D has been shown to be problematic: it was found to be
less responsive in rehabilitation patients than SF-6D [35], chronic obstructive airways disease [38] and orthopaedic leg re-construction [39].
The EQ-5D has been shown to perform satisfactorily in many conditions including rheumatoid
arthritis, many cancers and depression [36,34], and was found to be more responsive than HUI3 in musculoskeletal disease [40], and more responsive than SF-6D in liver disease [41]. However, there is insufficient comparative evidence to draw definitive conclusions between the measures. There are huge gaps in the coverage of evidence across conditions and the quality of evidence is often
poor.
6. Selecting a measure for economic evaluation
When selecting a measure for clinical trials or other studies such as observational, the recommended approach is to select measures that perform best in terms of practicality, reliability,
17
to which the economic evaluation will be submitted. At one extreme, there are England and the Netherlands who prefer the EQ-5D [12,42]. In most countries, agencies requiring cost-effectiveness evidence do not specify one particular measure, though some specify the valuation method (e.g. requiring choice-based techniques such as TTO or SG), or the population from whom the preference values should come (e.g. a sample of the general population) [1]. In summary:
For submissions to NICE, the question is whether there is a strong case for arguing the
EQ-5D is not appropriate in terms of content validity or construct validity. Measures like the HUI3 have been used for submissions involving patients with vision loss, but these exceptions are rare.
For submissions to other agencies, the analyst should select the best measure in terms of
psychometric criteria that meets their requirements (e.g. valued using a choice-based method). Some agencies do indicate a list of preferred measures to select from and this will influence the selection [1]. Where feasible selection of a measure from such a list should follow the criteria outlined in Table 4, and the best measure should be the one that is most
relevant to the population in terms of the domains it covers, and most sensitive to either meaningful known group differences or changes over time.
Preference weights are not available for all countries and preference measures. For settings
that require country specific weights, there may be scope to map onto an alternative measure that does have preference weights.
These recommendations do raise the problem of possible conflict between the needs of different agencies and the availability of HSUVs on the relevant patient group (e.g. the constraints of running international trials). Should analysts simply adopt the most widely used measure (namely, EQ-5D) to maximise comparability with previous studies? For some conditions this would be sub-optimal in
terms of validity, so what happens if a researcher decides to use another, more relevant generic (or condition specific) preference-based measure?
Finally, whichever values are chosen:
For transparency reasons the modeling report should clearly describe and justify which
18
7. New developments1) The development of the 5-level version of EQ-5D: in order to address concerns that the original 3-level version of EQ-5D may have insufficient 3-levels to detect small differences in health and
suffer from ceiling effects (i.e. too many patients reporting state 11111), the Euroqol group extended the number of severity levels to 5. The 3-
- slight, moderate, severe and
of the dimensions [5]. There is evidence of some reduction in the number at the ceiling, but there is little evidence on its psychometric performance. The number of official country specific preference weights is growing and at the time of writing these were available for Canada, Japan, the Netherlands, Spain, the UK, and Uruquay [44]
2) The development of bolt-on dimensions for EQ-5D: to address the concerns that EQ-5D misses
important dimensions of health, some researchers have been developing extra dimensions to add to the existing five. These cover cognition, vision, hearing, sleep and skin disorders and others are being developed. This research is ongoing and no bolt on versions have been approved as yet by the EuroQol Group.
3) The development of value sets for PROMIS: PROMIS is a comprehensive item bank for measuring
health [65], and research is ongoing to provide utility values for PROMIS to enable the evidence to be used to directly generate HSUVs (see for example [66].
8. Summary
GPBMs are designed to be used across all conditions or diseases to generate HSUVs for calculating QALYs. There are six GPBM currently in use and these vary in terms of the dimensions they cover, their size, methods of valuation, and the HSUV they generate for the same patient. The selection of GPBM for any given study should be based on content validity and literature reviews of empirical evidence on construct validity and responsiveness. These properties are difficult to demonstrate in
the absence of a gold standard. Evidence on construct validity and responsiveness is very limited, but what there is suggests GPBMs can reflect important differences in the health related quality of life associated with many conditions though there are important exceptions (e.g. poor performance of EQ-5D in vision, hearing, complex and severe mental health and dementia). Any choice of
19
Disclosure statementThis article is published in a special edition journal supplement wholly funded by Takeda Pharmaceutical International AG, Zurich, Switzerland.
Acknowledgement
The authors would like to thank Prof Jon Karnon, PhD of The University of Adelaide and Dr Andrew Lloyd, Phd of Bladen Associates Ltd for their editorial review.
Author contributions
JEB reviewed the literature, and wrote the first draft of the manuscript. RA made significant edits to the first and subsequent drafts of the manuscript. DR made significant edits to the first and
subsequent drafts of the manuscript. HCS made significant edits to the first and subsequent drafts of the manuscript.
Compliance with Ethical Standards
Funding This study was funded by an unrestricted grant from Takeda Pharmaceuticals International AG.
20
REFERENCE[1] Rowen D, Azzabi Zouraq I, Chevrou-Severac H, van Hout B. International regulations and recommendations Current issue Pharmacoeconomics.
[2] Kaplan RM, Anderson JP (1988) A general health policy model: update and application. Health Services Research 23:203-235.
[3] Feeny DH, Furlong WJ, Torrance GW, Goldsmith CH, Zenglong Z, Depauw S, Denton M, Boyle M (2002). Multiattribute and single-attribute utility function: the Health Utility Index Mark 3 system. Medical Care 40:113 28.
[4] Brooks R. EuroQol: the current state of play. Health Policy. 1996;37(1):53-72.
[5] Herdman M, Gudex C, Lloyd A, Janssen M, Kind P, Parkin D, et al. Development and preliminary testing of the new five-level version of EQ-5D (EQ-5D-5L). Qual Life Res. 2011;20(10):1727-36.
[6] Brazier J, Roberts J, Deverill M (2002). The estimation of a preference-based single index measure for health from the SF-36. Journal of Health Economics 21:271 92.
[7] Brazier JE, Roberts J (2004). Estimating a preference-based index from the SF-12. Medical Care 42:851 9.
[8] Richardson J., Sinha K., Iezzi A., & Khan M.A. (2014). Modelling utility weights for the Assessment of Quality of Life (AQoL) 8D. Quality of Life Research, vol 23, pp2395-2404. DOI:10.1007/s11136-014-0686-8.
[9] Brazier J, Ratcliffe J, Tsuchiya A, Solomon J. Measuring and Valuing Health for Economic Evaluation. 2nd Edition, Oxford: Oxford University Press; 2017. p. 175-256.
[10] Richardson J, McKie J, Bariola E. Multiattribute utility instruments and their use. In: Culyer AJ, editor. Encyclopaedia of Health Economics. Vol. 2. San Diego: Elsevier; 2014. p. 341-57.
[11] NICE (National Institute for Health and Care Excellence). Guide to the methods of technology appraisal. London: National Health Service, 2008. (Replaced by the 2013 version). Available from www.nice.org.uk
[12] NICE (National Institute for Health and Care Excellence). Guide to the methods of technology appraisal. London: National Health Service, 2013. Available from www.nice.org.uk
[13] Bansback N, Brazier J, Tsuchiya A, et al. Using a discrete choice experiment to estimate health state utility values. J Health Econ. 2012; 31: 306-18.
[14] Bansback N, Hole AR, Mulhern B, et al. Testing a discrete choice experiment including duration to value health states for large descriptive systems: addressing design and sampling issues. Soc Sci Med. 2014; 114: 38-48.
21
[16] Norman R, Cronin P, Viney R. A pilot discrete choice experiment to explore preferences for EQ-5D-5L health states. Appl Health Econ Health Policy. 2013; 11: 287-98.
[17] Norman R, Viney R, Brazier J, et al. Valuing SF-6D Health States Using a Discrete Choice Experiment. Med Decis Making. 2014; 34: 773-86.
[18] Viney R, Norman R, Brazier J, et al. An Australian discrete choice experiment to value eq-5d health states. Health Econ. 2014; 23: 729-42.
[19] Devlin N, Shah K, Feng Y, Mulhern B, van Hout B. Valuing Health-Related Quality of Life: An EQ-5D-5L Value Set for England. University of Sheffield, 2016.
[20] Brazier JE, Rice N, Roberts J (2002). Modelling health state valuation data. In: Murray C, Salomon J, Mathers C, Lopez A, Lozano R, eds. Summary measures of population health: concepts, ethics, measurement and applications. World Health Organization, Geneva. pp. 529 548.
[21] K “A O H A B JE E dividual health
preference data: a nonparametric Bayesian method. Applied Statistics 54:879 95.
[22] Mendez I, Abellán JM, Sánchez FI, Martínez JE (2011). Inverse Probability Weighted Estimation of Social Tariffs: An illustration using SF-6D value sets. Journal of Health Economics 30, 1280-1292, 2011.
[23] Rowen D, Brazier J & Van Hout B (2015) A Comparison of Methods for Converting DCE Values onto the Full Health-Dead QALY Scale. Medical Decision Making, 35(3), 328-340
[24] Available from http://www.euroqol.org/ accessed 15th February 2017
[25] Szende A, Oppe M, Devlin N. EQ-5D Value Sets: Inventory, comparative review and user guide Springer; 2007.
[26] Dolan P. Modeling valuations for EuroQol health states. Med Care 1997; 35(11):1095-1108.
[27] Barton GR, Bankart J, Davis AC, Summerfield QA. Comparing utility scores before and after hearing-aid provision : results according to the EQ-5D, HUI3 and SF-6D. Appl Health Econ Health Policy. 2004;3(2):103-5.
[28] Espallargues M, Czoski-Murray CJ, Bansback NJ, Carlton J, Lewis GM, Hughes LA, et al. The impact of age-related macular degeneration on health status utility values. Invest Ophthalmol Vis Sci. 2005;46(11):4016-23.
[29] Feeny D, Wu L, Eng K. Comparing short form 6D, standard gamble, and Health Utilities Index Mark 2 and Mark 3 utility scores: results from total hip arthroplasty patients. Qual Life Res. 2004;13(10):1659-70.
[30] Finch AP, Brazier J, Mukuria CW. Validity and Responsiveness of Preference Based Measures: A Critical Overview of Reviews. Value Health. 2015;18(7):A744.
22
[32] The bibliographic citation for this definition is: Preamble to the Constitution of WHO as adopted by the International Health Conference, New York, 19 June - 22 July 1946 see
http://www.who.int/suggestions/faq/en/
[33] Schipper H, Clinch J, Olweny C. Quality of life studies: definitions and conceptual issues. In: Spilker B, editor. Quality of Life and Pharmoeconomics in Clinical Trials. Philadelphia: Lippincott-Raven Publishers; 1996.
[34] Longworth L, Yang Y, Young T, Mulhern B, Hernandez Alava M, Mukuria C, et al. Use of generic and condition-specific measures of health-related quality of life in NICE decision-making: a
systematic review, statistical modelling and survey. Health Technol Assess. 2014;18(9):1-224.
[35] Moock J, Kohlmann T. Comparing preference-based quality-of-life measures: results from rehabilitation patients with musculoskeletal, cardiovascular, or psychosomatic disorders. Qual Life Res. 2008;17(3):485-95.
[36] Brazier J, Connell J, O'Cathain A. Do EQ-5D and SF-6D ask the right questions in mental health? A content validation using interviews with patients. Value in Health. 2014;17(3):A194.
[37] Hounsome N, Orrell M, Edwards RT. EQ-5D as a quality of life measure in people with dementia and their carers: evidence and key issues. Value Health. 2011;14(2):390-9.
[38] Harper R, Brazier JE, Waterhouse JC, Walters SJ, Jones NM, Howard P. Comparison of outcome measures for patients with chronic obstructive pulmonary disease (COPD) in an outpatient setting. Thorax. 1997;52(10):879-87.
[39] Burton M, Walters SJ, Saleh M, Brazier JE. An evaluation of patient-reported outcome measures in lower limb reconstruction surgery. Qual Life Res. 2012;21(10):1731-43.
[40] Spady B, Suarez-Almazor M, editors. A comparison of preference-based health status tools in patients with musculoskeletal disease. The 18th Plenary Meeting of the Euroqol Group; 2001; Denmark.
[41] Longworth L, Bryan S. An empirical comparison of EQ-5D and SF-6D in liver transplant patients. Health Econ. 2003;12(12):1061-7.
[42] CVZ (College voor zorgverzekeringen). Guidelines for Pharmacoeconomic Research: evaluation and actualisation. Diemen: CVZ, 2006
[43] Wisloff T, Hagen G, Hamidi V, Movik E, Klemp M, Olsen JA. Estimating QALY gains in applied studies: a review of cost-utility analyses published in 2010. Pharmacoeconomics. 2014;32(4):367-75.
[44] http://www.euroqol.org/about-eq-5d/valuation-of-eq-5d/eq-5d-5l-value-sets.html accessed 20th February 2017
[65] Cella, D., Gershon, R., Lai, JS. et al. Qual Life Res (2007) 16(Suppl 1): 133. doi:10.1007/s11136-007-9204-6