This is a repository copy of
Improving Pattern Detection in Healthcare Process Mining
using an Interval-based Event Selection Method
.
White Rose Research Online URL for this paper:
http://eprints.whiterose.ac.uk/120434/
Version: Accepted Version
Proceedings Paper:
Alharbi, A, Bulpitt, A orcid.org/0000-0002-7905-4540 and Johnson, O
orcid.org/0000-0003-3998-541X (2017) Improving Pattern Detection in Healthcare Process
Mining using an Interval-based Event Selection Method. In: Lecture Notes in Business
Information Processing. BPM: International Conference on Business Process
Management, 2017, 10-15 Sep 2017, Barcelona, Spain. Springer Nature , pp. 88-105.
ISBN 978-3-319-65014-2
https://doi.org/10.1007/978-3-319-65015-9_6
© 2017, Springer. This is an author produced version of a paper published in Lecture
Notes in Business Information Processing. Uploaded in accordance with the publisher's
self-archiving policy. The final publication is available at link.springer.com via
http://dx.doi.org/10.1007/978-3-319-65015-9_6
[email protected] https://eprints.whiterose.ac.uk/
Reuse
Items deposited in White Rose Research Online are protected by copyright, with all rights reserved unless indicated otherwise. They may be downloaded and/or printed for private study, or other acts as permitted by national copyright laws. The publisher or other rights holders may allow further reproduction and re-use of the full text version. This is indicated by the licence information on the White Rose Research Online record for the item.
Takedown
If you consider content in White Rose Research Online to be in breach of UK law, please notify us by
adfa, p. 1, 2011.
© Springer-Verlag Berlin Heidelberg 2011
Improving Pattern Detection in Healthcare Process Mining
using an Interval-based Event Selection Method
Amirah Alharbi1,2,*, Andy Bulpitt1 , Owen Johnson1
1 School of Computing, University of Leeds, Leeds, UK
2 Computer Science Department, Umm Al-Qura University, KSA
Abstract.
Clinical pathways are highly variable and although many patients may fol-low similar pathway each individual will experience a unique set of events, for example with multiple repeated activities or varied sequences of activities. Pro-cess mining techniques are able to discover generalizable pathways based on data mining of event logs but using process mining techniques on a raw clinical pathway data to discover underlying healthcare processes is challenging due to this high variability. This paper involves two main contributions to healthcare process mining. The first contribution is developing a novel approach for event selection and outlier removing in order to improve pattern detection and thus representational quality. The second contribution is to demonstrate a new open access medical dataset, the MIMIC-III (Medical Information Mart for Intensive Care) database, which has not been used in process mining publications.
In this paper, we developed a new method for variations reduction in clinical pathways data. Variation can result from outlier events that prevent capturing clear patterns. Our approach targets the behavior of repeated activities. It uses interval-based patterns to determine outlier threshold based on the time of events occurring and the distinctive attribute of observed events.
The approach is tested on clinical pathways data for diabetes patients with congestive heart failure extracted from the MIMIC-III medical database and an-alyzed using the ProM process mining tool. The method has improved model precision conformance without reducing model fitness. We were able to reduce the number of events while making sure the mainstream patterns were unaffect-ed. We found that some activity types had a large number of outlier events whereas other activities had a relatively few. The interval-based event selection method has the potential of improve process visualization. This approach is un-dergoing implementation as an event log enhancement technique in the ProM tool.
Keywords: process mining, healthcare processes, interval pattern, variation
1
Introduction
Process mining aims to construct a model of business process using event logs ex-tracted from business information systems and a process discovery algorithm [1]implemented in software tools such as the ProM framework[2]. There is growing interest in using process mining on data from electronic health record systems to model and improve care processes and to reduce costs [3] despite widely recognized issues with data quality [4].
Event logs in electronic health record systems have a considerable amount of vari-ation which can hinder process model discovery. Event log preprocessing is a critical step for process mining research and this is recognized in the 2011 Process Mining Manifesto [5] as the first challenge for process mining. Outliers’ events can be de-fined as events that prevent capturing clear patterns; such events affect the quality of process mining efforts. There are different issues related to event log quality such as missing events, imprecise timestamps and repeated events [6]. Repeated events, or duplicate tasks, occur when the same activity has been executed multiple times in the same case. In critical care, for example, the incidence of repeated events is high be-cause events include periodic monitoring (known as “charting”) of heart rate, blood pressure and other vital signs.
From a process mining point of view, repeated activity is a significant confounding factor that can prevent generating useful models [7]. Typically, the handling of fre-quently repeated tasks has been addressed in a model discovery phase [8-10] howev-er, most current methods are tied to specific process discovery algorithms which re-strict more general use.
Dealing with repeated activity as a preprocessing step has received relatively little attention in the process mining community. Moreover, to the best of our knowledge, no existing work has tackled variation reduction of repeated activity using activity temporal patterns. Although there are around 20 plugins in the ProM (version 6.5) process mining tool for log preparation, only two filters can be used for filtering peated activity preparation. These filters are called merge subsequent events and re-move event type [11]. They help to reduce the number of events however, no attention is paid for preserving time information about merged/removed events.
In this paper, we aim to present a new approach to filtering the outlier event of re-peated activity using an interval-based selection method as a preprocessing step to applying process mining discovery techniques as a reusable method. This method aims to reduce the number of repeated events with more attention for preserving the mainstream temporal pattern. The method uses the interval-pattern of repeated activi-ty as a threshold to remove outlier events.
this approach on model precision and representational quality. In Section 6, the con-clusion and future work is discussed.
2
Related work
Process mining aims to construct a process model using an event log and a process discovery algorithm [1]. It has been applied in healthcare to improve care process and to reduce costs [3].
A few papers in the process mining literature have addressed repeated activity as a preprocessing step. In [12], the problem of repeating tasks was addressed by refining activity labels in a preprocess stage. This solution labeled repeated activity based on its context for instance, ‘payment’ activity can occur at the start of a process instance or at the end. Although this approach adopted accurate steps for detecting repeated activity, the method is not applicable in the case of large amount of repeated activi-ties, such as those we found in healthcare data, because it increases the number of distinct activities.
Two papers [11, 13] have mentioned the idea of merging repeated events into one single event. This approach is implemented in ProM as an event log enhancement filter named merge subsequent events. It aims to merge consecutive events of the same activity. The merge subsequent events filter has three options of merging which are 1) merge by keeping the first event, 2) merge by keeping the last event or 3) merge by considering the first as start time and the last as end time. Using this method helps to reduce the number of events however, there are a number of limitations to be discussed. The first and second options of merging ignore the time aspect between events and concentrate on reducing the number of events at the cost of losing time information. The third type of merging may result in misleading event duration. In this paper, our aim is to improve on these tools to address the specific challenges of remove outliers in healthcare event log and compare our new method to the available techniques.
3
MIMIC-III database
MIMIC-III (Medical Information Mart for Intensive Care)[14] is a publicly available medical research database of de-identified records of patients who were admitted to the Beth Israel Deaconess Medical Centre in Boston, USA between 2001 and 2012.
nurs-es’ and physicians’ observations and notes, fluid balance, diagnosis and treatments codes, care giver information, length of stay and time of death.
The data comprise 58,976 hospital admissions, and 46,520 distinct patients. 55.9% of the patients are male and 44.1% are female. There are around 380 types of labora-tory measurements and 4,579 types of Intensive Care Unit (ICU) “charted” observa-tions, such as heart rate and blood pressure. The admissions cover five critical care units which are the Coronary Care Unit (CCU), Cardiac Surgery Recovery Unit (CSRU), Medical Intensive Care Unit (MICU), Surgical Intensive Care Unit (SICU) and Trauma Surgical Intensive Care Unit (TSICU).
The MIMIC dataset has been used in 134 publications mostly describing data min-ing and machine learnmin-ing approaches [15]. None of these have described a process mining approach. In this paper, we describe how we have used the MIMIC-III data-base to extract and process mined an event log in order to explore patients’ pathways for diabetes patients as a precursor to further work in diabetes. Our clinical advice is that these patients can be expected to have complex medical histories and complex care pathway patterns.
3.1 MIMIC-III and process mining
MIMIC-III can be used as a rich data source for process mining applications be-cause it has many records with timestamps that can be extracted as medical events. There are 16 tables out of 26 tables in MIMIC-III database that contain medical events. These tables are used as a healthcare data model, which is discussed in the following section, for our healthcare process mining research.
In order to respect patient confidentiality the MIMIC-III dataset de-identification process included obfuscation of dates. The dates of all events have been shifted into the future using time offsets randomly generated for each patient. This approach pre-serves the time intervals and ensures the sequence of medical events are internally consistent but it means that certain process mining analytics approaches such as look-ing for arrival time bottlenecks cannot be used.
There are two main data types for time attributes in MIMIC-III which are chart time and chart date. They provide different time resolution of the event for instance, the chart date field has date only without time, this is because the accurate time for that event is not known, whereas chart time field has date and time with hour, minute and second of that event.
3.2 The Healthcare Data Model
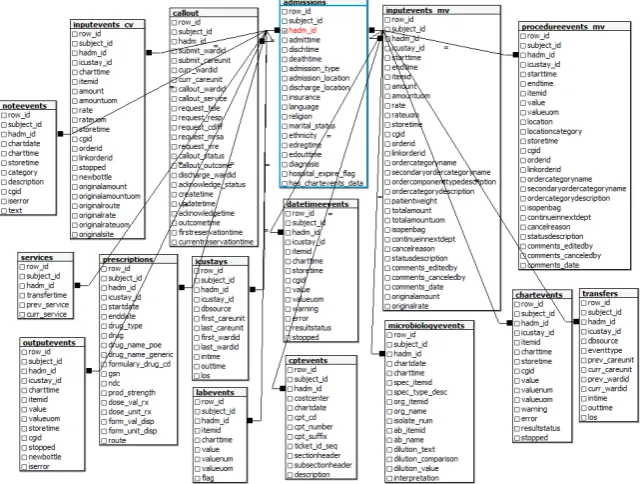
A healthcare data model is a model that shows the relation between tables in a medical database that may contain healthcare events. The data model is significant in process mining research because it helps to extract event logs and to understand pro-cess oriented questions [3]. We developed a healthcare data model by analyzing the MIMIC-III database and using table descriptions based on [14] [15]. Figure1 shows the Entity-Relationship (E-R) diagram we constructed for the MIMIC-III database.
Fig. 1. E-R diagram of MIMIC-III data model constructed using PostgreSQL.
The relevant healthcare events in our data model can be categorized into six groups of events which are administrative events, charted events, test events, medication events, billing events and report events.
In the following section, a description of the six event categories is provided along with a brief description of the sourced tables, for more detail about the tables the reader may refer to [14].
1- Administrative events identify patients’ admission pathways which show if a patient has been admitted from emergency department or the patient has a pre-arranged admission. Also, administrative events include all patient trans-portation activities during their stay in different care units of the hospital through to a discharge event. This group of events is located in Admissions, Callout, Transfer, ICU stay tables.
Admissions table: holds demographic information about the patient, admission time, emergency department (ED) registration time ‘edreg’, emergency department out time ‘edout’, discharge and death time, discharge and death time.
Callout table: contains information about the time of discharge request and the time of the request outcome if it is fulfilled or cancelled.
Transfer table: holds information about patient transportation such as the time when a patient is moved in or moved out of different wards which include different critical care units.
2- Charted events contain all bedside observations that are related to vital
signs measurements such as heart rate and blood pressure or other interven-tion activity. This group of events is stored in the Chart-events and Date-time-events tables.
Chart-events table: has all patients’ charted observations. There are more than 4500 types of charted observation. The table includes information about the time when an observation is taken and the time of observation validation performed by clinical staff. Date-time-events table: this table contains the observation date of particular interven-tions such as dialysis or insertion of lines.
3- Test events correspond to all tests that have been measured on the patient
such as laboratory tests and test results. This category of events is captured in Output-events, Microbiology-events and Lab-events tables.
Output-event table: has all output measurements for example, urine or blood. This table stores the time and value of the output measurement when is taken from the patient.
Microbiology-events table: this table contains information about tests and antibiotic sensitivities.
Lab-events table: this table has around 380 items for measurements some of them related to hematology and chemistry. It records output and microbiology results.
4- Medication events include prescribed medication and intravenous
medica-tion. These events can be extracted from Prescription and Input-events-CV and Input-events-MV tables.
Prescription table: this table contains information about when a drug starts and ends besides prescription order if it is needed.
Input-events-CV and Input-events-MV tables: these tables are generated from different healthcare information systems (CareVue and Metavision) but both contain infor-mation about the time when a medication intake occurred, for example enteral feed-ing, is recorded and its value. Some more transactional events are supported by Input-events-MV table such as the time when intake is ended or an intake order is updated 5- Billing events contain a list of medical procedures that are performed on
pa-tients that are used for billing services. Billing events can be extracted from CPT-events table.
CPT-events table: this table has a list of Current Procedural Terminology (CPT) codes for medical billing purposes. It contains information that shows the time of performed procedures.
6- Report events include different types of reports such as nurse notes and
ra-diology notes. Report events are captured in the Note-event table.
Note-event table: this table has information about different types of notes, the date of reported notes and the ID of the caregiver who reported it.
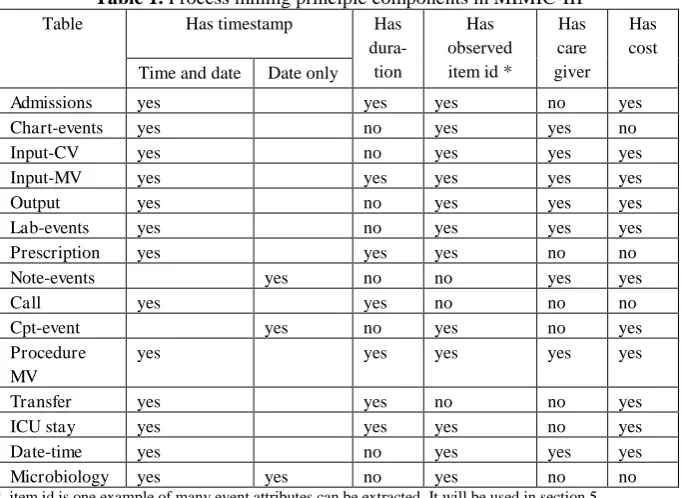
from the care-givers table. Table 1 provides a summary of process mining principle components in MIMIC-III.
Table 1. Process mining principle components in MIMIC-III
Table Has timestamp Has
dura-tion
Has observed item id *
Has care giver
Has cost Time and date Date only
Admissions yes yes yes no yes
Chart-events yes no yes yes no
Input-CV yes no yes yes yes
Input-MV yes yes yes yes yes
Output yes no yes yes yes
Lab-events yes no yes yes yes
Prescription yes yes yes no no
Note-events yes no no yes yes
Call yes yes no no no
Cpt-event yes no yes no yes
Procedure MV
yes yes yes yes yes
Transfer yes yes no no yes
ICU stay yes yes yes no yes
Date-time yes no yes yes yes
Microbiology yes yes no yes no no
* item id is one example of many event attributes can be extracted. It will be used in section 5.
3.3 Extracting event logs from MIMIC-III
Although many modern business information systems automatically generate event logs, there are some information systems, including electronic health records that store process activities implicitly and consequently need a method for event log ex-traction. MIMIC-III is an object-relational database that is built using a PostgreSQL database management system. It does not support automatic extraction of event logs and we have therefore extracted the event log manually using SQL queries. The healthcare data model is used to guide event log extraction. In this paper, we used diabetes patients with congestive heart failure (CHF) as a use case.
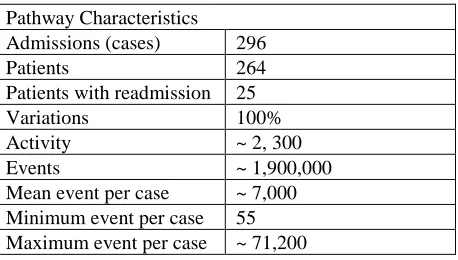
An example of SQL query that is used to extract an event log is shown in Figure 2. The summary statistics of the extracted event log is shown in Table 2. There are 296 distinct admissions for 264 patients. Also, there are more than 2,300 activity types and more than 1,900,000 events which correspond to activity instances. The pathway variation reaches 100% among patients which means no common pathway is found. Admission id, hadm_id, is used as the case id in all our experiments.
Fig. 2. An example of SQL query that is used to extract event logs
[image:9.595.128.469.179.428.2]FROM Patients_Events // Patients_Events is a created table that contains all diabetes patients activities where each row corresponds to one event
WHERE
Patients_Events.hadm_id IN ( SELECT hadm_id FROM
mimiciii.admissions WHERE
[image:10.595.185.414.281.411.2]diagnosis like '%CONGESTIVE HEART FAILURE' or diagnosis like ‘% congestive heartfailure’);
Table 2. Summary of the extracted diabetes event log
Pathway Characteristics Admissions (cases) 296
Patients 264
Patients with readmission 25 Variations 100% Activity ~ 2, 300
Events ~ 1,900,000
Mean event per case ~ 7,000 Minimum event per case 55 Maximum event per case ~ 71,200
4
Baseline event log preparation
In this section, we demonstrate two fundamental steps of event log preparation in order to provide a baseline event log that works as input for our interval-based event selection method. Taking into account the statistics of the extracted event log as shown in Table 2, these two steps are crucial for managing event log quality.
4.1 Event log processing step 1: Solve batch events
In the MIMIC-III database, there are some data quality issues such as missing ac-curate timestamps which is the result of batched events. Batch processing is the exe-cution of several events at once and recording them with the same time, for example a group of laboratory results received at the same time. The issue of batch processing also leads to a huge number of fine-grain events that increase process model complex-ity. In our data model, the tables Chart-events and Lab-events contain a large number of batch events which should be addressed as a preliminary step for mining patient pathways.
We re-extracted batched events with the same event label. The extraction includes tables that have batched events such as chart-event and lab-event. More precisely, for different chart measurements in the chart-event table such as Calcium, Glucose and Platelet count are all extracted under the name of Chartevent activity.
Results:
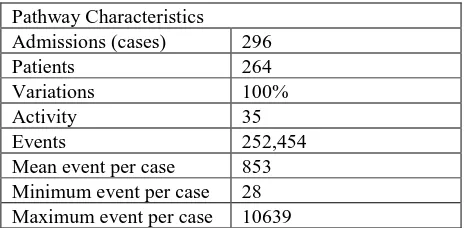
[image:11.595.182.415.331.445.2]This method has significantly reduced the number of activity types and the number of events which in turn reduced model complexity. It should be noted that, reducing the number of activities using this method does not lead to significant information loss because from a process mining perspective the exact name of measurements in the ICU is less important when we aim to mine the abstracted process model. We are able to capture the events occurred in chart-event and lab-event tables. Table 3 shows pathway characteristics after applying this manipulation.
Table 3. Summary of the extracted diabetes event log after processing step 1
Pathway Characteristics Admissions (cases) 296
Patients 264
Variations 100%
Activity 35
Events 252,454
Mean event per case 853 Minimum event per case 28 Maximum event per case 10639
Although this method reduces the number of activities and events, the variation of patients’ pathways is still extremely high and the event log needs further manipula-tions.
4.2 Event log processing step 2: Mapping fine-grained activities into main activity
In MIMIC-III there are two categories of fine-grained activities. The first category is transactional events and the second category is ontological events. The transactional event is an event that provides information about the activity - when it starts, updates, comments and finishes. This type of event is very common in the healthcare process for example, the process of patient transfer inside a hospital which starts when a nurse creates a call for transfer, the call might be updated or cancelled, then the call should be acknowledged and the outcome should be recorded.
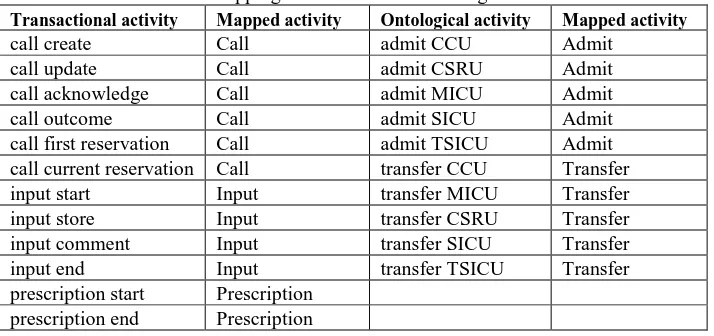
Using our data model, the categories of fine-grain activity are relatively limited for some tables. Transactional events are located in Call, Input and Prescription tables while ontological events are located in Admissions and Transfer tables. Hence, map-ping the fine-grain activity into main activity was done manually using the Add Map-ping of Activity Names log enhancement filter in ProM. The activities are mapped as illustrated in Table 4.
Table 4. Mapping transactional and ontological activities
Transactional activity Mapped activity Ontological activity Mapped activity
call create Call admit CCU Admit
call update Call admit CSRU Admit call acknowledge Call admit MICU Admit call outcome Call admit SICU Admit call first reservation Call admit TSICU Admit call current reservation Call transfer CCU Transfer input start Input transfer MICU Transfer input store Input transfer CSRU Transfer input comment Input transfer SICU Transfer input end Input transfer TSICU Transfer prescription start Prescription
prescription end Prescription
Results:
The results of this experiment shows that the number of different types of activities was reduced by nearly half of the previous processing step. Also, the number of events was reduced and consequently the mean of events per case is reduced.
On the other hand, the number of variations remained high and was not affected by mapping fine-grain activity. Table 5 shows some statistics of pathway characteristics after applying step 2 of event log processing.
Table 5. Summary of the extracted diabetes event log after processing step 2
Pathway Characteristics Admissions (cases) 296
Patients 264
Variations 100%
Activity 15
Events 210,139
Mean event per case 710 Minimum event per case 21 Maximum event per case 9246
[image:12.595.184.414.518.633.2]5
The rationale for an interval-based event selection method
In this paper, we define outlier events based on the time interval between events. Our starting assumption is that an event is regarded as an outlier if it occurs more fre-quently than a threshold interval determined from the central tendency and measure of dispersion of intervals for that event.
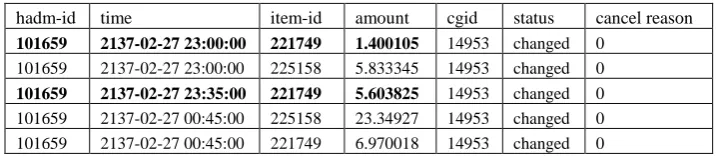
[image:13.595.118.480.322.400.2]We take into consideration that process mining focuses on capturing events that comply with the mainstream process. For instance, in the case of blood measure-ments, two successive measurements that occur within a short interval may occur because of an error in the measurement value. Therefore, removing one of those events will not lead to information loss as both events correspond to the same obser-vation. This assumption is supported by some data observation as shown in Table 6.
Table 6. Example of observations from input activity
hadm-id time item-id amount cgid status cancel reason
101659 2137-02-27 23:00:00 221749 1.400105 14953 changed 0
101659 2137-02-27 23:00:00 225158 5.833345 14953 changed 0
101659 2137-02-27 23:35:00 221749 5.603825 14953 changed 0
101659 2137-02-27 00:45:00 225158 23.34927 14953 changed 0 101659 2137-02-27 00:45:00 221749 6.970018 14953 changed 0
The table shows events extracted from Input table. The first and third highlighted rows belong to the same observed item where item id = 221749 for the same patient and the same ICU number. Assuming the interval pattern of input activity is 1 hour, the third row displays that this event occurred after 35 mins from the previous one. It appears that this event is repeated because the care giver has changed the amount of the intake item.
5.1 Interval-based event selection method
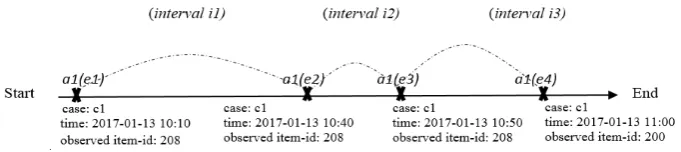
In this section, some formal definitions are provided to avoid any ambiguity in the method. The definitions are illustrated in Figure 3.
Definition 1(case c): is a single episode of care consists of different activities. Definition 2(activity a): An activity is an event class.
Definition 3(event e): e a where, e is an instance of a and has a timestamp and other attributes.
Definition 4(observed item x): is a distinguished attribute of an event e.
Definition 5(consecutive events(e1,e2)):e1,e2 are consecutive events same activity a.
Fig. 3. Example of interval-based selection method definitions
Our approach has several steps:
1.Create histograms of intervals i for each activity.
2.Use histograms to determine the central tendency and dispersion of the intervals to calculate a threshold value to identify outliers. Examples may be the mean, median and standard deviation depending on the shape of the distribution.
3.For each case c in the log, get activity a and compare the interval between its con-secutive events (e1,e2) until the end of the case. The interval between each consec-utive events (e1,e2) is computed by finding the time difference between e1and e2. 4.If the interval between consecutive events (e1,e2) is less than the threshold value of
that activity and both events occurred on the same observed item then, remove the second event as this event is an outlier based on our assumption. Otherwise, keep the second event because it belongs to a different item.
5.If the interval is equal or longer than the threshold value, keep both events because they comply with the pattern.
5.2 Interval-based event selection method and the MIMIC-III database
Fig. 4. Interval histogram for Lab and Notes activity
Table 7 shows the threshold interval values for repeated activities in MIMIC-III. These values are used for filtering the events for next experiments.
Table7. The selected threshold interval value of repeated activities
Activity Interval length Activity Interval length
Call 1.5 hours Chartevent 34.6 mins Cpt event 27.5 hours Labevent 6.0 hours Prescription 25.2 hours Input 1.1 hours Microbiology 66 hours Noteevent 8.9 hours Output 1.6 hours Transfer 52.8 hours
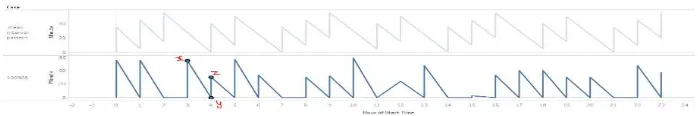
[image:15.595.123.472.365.423.2]For instance, In order to filter the Chartevent activity with interval value of 34.6 minutes. Our method aims to eliminate outlier events which have occurred in a time that is shorter than the selected threshold and belong to the same observed item for example, blood pressure. Let x, y, z be consecutive events of the Chartevent activity which occurred at the times 03:54, 04:00, 04:30 respectively for the patient ID 100908 as shown in Figure 5.
Fig. 5. Example of remove an outlier event from Chartevent activity
The interval between x and y is computed which is 6 mins hence, this is shorter than the threshold value. Then, x and y are checked if they are events for the same observed item, both for measuring blood pressure. If x and y belong to the same item this means the same item is checked twice therefore, y event is removed as it is an outlier.
After removing y, the interval between x and z is computed as they became con-secutive events. The interval = 36 mins which is longer than the threshold value. Hence, keep the event z and move forward to compare it with the next event.
5.3 Results and evaluation
Table 8. Summary of the diabetes event log after interval based event selection
Pathway Characteristics Admissions (cases) 296
Patients 264
Variations 100%
Activity 15
Events 208580
Mean event per case 705 Minimum event per case 21 Maximum event per case 9189
Moreover, this method has different impact on the activities. Some activities have been affected strongly by removing the outliers’ events such as Prescription and Cptevent where 331 outliers’ events are removed from Prescription and 248 in Cpte-vent activity. On the other hand, CharteCpte-vent and Output activities have the least im-pact with 56 outliers’ events in Chartevent and 64 in Output activity.
We have evaluated our approach by comparing it with the existing log preparation techniques in ProM that tried to remove the outliers of repeated activities. Despite the significant reduction of events number using merge subsequent event filter as shows in Table 9, there are a number of limitations as discussed earlier. The first and second options of merging ignore the time aspect between events and concentrating on reducing the number of events without consideration of losing time information. The third option of merging may result in misleading event duration.
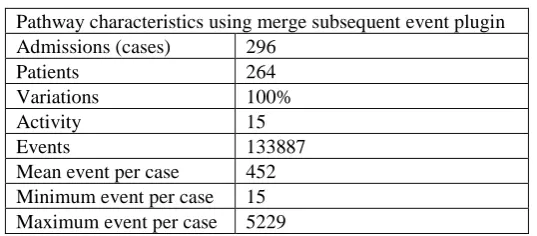
Table 9. Pathway characteristics using merge subsequent event
Pathway characteristics using merge subsequent event plugin Admissions (cases) 296
Patients 264
Variations 100%
Activity 15
Events 133887
Mean event per case 452 Minimum event per case 15 Maximum event per case 5229
To sum up, our simple interval based event selection method can outperform the current approach of repeated activity filtering. This is because an interval based approach takes into account temporal perspective between events unlike current technique that merge events regardless of the time perspective between them.
The impact of interval-based selection on model fitness and precision
[image:16.595.164.433.455.573.2]We have used the inductive miner because it is a robust, it generates sound model and has reliable precision and fitness measurements. It is used to generate a Petri net for both original and cleaned event log. Two variants of inductive miner are used, inductive miner (IM) and inductive miner–infrequent (IMi). The IM tries to divide the log into sub-logs by finding the best cut points between traces. It guarantees the redis-cover-ability for all traces. The IMi is a variant of IM with focusing on generating more precise model by discarding the infrequent traces among all divided sub-logs.
Model precision measurement in ProM can be calculated using different formulas. Generally, the precision estimates how many traces can be generated from the model which are not observed in the event log. In ProM, a Petri net model should be built on the log. In our investigation we used Inductive Miner to generate the Petri net and use this model and the logs for measuring precision.
[image:17.595.135.464.580.675.2]We used the alignment based precision method [17] because this method is more reliable as it does not penalize the model for allowed deviations of the traces that are not observed in the log however, it penalizes the model on the traces that are extreme-ly dissimilar of the observed traces using alignment score to identify traces similarity. We found that, our method improved model precision without reducing model fitness as shown in table 10.
Table 10. precision and fitness comparison between oringinal and cleaned log
Process miner IM IMi
Fitness Precision Fitness Precision Original event log 1 0.14 0.95 0.25 Cleaned event log 1 0.30 0.95 0.44
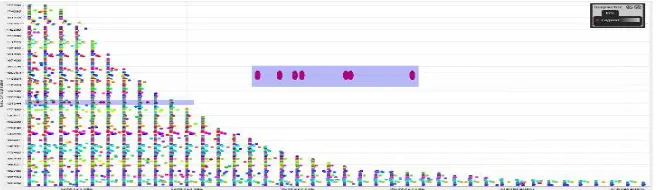
The impact of interval-based selection on event log visualization.
Fig. 6. Dotted chart of baseline event
Fig. 7. Dotted chart of cleaned event
6
Conclusion and future work
Interval-based event selection method is a technique that can be used for event log preparation as a preliminary step before applying process model discovery techniques. Our novel approach aimed to reduce the variations by filtering outlier events based on the mean interval of activities but the median or a number of standard deviations from the mean could also be used. The method improved model quality without reducing model fitness and has the potential of improving pattern visualization. In some situa-tions, using the mean interval to identify deviation threshold may not be the best choice because it depends on the data distribution.
Furthermore, activity duration has an influence on the interval pattern hence, using this approach on a reliable activity duration will produce better results. This method is tested using a Petri net generated by Inductive miner which is not an advanced miner that can deal with repeated activity as the case of Genetic miner. We believe that, using our approach with an advanced miner will improve model quality. Future re-search aims to integrate the existence techniques of extracting N-gram patterns with the interval-based cleaning method where an interval of a pattern rather single event type will be used as filtering threshold. Further work is needed to address the evalua-tion limitaevalua-tions of the interval-based approach that is presented in this paper.
7
References
1. Van der Aalst, W., Process mining: Discovery, conformance and enhancement of business processes. 2011, Springer-Verlag, Berlin.
2. Van Dongen, B.F., et al. The ProM framework: A new era in process mining tool support. in International Conference on Application and Theory of Petri Nets. 2005. Springer.
4. Weiskopf, N.G. and C. Weng, Methods and dimensions of electronic health rec-ord data quality assessment: enabling reuse for clinical research. Journal of the American Medical Informatics Association, 2013. 20(1): p. 144-151.
5. Van der Aalst, W., et al. Process mining manifesto. in International Conference on Business Process Management. 2011. Springer.
6. Bose, R.J.C., R.S. Mans, and Van der Aalst, W. Wanna improve process mining results? in Computational Intelligence and Data Mining (CIDM), 2013 IEEE Sym-posium on. 2013. IEEE.
7. de San Pedro, J. and J. Cortadella. Discovering duplicate tasks in transition sys-tems for the simplification of process models. in International Conference on Busi-ness Process Management. 2016. Springer.
8. Vázquez-Barreiros, B., M. Mucientes, and M. Lama. Mining Duplicate Tasks from Discovered Processes. in ATAED@ Petri Nets/ACSD. 2015.
9. Van der Aalst, W., et al., Process mining: a two-step approach to balance be-tween underfitting and overfitting. Software & Systems Modeling, 2010. 9(1): p. 87.
10. Broucke, S.V., Advances in Process Mining: Artificial Negative Events and Other Techniques. 2014.
11. da Silva, L.F.N., Process Mining: Application to a case study. 2014.
12. Lu, X., et al. Handling duplicated tasks in process discovery by refining event labels. in International Conference on Business Process Management. 2016. Springer.
13. Suriadi, S., et al., Event log imperfection patterns for process mining: Towards a systematic approach to cleaning event logs. Information Systems, 2017. 64: p. 132-150.
14. Johnson, A.E., et al., MIMIC-III, a freely accessible critical care database. Sci Data, 2016. 3: p. 160035.
15. MIMIC medical database. MIMIC-III Critical Care Database. 2015[cited 2017 09/03/2017].
16. Kurniati, A., et al., The assessment of data quality issues for process mining in healthcare using MIMIC-III, a publicly available e-health record database. 2017. (Publication in preparation)