School of Accountancy
THE CORPORATISATION OF LOCAL BODY
ENTITIES: A STUDY OF FINANCIAL
PERFORMANCE
J.J. Hooks
C.J. van Staden
Discussion Paper Series 217
MASSEY
UNIVERSITY
SCHOOL OF ACCOUNTANCY
DISCUSSION PAPER SERIES
Editor: Professor S F Cahan
Editorial Panel: Dr J J Hooks
Professor F Laswad Professor M H B Perera
Mr N Smith
Associate Professor S T Tooley Associate Professor L G S Trotman Dr C J van Staden
The discussion paper series of the School of Accountancy is intended to provide staff and postgraduate students of the School with a means of communicating new and developing ideas in order to facilitate academic debate. Discussion papers should not necessarily be taken as completed works or final expressions of opinions.
All discussion papers are subject to review prior to publication by members of the editorial panel. Views expressed are those of the authors, and are not necessarily shared by the School of Accountancy.
Normally discussion papers may be freely quoted or reproduced provided proper reference to the author and source is given. When a discussion paper is issued on a restricted basis, notice of an embargo on quotation/reproduction will appear on this page.
This discussion paper series is also now available at:
http://www-accountancy.massey.ac.nz/Publications.htm
Enquiries about the discussion paper series should be directed to the Editor:
School of Accountancy Massey University Private Bag 102 904 North Shore Mail Centre Auckland
New Zealand
Telephone: (09) 414 0800 extension 9489 Facsimile: (09) 441 8133
Email: [email protected]
THE CORPORATISATION OF LOCAL BODY ENTITIES: A
STUDY OF FINANCIAL PERFORMANCE
by
J.J. Hooks C.J. van Staden
School of Accountancy Massey University
Palmerston North New Zealand
Abstract
The New Zealand electricity industry provides us with a unique opportunity to examine how entities responded to major restructuring of the industry. This research studies the financial performance of three entities, each with a different ownership structure, over a 15 year period from 1988 to 2002. The aim is to examine the possible influence of ownership type and corporatisation on the development and financial performance of the entities by examining the changes that took place from the pre-corporatisation period to the post-corporatisation period and comparing and contrasting the performance and funding of the three entities over that time. In this way an assessment is made of the possible influence of ownership type on financial performance. This research can be framed to some extent by agency theory aspects of positive accounting theory. In addition legitimacy theory has been used to explain the behaviour of managers and the process of organizations adapting to a changing environment. Both theories acknowledge the interaction of organizations and their environment.
The comparison shows that at the end of the study period the council owned company was the smallest, in terms of total assets, of the three companies examined (although it was similar in size to the biggest one at the outset). The council owned company also returned most capital to its shareholders and is the most conservatively financed one of the three with only 10% debt at the end of 2002 compared to 28% for the trust-held company and 87% for the listed company. The listed company ended up being the biggest and the one with the highest gearing, the highest ROA and the highest profit margin. The study concludes that ownership structure did have an influence on financial performance and level of debt funding.
1. INTRODUCTION AND BACKGROUND
The New Zealand electricity industry provides us with a unique opportunity to examine how three entities, each with different ownership structures, responded to major restructuring of the industry. The study begins in 1988, one year after the commencement of the electricity industry reforms, and examines movements in profitability and funding throughout the change period until 2002. Reorganisation of the New Zealand electricity industry began in the late 1980s and since then the industry has been radically reformed. The reforms aimed to eliminate government involvement in business activities and to create a competitive environment which would encourage efficiency and reduce electricity prices.
In 1987 electricity generation and transmission was corporatised by the establishment of the Electricity Corporation of New Zealand (ECNZ). Distribution (the transfer of electricity from grid supply points to consumers by means of a lines network) and retail (the wholesale purchase of electricity and its sale to consumers) were the responsibility of local Power Boards and Municipal Electricity Departments (MEDs) each with an exclusive franchise to supply electricity within their area. The power boards were managed by board members elected at triennial local body elections and the MEDs were controlled by local city or borough councils.
The Electricity Act 1992 provided for the removal, over time, of franchise areas and the onus to supply all customers within a supply area. A competitive element was thus introduced into the retailing component of the industry and the old cost-plus pricing of the Power Board era was replaced by an emphasis on profitability. The new commercial focus, new ownership structure, new stakeholders and an emphasis on profit maximization saw the demise of the old lines of accountability. In many countries electricity supply, which is by its nature a monopoly business, is subject to close governmental financial control, particularly as regards earnings capacity. In New Zealand, control is effected by a “light-handed” regulatory regime based on the disclosure of information as required by the Electricity (Information Disclosure) Regulations 1994 and 1999. One of the significant outcomes of these regulations was the requirement to benchmark the value of the distribution networks (electricity lines). A valuation methodology known as Optimised Deprival Value (ODV)1 was introduced. ODV was compulsory for performance measurement purposes but did not necessarily form part of the company’s financial reporting.
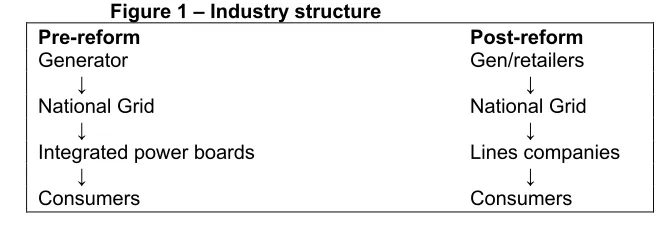
[image:7.612.107.438.538.658.2]The Government was increasingly concerned with the ability of the integrated electricity companies to cross-subsidise their distribution and retail business activities (subsidising their competitive retail business from their lines business where they had the monopoly for an area). It was thought that such cross-subsidisation was limiting the development of competition in the industry and in 1998 the Electricity Reform Act required the ESAs to split their distribution and retail businesses into two corporate bodies, each with its own management and board of directors. This was followed by a period of intense activity in the industry as companies moved to sell either their network business or their retail business. Most companies retained their network activities. There were a significant number of mergers and acquisitions. The retail businesses were, on the whole, purchased by state-owned generation companies thus establishing a new form of integrated company, the generator/retailer. Figure 1 shows the structure of the industry pre- and post-reform.
Figure 1 – Industry structure
Pre-reform Post-reform
Generator Gen/retailers ↓ ↓
National Grid National Grid ↓ ↓
Integrated power boards Lines companies ↓ ↓
Consumers Consumers
Throughout the period of restructuring, particularly since corporatisation in 1994, the Government has been concerned with three issues:
• The need to limit a line company’s ability to extract excessive profits;
• The need for strong incentives to provide services at a quality that reflects customer demand;
• The need to provide assurance that the benefits of efficiency gains are passed on to customers through lower prices.
The information disclosure regime (Electricity Information Disclosure Regulations 1994 and 1999) imposed a requirement to report on performance measures such as return on assets and return on equity in order to monitor performance. Companies therefore had to balance the need to report returns of a high enough level to satisfy shareholders but a low enough level to prevent more heavy handed regulation in the form of price controls. Recent Government intervention has centred around an amendment to the Commerce Act 1986, which deals specifically with line companies and provides for a special statutory scheme for the regulation of these companies. This research investigates three electricity companies in order to examine the possible influence of ownership type and corporatisation on the development and financial performance of the entities. The aim is not to try to establish a causal link between change in structure and performance as other factors such as company size and management ability could have an impact. Rather the paper seeks to demonstrate how the performance of each company changed over the 15 year period and to compare and contrast this performance with similar companies operating in the same industry but with different ownership structures. This is done by tracing the financial impact of the electricity industry reforms on three electricity utilities: Waitemata Electric Power Board (WEPB), Auckland Electric Power Board (AEPB) and Christchurch Municipal Electricity Department (CMED). These entities have been chosen for this case study because, although they all became limited companies (corporatised) at about the same time, they have different ownership structures. WEPB became a listed company. Under its new name of UnitedNetworks Ltd it is the largest of the New Zealand electricity distribution companies. AEPB (renamed Vector) is the largest of the trust-owned companies and CMED (renamed Orion) is the largest of the council-owned electricity companies. The case study provides tentative insights into the effect of corporation and ownership structure on financial performance and funding of the entity over a period of time.
2. THEORETICAL FRAMEWORK
The research examines changes in the profitability and funding of electricity companies pre- and post-corporatisation and in the light of ongoing electricity reforms. It compares and contrasts the financial results achieved under three different organisation ownership structures – listed company, trust-held company, and local body (council) owned company.
There is no one theoretical framework within which to conceptualize such a study but rather there are strands of a number of theories. The corporatisation and privatization process and the introduction of a new group of stakeholders, namely shareholders, influenced the choice of accounting policies as the change in ownership resulted in a greater emphasis on profits and earnings per share as evidenced by the following statement from the Chairman of Power New Zealand (previously WEPB). “We recognize the need to continue improving the rate of return to shareholders….This will be a key objective in the years ahead” (Power New Zealand Ltd Annual Report, 1998, p.7). Changes in accounting policy and resulting changes in profitability and funding are, in part, a response to managers making self-interested choices. Newly-appointed managers may have perceived that benefits could be derived from measuring their performance from a low base (Thomson, 1993) and taken advantage of the opportunity to utilize discretionary accruals by shifting income to the post-corporatisation period and recording write-offs and increased depreciation in the pre-privatisation period. This deliberate exercising of accounting policy choice falls within the framework of positive accounting theory (Watts and Zimmerman, 1986) as the managers of electricity entities sought to “preserve” earnings for future years.
The agency theory aspect of positive accounting theory provides a framework for examining the economic incentives that could motivate management’s choice of accounting policies. Watts and Zimmerman (1986) include government regulation and political costs (e.g. income taxes) as suggested factors that would influence managers in their choice of accounting policies. Such choices may include revaluation of assets to give a lower rate of return in order to justify price increases or the use of ‘discretionary accruals’ (Healy, 1985). Agency theory would therefore lead us to expect changes in accounting practice during periods of environmental and regulatory change as experienced by the electricity entities examined in this research.
organization’s being and allows us to draw comparisons between the effectiveness of different organizational structures. In doing so, accounting serves to provide some evidence of changes that took place as the local body entities developed their corporate form. Accounting played a significant role in this development as evidenced in the following statement from a Government-appointed Chairman: “Net profit after tax on opening owners’ equity of 5.6% is not adequate to recompense the owners for their investment and the directors will be endeavouring to improve this return to a more commercially acceptable rate in the future. The Debt/Equity ratio of 15/85 is also very conservative and will need to be reassessed when corporatisation takes place” (Southpower Annual Report, 1990, p.5 and 7). As the electricity entities responded to external events, accounting became a factor in shaping the organization (Hopwood, 1983) and a means of expressing and influencing the objectives of each organization.
Consumers generally supported the old engineering based, cost-plus regime of the ESAs and perceived that the new profit-focused organizations would result in higher electricity prices. Those perceptions have been confirmed for domestic customers for whom electricity prices increased from 10.5 cents per kWh (in real terms) in 1988 to 12.9 cents per kWh in 2002. This represents a price increase of 22.9% for this group2. On the other hand, prices for commercial and industrial consumers decreased over the period (40% and 15% respectively in real terms). Because of their influence in the election process, domestic customers demanded (and got) low prices; commercial and industrial customers accepted higher prices as there was no alternative. As a result of corporatisation, domestic customers (87% of all users) lost control over the election of boards and directors. Management of the electricity companies chose to gain the approval of commercial and industrial users (using 65% of total electricity consumption) and reduced prices for this group.3
The change from local body entities to companies, and from an engineering culture to a business culture encompassing shareholder expectations, provided motivation for newly-appointed managers to maximize their personal objectives. Their choice of accounting policies influenced their ability to achieve those objectives. Thus this research can be framed to some extent by agency theory aspects of positive accounting theory. In addition legitimacy theory has been used to explain the behaviour of managers and the process of organizations adapting to a changing environment. Both theories acknowledge the interaction of organizations and their environment. Electricity industry reforms placed a number of conflicting pressures on managers as they sought to obtain legitimacy for their entities, and balance their own expectations with those of shareholders and consumers. These interactions took place within a sceptical and challenging environment.
3. ENTITY BACKGROUND
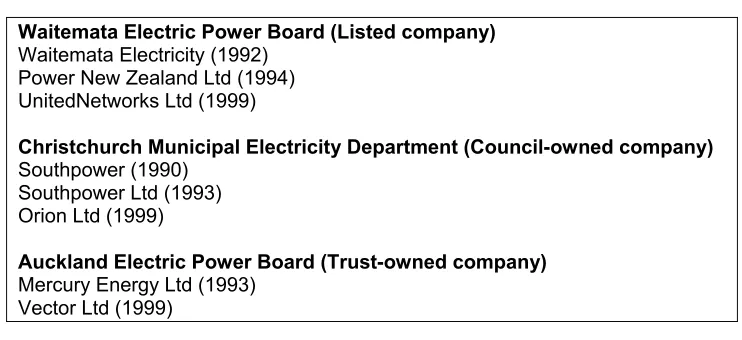
This section briefly highlights the changes that occurred over the 15 year period in each entity. The entities became corporatised during the period of the study and changed their names several times. Figure 2 shows those changes.
For the purposes of this study the entities will be referred to by the following: Listed company: WEPB/UNL
Council-owned company: CMED/Orion
2 In nominal terms the increase was 72.6%.
Trust-owned company: AEPB/Vector
Figure 2 – Entities in this study and their name changes
Waitemata Electric Power Board (Listed company)
Waitemata Electricity (1992) Power New Zealand Ltd (1994) UnitedNetworks Ltd (1999)
Christchurch Municipal Electricity Department (Council-owned company)
Southpower (1990) Southpower Ltd (1993) Orion Ltd (1999)
Auckland Electric Power Board (Trust-owned company)
Mercury Energy Ltd (1993) Vector Ltd (1999)
3.1 WAITEMATA ELECTRIC POWER BOARD/UNITED NETWORKS LTD (LISTED COMPANY)
Waitemata Electric Power Board commenced business in 1925 as a local body entity managed by a board of elected members. The entity continued in this form until the Energy Companies Act 1992 required it to be corporatised. WEPB changed its name to Waitemata Electricity. In July 1994 it merged with Thames Valley Power Board and changed its name to Power New Zealand Ltd. The corporatisation process was completed in early 1995 when the company listed on the New Zealand Stock Exchange. Free shares were issued to customers in the previous franchise area. Other shares were purchased by Utilicorp NZ Ltd as the cornerstone shareholder. As rationalization of the industry progressed, the company invested in other electricity companies. Following the passing of the Electricity Reform Act 1998 the company divested its retail business, retained its lines network business, and purchased other network companies. The company, renamed UnitedNetworks Ltd, became New Zealand’s largest network business providing services to approximately 30% of the country’s electricity consumers. Majority ownership (74%) was held by US based utility company, Utilicorp.
3.2 CHRISTCHURCH MUNICIPAL ELECTRICITY DEPARTMENT/ORION LTD (COUNCIL-OWNED)
business to TransAlta and kept its network business. The company changed its name to Orion New Zealand Ltd and purchased a gas network. By 2002 it had sold all of the gas business and focused on its core business; being an electricity network company serving the central South Island region.
3.3 AUCKLAND ELECTRIC POWER BOARD/VECTOR LTD (TRUST-OWNED)
Auckland Electric Power Board was a local body entity, managed by elected board members. It supplied electricity to domestic, commercial and industrial customers in and around Auckland city. During 1991/92 the organisation was reorganised by adopting a new structure and executive team. It took a number of commercial initiatives in order to prepare for the new deregulated corporate environment. The organisation became a company, Mercury Energy Ltd, on 1 October 1993. All the shares were issued to the Auckland Energy Consumer Trust (AECT) in consideration for the assets of the AEPB. AECT is governed by its own trust deed and holds the shares on behalf of Mercury Energy’s customers. The Trust appoints the Board of Directors. Trustees are elected by consumers every three years. During the rationalisation phase (the number of electricity companies was reduced from 62 to 33), Mercury Energy unsuccessfully attempted to purchase other electricity companies and gas networks. Most notable of these attempts was the aggressive takeover bid for shares in rival Auckland electricity company, Power NZ Ltd. The ownership battle intensified with Utilicorp owning 30.5% and Mercury Energy owning 33.1%. A joint venture arrangement was proposed but before it was finalized Mercury Energy had a massive breakdown in electricity supply to the Auckland central business district (CBD) and was forced to abandon its takeover efforts.
The 1998 Auckland CBD failure had a significant impact on the company results. Following the Electricity Reform Act 1998, the company sold its retail and generation business and kept the network business. It changed its name to Vector Limited and concentrated on re-establishing its profitability.
4. PERFORMANCE MEASURES
4.1 RETURN ON ASSETS (ROA) AND RETURN ON EQUITY (ROE)4
The US ownership of the listed company WEPB/UNL imposed a focus on growth and set targets for earnings per share. It was therefore expected that the commercial disciplines imposed by the market would result in a more aggressive approach by this company to achieving efficiencies and commercial rates of return. In addition, since the council owned company still had close ties with electricity consumers (ratepayers) we expected a less aggressive approach from the council owned company.
[image:14.612.93.504.260.459.2]4.1.1 WEPB/UNL(LISTED COMPANY)
Figure 3: Return on Assets and Return on Equity
-5% 0% 5% 10% 15% 20%
1988 1990 1992 1994 1996 1998 2000 2002
ROE ROA
Figure 3 shows the fluctuating nature of return on assets and return on equity over the study period. Considering those changes on a yearly basis we find that in 1990 gross margin dropped 6% and there was a 6% increase in operating expenses as compared to the previous year. The focus of the company began to change in 1991 from the previous objective “to minimise price to the customer” (Annual Report, 1991, p.3) to a commercial focus. Preparation for impending deregulation of the electricity supply industry continued in 1992 and the annual report of that year records the obligation of Government-appointed interim directors to conduct the enterprise “as a successful business” (Annual Report, 1992, p.1). This differed from the previous objective of delivering an acceptable monopoly service at reasonable cost. Despite a 3.8% increase in electricity sales (1991 to 1992), profits before tax dropped by over 98% as the company took what is commonly called a “big bath”: “We chose to bite the bullet in the 1991/92 financial year
4 ROA was calculated as Net Profit Before Interest and Tax/Average Total Assets and ROE was calculated
and clean out the Augean stables in compiling the annual accounts” (Chairman, Annual Report, 1992, p.3).
In line with its impending company status, Waitemata Electricity paid its first “dividend” in 1993 in the form of $15m of free electricity units given to customers. Return on assets rose in 1993 due in part to $8m from wholesale trading gains from an electricity shortage and to a change in accounting policy for capital contributions from customers. The decline in return on assets from 1993 to 1994 (from 6.6% to 3.1%) was partly the result of the increased asset base resulting from the company investing in other companies. Equity increased (by $77m) mainly due to an increase in the valuation of distribution assets. Once again a “dividend” was paid in the form of a rebate on electricity charged. Further restructuring costs brought the total costs of restructuring of the company over a three year period to $13.3m.
In acknowledgement of its full corporate status, the company paid its first cash dividend (15.5c per share) in the 1994/95 financial year. A 67% increase in gross margin contributed to a rise in profit before tax of 354% from the previous year despite expenditure of over $4m related to tactics to defend the company against a hostile takeover bid and a further $2.6m on share issue and energy sector reform costs. However an increase in return on assets was tempered by the purchase of shares in other electricity entities. The success of these mergers and alliances is evident in the increased profits after tax from 1995 to 1996 (260%) and the increase in dividends to 35.1c per share (60% of profits).
$1,906m (1999) to $2,261m (2000). Intangible assets (goodwill and rights) represented 35% of total long term assets in the 2000 financial year. The increase in return on assets in the final year, 2002, reflects the sale of fixed assets which reduced plant by $500m and intangibles by $343m. In addition profits increased primarily due to the gain on sale of these transactions. The variations in profitability over the research period reflect the ongoing restructuring of the business as required by industry legislation. The operating environment was extremely unstable, especially at the time of the unexpected passing of the Electricity Reform Act 1998. Throughout this period the company emphasis remained on increasing shareholder value. This was balanced by the need to be seen to be concerned for consumers, demonstrated by a three year capping of electricity line fees.
[image:16.612.91.504.301.525.2]4.1.2 CMED/ORION (COUNCIL-OWNED COMPANY)
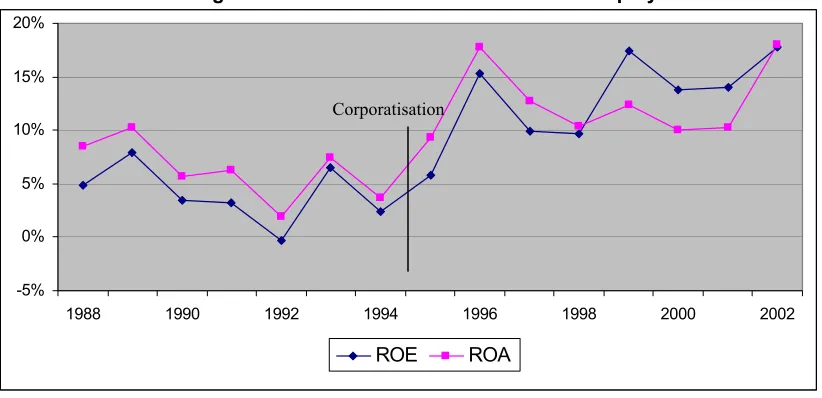
Figure 4 - Return on Assets and Return on Equity
0% 5% 10% 15% 20% 25% 30% 35% 40% 45% 50%
1988 1990 1992 1994 1996 1998 2000 2002
ROE ROA
Figure 4 shows that ROA and ROE remained relatively stable from 1988 to 2002 (except for 1999 and 2001). The two significant increases in ROA/ROE, 1999 and 2001, resulted from the sale of the retail assets (1999) and the sale of the gas networks (2001). These two transactions were concluded at a considerable profit and this was included in the net profit for the particular years. Average assets were lower as these assets were excluded from total assets in the relevant years. ROA/ROE did not follow the trend of the net profit margin (figure 7) which was consistently upwards. As already mentioned, the companies had to balance their returns taking regard of both the requirements of their shareholders and also of the light-handed monitoring of the performance
measure, accounting rate of profit5. CMED/Orion revalued its distribution system in 1992 and
again in 1997. In both cases this led to a lower ROA compared to previous years and the ROA then built up again from that level. In 2000 the network was revalued again, which led to a lower ROA than in 1998.
Since incorporation the company repatriated $650m to its shareholders in the form of dividends and the redemption of convertible notes. This represented a spectacular return to the shareholders (Christchurch City Council and Selwyn District Council) who started the joint venture by contributing assets worth $100m at the time and taking up $76m of convertible notes. The shareholders of the company used the dividends to reduce the rates charged to their ratepayers and/or to give a rebate on electricity bills to consumers in the area as evidenced by the following quote from the annual report: “Christchurch has the lowest rates in the country compared with similar cities” (Annual Report, 1998, p.10). In addition the company’s pricing policy was described as “designed to share profitability between customers and shareholders” (Annual Report, 1998, p.9). The relationship between the company, its shareholders and customers can be described as supportive6.
In 1998 CMED/Orion made an out-of-court settlement with regards to a court action brought against it by the Commerce Commission. In this action the Commerce Commission alleged that CMED/Orion used its monopoly (lines) business to subsidise its retail business and in that way made it difficult for other competing retailers to enter this market. Even though the matter was settled out of court, the company was sensitive to further criticism and chose to reduce its charges. This case provided support to the Government concerns about cross-subsidisation of business activities. Legislation passed in 1998 (Electricity Reform Act) was designed to prevent such cross-subsidisation.
4.1.3 AEPB/VECTOR (TRUST-OWNED COMPANY)
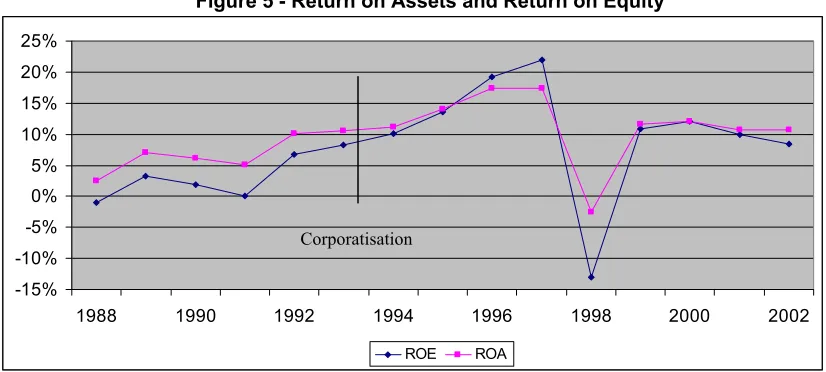
Overall, the company achieved an upward trend in ROA and ROE until the 1998 CBD crisis. The company reported negative ROE for 1988 (figure 5). Subsequently this improved, only to decrease to zero again for 1991. The reason in both years for the low figures is the very high tax figures in those years (176% in 1988 and 97% in 1991 of net profit before tax7).
5 Accounting rate of profit was replaced in the 1999 Electricity (Information Disclosure) Regulations by Return on Investment. The calculation of both performance measures includes revaluations in the numerator, with half the revaluations subtracted from the denominator.
6 In a residents’ survey in 1998, five years after the corporatisation of Southpower, there was overwhelming support for the Christchurch City Council retaining its shares in Southpower Ltd (Southpower Ltd Annual Report, 1998, p.6).
Figure 5 - Return on Assets and Return on Equity
-15% -10% -5% 0% 5% 10% 15% 20% 25%
1988 1990 1992 1994 1996 1998 2000 2002
ROE ROA
From 1992 ROE increased every year reaching a peak of 22% in 1997. ROA followed a similar trend, although ROA was always positive as it was calculated from earnings before tax. The increase in ROE/ROA was in line with increasing revenue, from $314m in 1988 to $577m in 1998. In 1996 and 1997 ROE was higher than ROA. These were years with comparatively higher debt levels and indicate that the company used gearing favourably.
The CBD crisis of 1998 cost the company $128m in that year. This impacted significantly on both ROE and ROA as the company made a loss before and after tax. The company provided for all possible expenses relating to this event (e.g. litigation costs) in 1998 and in subsequent years some of this provision proved to be unnecessary and was released back into profits. The CBD failure had the potential to force the company into liquidation but effective “damage control” measures in the form of full compensation to affected businesses restored its credibility and enabled it to increase ROA and ROE to over 10% in 1999.
During 1999 AEPB/Vector sold its retail and generation business. It also revalued its distribution assets for the first time adding $463m to both assets and equity. ROA/ROE figures of above 10% were achieved on improved profitability and a low tax rate (23%). AEPB/Vector also wrote back $17m on the CBD provision made during 1998, made a gain on the sale of associates and a loss on the sale of the retail assets which included unfavourable electricity hedge contracts. For 2000 revenue dropped another 51% but profitability was up because profits on the sale of assets and investments of $50m were included. During 2000 AEPB/Vector paid out a special dividend which was more than the revenue reserves available and led to negative retained earnings. This resulted in a peak for ROE (12%) and a declining ROE after that; ROE decreased to 8.5% for
2002. During both 2001 and 2002 the distribution assets were revalued downwards. This helped to bolster ROA during a period of falling profitability.
4.1.4 SUMMARY
Although in 1988 AEPB/Vector was a larger entity in terms of total assets than the other entities in the study, by 1998 the companies were of similar size in terms of total assets: WEPB/UNL $923m, AEPB/Vector $996m, CMED/Orion $983m. By 2001 the situation had changed and WEPB/UNL had total assets of $2.276 billion, AEPB/Vector had $1 billion, and CMED/Orion had $683m. WEPB/UNL had a strategic goal to become the largest network company in New Zealand and purchased other network businesses in order to achieve this aim. On the other hand, CMED/Orion chose to return capital to their shareholders after the sale of parts of their business ($650m returned over the study period).
Figure 4 highlights the stable profits of the local council-owned electricity company, CMED/Orion. Excluding the spikes in profit resulting from asset sales, the ROA over the period had a range of 6.5% to 10%. The average return over the period for CMED/Orion was 8.4% compared to 10.5% for the trust-owned company (AEPB/Vector) and 9.13% for the listed company (WEPB/UNL). All three companies have revalued their assets at least once and this has influenced their rate of return both in respect of higher asset values and increased depreciation costs.
All three companies increased ROA post-corporatisation compared to pre-corporatisation. The council-owned company had average ROA pre-corporatisation of 7.4% and 8.9% post-corporatisation (excluding the effects of asset sales in 1999 and 2001). The trust-owned company’s average ROA was 7% pre-corporatisation and this increased to 11.4% post-corporatisation. The listed company had a pre-corporatisation average ROA of 6.3% and an average ROA post-corporatisation of 12.6%. A similar pattern was observed in ROE. The council-owned company had average ROE pre-corporatisation of 4.4% and 6.5% post-corporatisation (excluding the effects of asset sales in 1999 and 2001). The trust-owned company’s average ROE was 3.2% pre-corporatisation and this increased to 10.3% post-corporatisation. For the listed company, the average ROE was 4% during the pre-corporatisation period with an increase to 13% post-corporatisation.
The rising ROA of the trust-owned company (until 1997) reflects these cost-cutting measures as well as increasing sales of electricity. For 2002 these two companies had similar ROA, reflecting a steady increase in ROA for the council-owned company but a drop in ROA for the trust-owned company.
The ROA performance measure reflects the amount of total assets of each company. The council-owned company had average total assets of $171m pre-corporatisation rising to $866m post-corporatisation. Of this, $334m is due to revaluation. Similarly, the trust-owned company had average total assets of $376m pre-corporatisation and $863m post-corporatisation. Their assets were revalued by $463m. On the other hand, the figures for the listed company are quite different. Average total assets pre-corporatisation were $163m and $1,385m post-corporatisation. Of this $353m is the result of revaluations. This reflects WEPB/UNL’s extensive purchasing of other electricity companies.
Each company has taken a different approach to mergers and acquisitions. The council-owned company initially combined with some of the small power boards in its region, then invested in a large gas company. The trust-owned company concentrated on acquiring WEPB/UNL but was eventually forced to withdraw from this bid. On the other hand, WEPB/UNL benefited from the synergies of a merger with another large electricity company soon after corporatisation and then went on to acquire shares in a number of other electricity companies and to purchase the network businesses of two large companies. With an overriding concern for creating wealth for the shareholders of the company, the achievement of profits was important in maintaining the company’s share price in the market and its ability to raise funds in the future.
The listed company had the lowest pre-corporatisation average ROA of 6.3% and the greatest increase in average ROA corporatisation to 12.6%, which was also the highest post-corporatisation average ROA. By contrast, the council owned company had a higher pre-corporatisation average ROA than the listed company (7.4%) but only achieved 8.9% post-corporatisation. This finding is in line with our expectations.
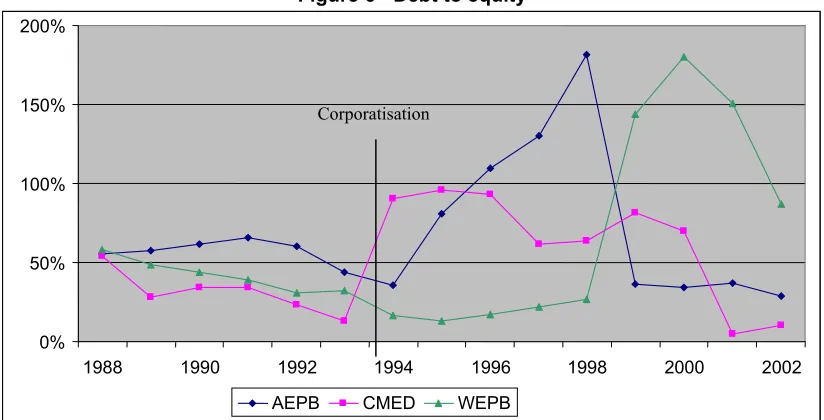
4.2 DEBT TO EQUITY
Figure 6 - Debt to equity
4.2.1 WEPB/UNL(LISTED COMPANY)
Figure 6 shows that debt levels reduced during the pre-corporatisation period from 58% in 1988 to 13% in 1995. After 1995 debt started increasing again. Debt increased from $32.7m in 1994 to $195m in 1998 but these increases are masked by increases in equity from the revaluation of the lines network. The purchase of the lines business of other companies was heavily financed by debt which rose from $195m in 1998 to $1.125 billion in 1999. Debt funding became the primary source of funds with gearing as high as 180% in 2000. This is a significant marker of the effects of deregulation and rationalization of the industry. The decrease in the debt/equity ratio in 2002 is the result of an increase in equity ($18m) from the sale of shares held in trust for the Employee Share Ownership Plan to another electricity company, Vector, as part of its acquisition of WEPB/UNL. In addition $495m of debt was repaid reducing the debt to equity ratio to 87%.
4.2.2 CMED/ORION (COUNCIL-OWNED COMPANY)
During the post-corporatisation years of 1994 to 2000 the company had much higher debt levels (average 63.5%) than during the pre-corporatisation period 1988-1993 (average 31%). The debt to equity ratio (figure 6) was 53% in 1988. It declined to around 30% in 1989 and remained there for the next few years. It then declined further to 13% in 1993 after the revaluation of the distribution assets and the repayment of some long-term liabilities. In 1994 (the end of the first financial year following corporatisation) the ratio increased to 91% following the purchase of a controlling interest in a gas network company for which loans of $145m were raised. During 1995 and 1996 the ratio went as high as 96% with further borrowings before declining again in 1997 to 61% following a second revaluation of assets. By 1999 the ratio had increased to 81%. Although
0% 50% 100% 150% 200%
1988 1990 1992 1994 1996 1998 2000 2002
AEPB CMED WEPB
1999 was the year the retail business (and name) was sold, the company also bought the minority interests in a gas network company. The years of very high debt (1994 – 1996) did not seem to impact negatively on the company and in fact ROE/ROA was higher in 1995 and 1996 than the other years. The ratio decreased in 2000 with the repayment of some debt and decreased to 5% in 2001 when the sale of the gas network was accounted for in the financial statements.
4.2.3 AEPB/VECTOR (TRUST-OWNED COMPANY)
AEPB/Vector had a debt to equity ratio of 56% in 1988 (figure 5). This ratio remained fairly consistent until 1992 after which it reduced to 36% in 1994 with the repayment of debt. The ratio rose to a high of 181% during 1998 when the company had to borrow money, mainly to finance the cost of the CBD crisis; and equity reduced because of the losses incurred in that year. For 1999 the figure reduced to 36% after the company sold its investments in associates and repaid a major part of its loans ($343m), combined with the significant increase in equity ($463m) brought about by the revaluation of its assets. The ratio decreased to 28% for 2002. The focus on debt repayment adversely affected the current ratio which decreased from 1.7:1 in 1999 to 0.3:1 in 2000. However, cash flows from operations were strong throughout this period. The big drop in the interest expense indicates that the company used interest free current liabilities to replace long-term liabilities and this led to the extremely low current ratio.
Comparing pre-corporatisation and post-corporatisation periods shows that in the post corporatisation period the debt to equity level reached its highest level of 180% (average 75%) and for four years was higher than ever before, but from 1999 to 2002 it was below 40%, which was lower than the pre-corporatisation period (average 57.5%).
4.2.4 SUMMARY
(1995) to 180.4% (2000). In comparison the trust-owned company ranged from 28.4% (2002) to 181.27% (1998).
The council owned company had a low of 4.56% (2001) and a high of 95.6% (1995). The more conservative approach adopted by the council-owned company is evidenced by its considerably lower debt levels. Its peak level of borrowing was $375m on an asset base of $1b (37%). This compares with borrowing of the listed company of $1.45 billion with assets of $2.3 billion (63%); and the trust-owned company of $454m with total assets of $996m (46%). This finding is in line with our expectations.
4.3 NET PROFIT MARGIN
[image:23.612.100.512.359.577.2]Thomson (1993) reports that a change from state ownership to shareholder ownership is likely to lead to a greater emphasis on profits and earnings per share as indicators of performance. Therefore it was expected that the net profit for the three companies would increase post-corporatisation and that the listed company would have the most aggressive approach.
Figure 7 – Net Profit Margin
-20% -10% 0% 10% 20% 30% 40% 50% 60% 70%
1988 1990 1992 1994 1996 1998 2000 2002
AEPB CMEB WEPB
4.3.1 WEPB/UNL(LISTED COMPANY)
As one would expect, this performance measure tracks that of Return on Equity. Prior to the introduction of government-appointed interim directors (1990), net profit margin (NPAT/Revenue) was on average 3.86%. From 1990 to 1994 the net profit margin was on average 2.39%. This was the period of the first round of industry restructuring when the entity changed from a local body to a company. From 1984 to 1995, expenses were over 90% of total revenue. After that
time (1996 to 2001) the proportion dropped to, on average, 77.5% due to management efficiencies and increasing electricity sales. Following the merger with another electricity company in late 1994, profits after tax began to increase markedly – by over 300% from 1994 to 1995 and by a further 260% from 1995 to 1996. By 2000 the company was the largest lines company in New Zealand and achieved its highest net profit margin to date (23.75%). This increased further to 26.49% the following year. This increase is in spite of interest costs of $96m and $102m respectively (compared to $6m in 1998 and an average of $2.5m in the 14 years prior to that). The 27% profit margin in 2002 is mainly due to profit on the sale of a part of the business ($128.6m) and to a reduction in interest cost following repayment of debt.
4.3.2 CMED/ORION (COUNCIL-OWNED COMPANY)
The profit margin follows a consistent upward trend (figure 7). Starting at only 2.5% in 1988 it rises to 3.5% in 1993 (pre-corporatisation) and after corporatisation in 1994 it was 5% rising to 11% in 2000 and 17% in 2002 (excluding once again 1999 and 2001). This consistent upward trend, and particularly the increases from 1998 (8%) to 2002 (17%) at a time when the company reduced its line charges three times (1% in 2000, 3.5% in 2001 and 5% in 2002) indicates the stability and profitability of the company. It also shows the much higher levels of profitability during the post-corporatisation period (average 8.5% - excluding 1999 and 2001) compared to the pre-corporatisation period (average 3%).
4.3.3 AEPB/VECTOR (TRUST-OWNED COMPANY)
The company reported a negative net profit margin (-0.66%) for 1988 (figure 7). It improved slightly after that and was close to zero in 1991 when AEPB restructured and prepared for the deregulated corporate environment. As already mentioned, the low after tax profit in 1991 is related to the relatively high tax paid in that year. It was only in 1993 that the margin increased to above 5% and it reached a high of 15.5% in 1997 before falling to negative 8.5% as a result of the losses from the CBD crisis. The margin recovered the next year and reached a high of 38% in 2000 when the company sold its retail assets and investments in associates. This higher level continued with the margin for 2001 being 33% and for 2002 it was 25.5%.
4.3.4 SUMMARY
The net profit margin for the three companies was much the same over the pre-corporatisation period. The average net profit margin over that period was 3% for both WEPB/UNL and for CMED/Orion, and 2.1% for AEPB/Vector. However, the average post-corporatisation figures reflect the trend shown in the ROA/ROE performance measures: CMED/Orion 8.5%; AEPB/Vector 14.8% (17.6% if 1998 excluded) and WEPB/UNL 20.2%. These figures ignore inflated profits from asset sales and clearly indicate the higher profitability of the listed company. This finding is in line with our expectations. The higher profitability of the listed company is also shown in the net profit after tax figures. CMED/Orion had NPAT ranging from $3m to $7.4m pre-corporatisation and $12m to $41m post pre-corporatisation. AEPB/Vector had a range from a $2m loss to a $21m profit pre-corporatisation, and a $48m loss (the CBD crisis) to $94m profit post-corporatisation. WEPB/UNL had NPAT ranging from a $4m profit to a $7m profit in the pre-corporatisation period. Post-pre-corporatisation, the range was $17m to $131m.
5. CHANGES IN ACCOUNTING POLICY
Accounting policy choice refers to managers selecting particular accounting methods when producing financial statements. Agency theory posits that managers will choose accounting policies that serve their best interests (Jensen and Meckling, 1976). As the electricity entities changed focus from providing a service at reasonable cost to reporting a rate of return which would satisfy owners (Baer and McDonal, 1998), it was expected that accounting policies would change to achieve a number of objectives including increasing reported profits. Thomson (1993) suggested that profit maximising policies are likely to be chosen by electricity utilities moving from state to shareholder ownership.
In this study, accounting policy changes were made for the following:
• Electricity Supply Association Code of Accounting Practice
• Capital contributions from developers
• Revaluation of assets and changed depreciation rates
• Tax effect accounting
• Underground conversions
• Amortisation policy
Electricity Supply Association Code of Accounting Practice
case of WEPB/UNL they included expensing the cost of maintaining distribution transformers (previously capitalised), accrual of interest on reserves and sinking funds (previously cash basis) and treating the interest as income rather than an increase in reserves. CMED/Orion and AEPB/Vector did not report specific details but noted that the changes reduced profit after tax by $417,306 and $7.5m respectively.
Capital contributions from developers
As the process of corporatisation progressed, WEPB/UNL changed its treatment of capital contributions made by property developers towards the cost of reticulation of subdivisions. Moving these amounts from the Balance Sheet to the Profit and Loss Statement in 1993 increased the profitability of the company by $1.29m. This approach was also taken by CMED/Orion in the financial year following corporatisation.
Revaluation of assets and changed depreciation rates
Profitability rates can vary from year to year because of asset revaluation. Corporatisation motivated a concern to record network assets at a more realistic value. WEPB/UNL and CMED/Orion revalued network assets using discounted cash flow methodology. Prior to this time all assets were recorded at historical cost. Although this revaluation did not increase profits it provided justification for the company to increase line charges to consumers in order to earn a commercial rate of return on the increased asset values. Emanuel (1984) suggests that companies may revalue assets in order to produce a lower rate of return than would otherwise be the case in order to produce evidence of “poor”performance.
In 1997 distribution network assets of both companies were again revalued (by $227m and $235m respectively). This time ODV methodology was used. ODV had previously only been used for calculating a return for regulatory purposes in terms of monitoring rates of return on assets for all companies on a comparable basis. The impact of the increased asset values on depreciation costs was mitigated by extending the useful life of the network assets. The trust-held company, AEPB/Vector took a more conservative approach and continued to report network assets at historical cost until 1999.
Tax effect accounting
back to the comprehensive method in line with the increasing emphasis on this method as the preferred accounting treatment under GAAP.
Underground conversions
Both CMED/Orion and AEPB/Vector initially expensed the costs of converting overhead lines to underground cables. The aim was to ensure that these expenses were tax deductible. However a later Inland Revenue Department ruling resulted in a policy change to capitalise these costs.
Amortisation policy
Following the acquisition of another electricity entity, WEPB/UNL recorded an asset labelled as Identified Intangible Assets ($534m). This was the difference between the purchase price of the acquired company and the ODV of the network. The company then set a 40 year time span for the writing off of this asset. A review of this policy for the 2002 financial year resulted in the amount being combined with the goodwill figure and amortisation changed to 20 years as required by GAAP.
It is posited that in the post- corporatisation period, most of these changes in accounting policies were driven by the need to maximise profits for shareholders. Prior to corporatisation this need did not exist.
6. CONCLUSION
This research has investigated three electricity companies in order to examine the possible influence of ownership type on the development and financial performance of the entities. It also provides evidence of performance pre- and post-corporatisation. The entities were initially not-for-profit with surplus income used to subsidise community based activities. The introduction of shareholders influenced a change in focus and a need to balance the needs of customers with those of shareholders.
that it was making profits which were deemed to be satisfactory having regard to capital employed. This involved price increases and cost cutting” (Collinge, 1999, p.7).
The comparison of four performance measures shows that at the end of the study period the council owned company was the smallest, in terms of total assets, of the three companies examined (although it was similar in size to the biggest one at the outset). The council owned company also returned most capital to its shareholders and is the most conservatively financed one of the three with only 10% debt at the end of 2002 compared to 28% for the trust-held company and 87% for the listed company. The listed company ended up being the biggest and the one with the highest gearing, the highest ROA and the highest profit margin.
The electricity entities have responded to a number of significant changes in their operating environment which have been imposed by legislation. The requirement to corporatise had a large impact on the previous local body entities. Some of this impact can be examined in theoretical terms. It is contended that all three entities in the study were faced with a need to legitimise their choice of ownership. The entities were also motivated by a desire to legitimise their operations. Consumers were concerned that the new organisations would focus on maximising profits for the benefit of shareholders. Companies were concerned to allay these fears and to promote a philosophy of sharing profitability between customers and shareholders. In line with legitimacy theory, which is a system-oriented theory, it is assumed that the entities in the study were influenced by the environment in which they operated and responded accordingly. The profit motive resulted in accounting policy changes that served to increase reported profits. The most significant of these were: treating capital contributions from developers as income rather than capitalizing them; using the partial method of accounting for deferred tax; and avoiding write off of intangibles. The revaluation of fixed assets has been used to justify increases in electricity prices with lower returns on assets. The identified accounting policy changes impose limitations on making pre- and post-corporatisation comparisons. Despite these limitations we conclude that financial performance of the entities in the study improved following corporatisation.
result of ongoing failure to supply electricity to the CBD. The company took steps to provide for future contingencies such as compensation claims in order to provide a basis for improved results in the following year when excess provisions were reversed.
REFERENCES
Baer, W., & McDonald, C. (1988). A return to the past? Brazil’s privatization of public utilities: the case of the electric power sector. The Quarterly Review of Economics and Finance, 38 (3), 503-523.
Boardman, A. E. & Vining, A. R. (1989). Ownership and performance in competitive
environments: A comparison of the performance of private, mixed, and state-owned enterprises. Journal of Law and Economics, 32: 1-32.
Bradbury, M. E. (1999). Government ownership and financial performance in a competitive environment: Evidence from the corporatization of the New Zealand Government Computing Services. Asia Pacific Journal of Management, 16, 157-172.
Chambers, S (2003). Privatisation big issue at Vector poll. The New Zealand Herald, 26 August, p.A8.
Cooper, D. & Sherer, M. (1984). The value of corporate accounting reports: arguments for a political economy of accounting. Accounting Organisations & Society, 9 (3/4), 207-232. Collinge, J. (1999). Mercury Energy Limited – Governance and the Power Crisis. Speech to
Auckland University Business School in the seminar series 1998 Power Crisis.
Deegan, C. (2002). The legitimising effect of social and environmental disclosures – a theoretical foundation. Accounting, Auditing & Accountability Journal, 15 (3), 282-311.
Emanuel, D. M. (1984). The information content of sign and size of earnings announcements: New Zealand evidence. Accounting and Finance, November, 25-43.
Foster, G. (1986). Financial Statement Analysis. Prentice-Hall, Englewood Cliffs, New Jersey. Healy, P. (1985). The impact of bonus schemes on the selection of accounting principles. Journal
of Accounting and Economics, April, 85-108.
Hopwood, A. G. (1983). On trying to study accounting in the contexts in which it operates.
Accounting, Organizations and Society, 8 (2/3), 287-305.
Jensen, M. C. & Meckling, W. H. (1976). Theory of the firm: managerial behaviour, agency costs and ownership structure. Journal of Financial Economics, October, 305,360.
Karpoff, J. M. & Rice, E. M. (1989). Organisational form, share transferability, and firm performance. Journal of Financial Economics, 3: 305-360.
Ministry of Economic Development (2003). New Zealand Energy Data File, Wellington
Spicer, B., Emanuel, D. & Powell, M. (1996). Transforming government enterprises. The Centre for Independent Studies Ltd.
Thomson, L. (1993). Reporting changes in the electricity supply industry and privatization.
Financial Accountability & Management, 9 (2), 131-157.
MASSEY UNIVERSITY
MASSEY RESEARCH ONLINE http://mro.massey.ac.nz/
Massey Documents by Type Working and Discussion Papers
The corporatisation of local body entities: A
study of financial performance
Hooks, J. J.
2003
http://hdl.handle.net/10179/2579