RESEARCH
Transcriptomic profiling and quantitative
high-throughput (qHTS) drug screening
of
CDH1
deficient hereditary diffuse gastric
cancer (HDGC) cells identify treatment leads
for familial gastric cancer
Ina Chen
1,2, Lesley Mathews‑Greiner
3, Dandan Li
1, Abisola Abisoye‑Ogunniyan
1,4, Satyajit Ray
5,
Yansong Bian
1, Vivek Shukla
1, Xiaohu Zhang
3, Raj Guha
3, Craig Thomas
3, Berkley Gryder
6, Athina Zacharia
1,
Joal D. Beane
7, Sarangan Ravichandran
8, Marc Ferrer
3and Udo Rudloff
1*Abstract
Background: Patients with hereditary diffuse gastric cancer (HDGC), a cancer predisposition syndrome associated with germline mutations of the CDH1 (E‑cadherin) gene, have few effective treatment options. Despite marked differ‑ ences in natural history, histopathology, and genetic profile to patients afflicted by sporadic gastric cancer, patients with HDGC receive, in large, identical systemic regimens. The lack of a robust preclinical in vitro system suitable for effective drug screening has been one of the obstacles to date which has hampered therapeutic advances in this rare disease.
Methods: In order to identify therapeutic leads selective for the HDGC subtype of gastric cancer, we compared gene expression profiles and drug phenotype derived from an oncology library of 1912 compounds between gastric cancer cells established from a patient with metastatic HDGC harboring a c.1380delA CDH1 germline variant and sporadic gastric cancer cells.
Results: Unsupervised hierarchical cluster analysis shows select gene expression alterations in c.1380delA CDH1 SB.mhdgc‑1 cells compared to a panel of sporadic gastric cancer cell lines with enrichment of ERK1–ERK2 (extracel‑ lular signal regulated kinase) and IP3 (inositol trisphosphate)/DAG (diacylglycerol) signaling as the top networks in c.1380delA SB.mhdgc‑1 cells. Intracellular phosphatidylinositol intermediaries were increased upon direct measure in c.1380delA CDH1 SB.mhdgc‑1 cells. Differential high‑throughput drug screening of c.1380delA CDH1 SB.mhdgc‑1 versus sporadic gastric cancer cells identified several compound classes with enriched activity in c.1380 CDH1 SB.mhdgc‑1 cells including mTOR (Mammalian Target Of Rapamycin), MEK (Mitogen‑Activated Protein Kinase), c‑Src kinase, FAK (Focal Adhesion Kinase), PKC (Protein Kinase C), or TOPO2 (Topoisomerase II) inhibitors. Upon additional drug response testing, dual PI3K (Phosphatidylinositol 3‑Kinase)/mTOR and topoisomerase 2A inhibitors displayed up to >100‑fold increased activity in hereditary c.1380delA CDH1 gastric cancer cells inducing apoptosis most effectively in cells with deficient CDH1 function.
© The Author(s) 2017. This article is distributed under the terms of the Creative Commons Attribution 4.0 International License (http://creativecommons.org/licenses/by/4.0/), which permits unrestricted use, distribution, and reproduction in any medium, provided you give appropriate credit to the original author(s) and the source, provide a link to the Creative Commons license, and indicate if changes were made. The Creative Commons Public Domain Dedication waiver (http://creativecommons.org/ publicdomain/zero/1.0/) applies to the data made available in this article, unless otherwise stated.
Open Access
*Correspondence: [email protected]
1 Thoracic and Gastrointestinal Oncology Branch, National Cancer
Institute, National Institutes for Health, CCR 4 West/4‑3740, 10 Center Drive, Bethesda, MD 20892‑0001, USA
Background
Hereditary diffuse gastric cancer (HDGC) is an auto-somal dominant cancer susceptibility syndrome due to germline mutations within the E-cadherin (CDH1) gene locus cadherin (CDH1; NM_004360) [1, 2]. HDGC is clinically defined by the familial occurrence of early-onset diffuse gastric cancer (DGC) and lobular breast cancer [2–4]. Of the 26,370 cases of gastric cancer expected to be diagnosed in the United States in 2016, 5 to 10 percent arise in a familiar context and about 34–45% of these are due to CDH1 germline mutations [4, 5]. CDH1 germline mutations are most commonly truncating CDH1 variants affecting the extracellular domains of the E-cadherin gene leading to loss of CDH1 expression, followed by missense and splice site variants and, infrequently, large genomic deletions [2]. CDH1 mutations are heterozygous and dis-persed across the 16 exons of CDH1 [6]. Hypermethyla-tion of the CDH1 promotor of the unaffected wild type allele and loss of heterozygosity are considered the most common second hit mechanisms of CDH1 inactivation and loss [7]. Male CDH1 mutation carriers have by the age 80 a cumulative incidence of gastric cancer of 70%, female mutation carriers a risk of 56% of gastric and 42% for lobular breast cancer [2]. Risk-reducing gastrectomy and breast MRI surveillance is currently advised for all patients with CDH1 germline gene mutations [4].
The natural history and clinical course of HDGC patients differs significantly from patients afflicted by sporadic gastric cancer: HDGC harbors a unique early stage (T1a) characterized by foci of intramucosal signet-ring cell carcinoma confined to the lamina propria [4, 8]. The number of these foci of early invasive cells may exceed one hundred and are thought to originate as an early event from displaced daughter cells of neoplastic cells with reduced CDH1 expression at the upper neck of gastric glands which have lost their physiological epithe-lial localization due to loss of cytoskeletal organization, cell plasticity and cell polarity [8, 9]. Further invasion beyond the gastric mucosa is associated with poor dif-ferentiation, Src kinase activation, and epithelial-to-mes-enchymal transformation [10]. While the natural history of these early intramucosal lesions is incompletely under-stood, it is thought that they might be relatively indo-lent and that there is, unlike in sporadic gastric cancer,
a latency period of possibly many years towards further progression [4]. Clinically, patients with advanced famil-ial gastric cancer and a genetic loss of CDH1 have a worse clinical outcome compared to patients with epige-netic silencing or no CDH1 alteration [11].
Despite these molecular, histopathological, and clini-cal differences, patients with HDGC receive, in large, the same, largely ineffective cytotoxic chemotherapy regimens as sporadic gastric cancer patients. In contrast, recent differential gene expression, synthetic lethality, and high throughput drug screening studies in isogenic E-cadherin deficient (−/−) breast MCF10A cells identi-fied several select genetic and pharmacological vulner-abilities in CDH1(−/−) mutant cells [12]. While some of the observed activity profiles in CDH1-deficient cells, like select sensitivities to Src kinase in the CDH1(−/−) mutant MCF10A isoform, were in line with early signal-ing perturbations observed in T1a cancers of gastrectomy specimens of HDGC patients, other signaling aberrations observed in clinical specimens later in the transition of invasion beyond the gastric mucosa, like FAK and STAT3 kinase activation, were not found to be associated with select drug sensitivities in the MCF10A CDH1(−/−) in vitro system [10, 12]. As the MCF10A CDH1(−/−) isogenic system captures predominantly early vulnerabil-ities with predominantly chemopreventative translational value, it is thus not known if the synthetic lethalities and drug sensitivities discovered to selectively occur in the CDH1(−/−) mutants capture vulnerabilities of E-cad-herin deficient gastric cancers in a more evolved stage which might harbor greater therapeutic value.
To develop new therapeutic strategies for HDGC patients, we compared drug sensitivity profiles derived from a dose response quantitative high throughput drug (qHTS) screens of 1912 oncology compounds between c.del1380A CDH1 gastric cancer cells derived from a HDGC patient, and wild type CDH1 gastric cancer cells derived from a sporadic gastric cancer patient. We com-bined the differential pharmacological responses with gene expression profiles between c.del1380A CDH1 and a cohort of sporadic gastric cancer cells. Increased ERK1/2 and phosphatidylinositol 4,5-bisphosphate (PIP2)-mediated signaling in c.1380delA CDH1 cells was accompanied by increased sensitivities to mTOR, Conclusion: Integrated pharmacological and transcriptomic profiling of hereditary diffuse gastric cancer cells with a loss‑of‑function c.1380delA CDH1 mutation implies various pharmacological vulnerabilities selective to CDH1‑ deficient familial gastric cancer cells and suggests novel treatment leads for future preclinical and clinical treatment studies of familial gastric cancer.
AKT, MEK, protein kinase C (PKC) and topoisomer-ase II (TOPO2) signaling inhibition. We also observed increased sensitivities to compounds belonging to ALK (Anaplastic Lymphoma receptor tyrosine Kinase), FAK and aurora kinase inhibitors, sensitivity to epidermal growth factor receptor (EGFR) and Janus Kinase (JAK) inhibitors in both c.del1380A CDH1 and sporadic gastric cancer cells, and relative resistance to BRD4 inhibitors in c.del1380A CDH1. Together, this study integrates tran-scriptomic aberrations with drug cytotoxic responses in patient-derived c.del1380A CDH1 HDGC versus CDH1 wild type sporadic gastric cancer cells providing new therapeutic leads for the difficult to treat CDH1 mutant familial subtype of gastric cancer.
Methods
Patient
The patient is a 44-year-old male who presented to the NIH surgical service for management of metastatic dif-fuse gastric cancer. All genetic counselling, clinical care, and interventions were carried out under Institutional
Review Board (IRB)-approved protocol NCI-09-C-0079 with patient providing written informed consent. His sis-ter and father were diagnosed with gastric cancer at the age of 44 and 72, respectively (Fig. 1). The patient, and other family members, previously underwent germline CDH1 mutation testing and found to harbor a heterozy-gous c.1380delA variant in the CDH1 locus. The patient had extensive ascites upon presentation. A palliative paracentesis was performed; cytological specimen was collected (6 L hemorrhagic ascites) and later used to establish the described patient-derived cell culture line of hereditary diffuse gastric cancer. Given the advanced stage of the patient’s cancer and his poor performance status, the patient and the NIH surgical team decided to opt for palliative care and the patient expired shortly thereafter.
Establishment of patient‑derived hereditary diffuse gastric cancer cell line
Cell suspensions created from the patient’s ascites were injected subcutaneously into female SCID mice (250,000
[image:3.595.57.539.353.685.2]cells per animal). When the tumor grew to approximately 2 cm2, xenografts were harvested, digested, and sus-pended in ultra-low attachment tissue culture flasks until formation of spheroid bodies was observed [13]. Tumor-derived spheroids were then dissociated, re-seeded onto standard tissue culture flasks and grown for several pas-sages in DMEM/F12 (Crystalgen, Commack, NY) with 10% HyClone fetal bovine serum (Thermo Scientific, Waltham, MA). Cells were passaged every 4–5 days by lifting them with 0.05% Trypsin (Gibco, Grand Island, NY), frozen after three passages, and not allowed to grow beyond 10 passaging cycles. For the spheroid assay, 1000 dissociated c.1380delA CDH1 SB.mhdgc-1 cells/mL were seeded in media conditions above in nonadherent 6-well plates coated with hydrogel (Corning Life Sciences, Chelmsford, MA) and spheroid formation observed for 6 weeks [13]. Media was replaced every 6–8 days.
Cell lines and reagents
Establishment of tissue culture line SB.msgc-1 at our institution was previously reported [14]. Gastric cancer lines SNU-1, SNU-5, SNU-16, KATO III, AGS, NCI-N87, and BxPC-3 and HeLa cells were purchased from ATCC (American Type Culture Collection (ATCC), Manas-sas, VA). Antibodies for immunofluorescence studies included mouse anti-E-cadherin primary antibody (BD Transduction Laboratories, San Jose, CA), CEA/CD66e antibody (Cell Signaling, Danvers, MA), mouse IgG2a, κ (BD Biosciences, San Jose, CA), mouse (G3A1) mAb IgG1 isotype control (Cell Signaling, Danvers, MA), and Alexa Fluor ® 488 goat anti-mouse IgG (H + L) antibody (Life Technologies, Frederick, MD). Etoposide, mitox-antrone, and PI-103 were purchased from SelleckChem (Houston, TX).
Spectral karyotyping
Metaphases of SB.mhdgc-1 cells were arrested by incu-bation with Colcemid (KaryoMax ® Colcemid Solution, Invitrogen, Carlsbad, CA) (10 μg/mL) 3 h prior to har-vest. Cells were collected and treated with hypotonic solution (KCL 0.075 M) for 15 min at 37 °C and fixed with methanol: acetic acid 3:1. Slides were prepared and aged overnight for use in SKY analysis and FISH. Meta-phases were hybridized with the 24-color human SKY paint kit (Applied Spectral Imaging Inc. (ASI), Carlsbad, CA) according to manufacturer’s protocol. Hybridization was carried out in a humidity chamber at 37 °C for 16 h. A post-hybridization rapid wash procedure was used with 0.4 × SSC at 72 °C for 4 min. Spectral images of the hybridized metaphases were acquired using a SD301 SpectraCubeTM system (ASI, Carlsbad, CA) mounted on top of an epi-fluorescence microscope Axioplan 2 (Zeiss, Thornwood, NY). Images were analyzed using Spectral
Imaging 6.0 acquisition software (ASI, Carlsbad, CA). A minimum of 10 mitoses of comparable staining intensity and quality was examined per cell line and analyzed for chromosomal abnormality.
Immunofluorescence microscopy
Approximately 50,000 were centrifuged onto a glass slide with Rotofix 32 A centrifuge (Hettich Lab Tech-nology, Tuttlingen, Germany) and fixed in methanol at room temperature for 2 min. Cells were permeabi-lized in 0.25% TritonX-100 and blocked with 5% normal goat serum in PBS at room temperature in a humidi-fied chamber for 2 h. Slides were incubated with mouse monoclonal anti-human E-cadherin and CEA/CD66e primary antibody, or mouse IgG2A κ or mouse G3A1 IgG1 isotype control overnight in 4 °C. Phosphoinositide signaling intermediaries were measured with anti-phos-phatidylinositol 4,5-bisphosphate (PIP2) (Cat. #Z-P045) and anti-phosphatidylinositol 3,4,5-trisphosphate (PIP3) (Cat. #Z-P345; Echelon Biosciences Inc., Salt Lake City, UT) monoclonal antibodies. Alexa Fluor® 488 goat anti-mouse IgG (H + L) secondary antibody was then applied for 1 h at room temperature. Slides were mounted with Vectashield/DAPI (Vector Laboratories, Burlingame, CA). Images were captured using a Zeiss LSM 510 UV (E-cadherin images) or Zeiss LSM 780 (CEA images) confocal microscope (Zeiss, Thornwood, NY).
CDH1 mutation testing
DNA (500 ng) from both spheroid cultures and SB.mhdgc-1 monolayer cells was performed using the previously described parallel sequencing OncoVar assay [15]. In brief, Illumina paired-end adaptors were ligated to ~300 bp genomic DNA fragments. Indexing and amplification was performed using Illumina PCR primers InPE1.0 and InPE2.0 and primer indices. Pooled, indexed libraries were captured using an Agilent SureSelect Cus-tom DNA kit targeting exons of 245 commonly mutated cancer genes (Agilent Technologies, Columbia, MD). Sequencing was done on Illumina’s Miseq sequencers. Variant calling was performed by Samtools mpileup and variants were annotated by the Annovar.
Gene expression analysis of microarrays
HumanHT-12 v4 Expression BeadChip (Illumina, San Diego, CA); array signal was normalized to expression levels of housekeeping genes and log2-transformed. Unsupervised hierarchical clustering analysis was con-ducted using GeneSpring v12.6 (Agilent Technologies, Columbia, MD). Per-probe normalization was applied by subtracting the log2 signal intensity of the median value for a specific probe from the log2 signal inten-sity of each cell line. Genes represented by more than one probe were collapsed by aggregating to the mean. Hierarchical clustering was then performed using GeneSpring default settings, specifically Euclidean similarity measures and Wards linkage rule. Analyze Single Experiment analysis option in the default Stand-ard Data Analysis Workflows was used for analysis. The default workflow options (Threshold: 0; p value: 1; Signals: both) were used for our analysis. Analyze networks (AN) algorithm with default metacore set-tings was used for generation of biological networks.
The networks were eventually prioritized based on the number of fragments of canonical pathways. The top network is shown in Fig. 2b.
Phospho‑immunoblot analysis
Gastric cancer cells were lysed with Cell Signaling lysis buffer (Cat#40–040, Millipore, Bellerica, USA). Pro-tein concentration was determined via BCA analysis kit (ThermoScientific, Waltham, USA). For phospho-immu-noblotting using p-ERK Thr202/Tyr204 (Cat#4376), p-AKT T308 (Cat#9275), p-PDK1 Ser241 (Cat#3438) approximately 50ug of protein was loaded, for total anti-ERK (Cat#9101), AKT (Cat#C67E7), PDK1 (Cat#3062), and actin (Cat#4967, all Cell Signaling, Danvers, USA) 5–10 µg, onto 4–20% SDS/Polyacrylamide gels. Proteins were transferred to nitrocellulose blotting paper via the dry HEP-OWL1 system (ThermoScientific, Waltham, MA). Bands were visualized via the Odyssey lumines-cence scanner (Li-Cor, Lincoln, USA).
a b
c d
200µm 200µm 200µm
200µm
e
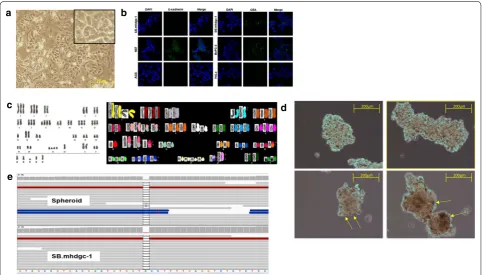
Fig. 2 Characteristics of patient‑derived c.del1380CDH1 SB.mhdgc‑1 cancer cells. a Light microscopy image of c.del1380 CDH1 SB.mhdgc‑1 cells
(10× magnification). b SB.mhdgc‑1 cells lack E‑cadherin expression but express CEA. Immunoflurescence of SB.mhdgc‑1 cells stained with anti‑E‑
cadherin (left) and anti‑CEA (right; both green), nuclei stained with DAPI (blue). Gastric cancer lines N87 and AGS (for E‑cadherin), BxPC3 and HeLa
cells (for CEA) shown as positive and negative controls. c Karyotype and SKY images of SB.mhdgc‑1 cells show features consistent with human
cancer cells including aneuploidy (such as in chromosomes 1 and 2) and chromosomal translocations (in chromosomes 3:5 and 4:8). d Light
microscopy of c.del1380CDH1 SB.mhdgc‑1 cancer cells grown under ultra‑low attachment conditions in FBS‑free media. Top (14 days of culture),
three dimensional multicellular spheroid (MCS) clusters with compact, amorphous center. Bottom (33 days of culture), c.del1380CDH1 SB.mhdgc‑1
spheroids have rounded up, became more compact, and formed basal membranes (arrows; 20× magnification). e Patient‑derived SB.mhdgc‑1 cells
harbor c.1380del CDH1 germline mutation. Deep sequencing of Hg19 CDH1 locus (chr16: 68,771,195‑68,869,444, NM_004360) in c.del1380CDH1
SB.mhdgc‑1 spheroids (top) and SB.mhdgc‑1 cells 2D monolayer cells (bottom); 40 base sequences of 14 genomic DNA fragments around c.1380 are
[image:5.595.57.540.335.610.2]Quantitative high‑throughput screening (qHTS)
High-throughput drug screening was conducted in patient-derived, low passage hereditary c.del1380A SB.mhdgc-1 gastric cancer cells and low passage SB.msgc-1 derived from a metastatic lesion of a ptient with sporadic gastric cancer; the methods have been described in detail previously [16]. In brief, assays were conducted in sterile, tissue culture-treated 1536-wells. A total of 500 cells per well in 5 μL of media were seeded. Immediately after dispensing the cells, 23 nL compound solution in DMSO was transferred using a Kalypsys (San Diego, CA) pintool. Plates were then covered and incu-bated for 48 h. 3 μL CellTiterGlo assay reagent (Pro-mega, Madison, WI) was added, plates were incubated for 30 min at room temperature, spun at 1000 rpm, and relative luminescence units (RLU) were quantified using a ViewLux Luminometer (PerkinElmer, Waltham, MA). The MIPE-oncology library 4.0 (MIPE: Mechanism Inter-rogation PlatE) contains 1912 compounds known to modulate oncology targets, pathways, and phenotypes. Additional file 1: Table S1 lists individual compounds, mechanisms of action, stage of development, structure, and acquisition information. Compounds were tested in dose–response curves starting at a final concentration 46 μM and threefold dilutions. The library was tested at 11 compound concentrations for qHTS as previously described [16, 17].
Hit selection from qHTS and reagents list
Activity of the compounds from the dose response qHTS screen was determined based on four dose response parameters: (1) % viability at the maximum concentra-tion of compound tested (MAXR) as a measure of com-pound efficacy; (2) logAC50 after a four-parameter fit of a complete drug response curve as a measure of com-pound potency; (3) curve response class (CRC) classifica-tion from dose response HTS, in which normalized data is fitted to a 4-parameter dose response curves using a custom grid-based algorithm to generate curve response class (CRC) score for each compound dose response [17, 18]. CRC values of −1.1, −1.2, −2.1, −2.2 are consid-ered highest quality hits; CRC values of −1.3, −1.4, −2.3, −2.4 and −3 are considered inconclusive hits; and a CRC
value of 4 are inactive compounds; and 4) Area Under the Curve (AUC), which is calculated using the trapezoidal rule over all measured responses [19]. (see Additional file 2: Table S2, for list of MAXR, logAC50, CRC, AUC, for the compounds screened in each cell line).
Target enrichment analysis
Following selection of active compounds, we identi-fied the annotated targets for these compounds and computed the enrichment for each target, compared to
background, using Fishers exact test [20]. For this test, the background was defined as all the targets annotated in the MIPE collection. The p value from the test was adjusted for multiple hypothesis testing using the Benja-min–Hochberg method [21].
Cell viability assay drug‑response profiles
The effects of select small molecule inhibitors and chem-otherapy agents identified from the qHTS on prolifera-tion were tested by seeding 5000 cells per well in 96-well plates and incubating them for 24 h before addition of drug. Increasing concentrations of drug were added to the wells in three replicates with DMSO as negative control. Plates were analyzed 72 h after addition of drug using the Promega Cell Titer Glo assay reagent (Pro-mega, Madison, WI). Plates were read with GloMax® 96 Microplate Luminometer (Promega, Madison, WI), and the data analyzed using SoftMax version 5 and GraphPad Prism version (La Jolla, CA). Percent cell viability was calculated by normalizing raw luminescence values to vehicle-control (DMSO-treated) samples.
Apoptosis assay
Increasing concentrations of P-103, etoposide, and mitoxantrone (all Selleck Chemicals, Houston) were added to 5000 cells seeded the day prior in 96-well plates in three replicates with DMSO as negative control. Plates were analyzed 24 h after addition of drug using Caspase-Glo® 3/7 Assay System (Promega, Madison, WI). Plates were read with GloMax® 96 Microplate Luminometer (Promega, Madison, WI), and the data analyzed using SoftMax version 5 and GraphPad Prism version 7 (La Jolla, CA). For cell cytometric apoptosis measurements using fragmented DNA the template-independent addi-tion of bromolated deoxyuridine triphosphates (Br-dUTP) to free 3′-hydroxyl (OH) termini of double- and single-stranded DNA was determined using the Apo-BrdU Kit (Cat. No. 51-6536KK; BD Biosciences, San Jose, CA). 1 × 10⁶ cells were plated, the following day DMSO, PI-103, etoposide, and mitoxantrone were added and incubated for 24 h. Cells were harvested and stained with FITC-labeled anti-BrdU monoclonal antibody accord-ing to the manufacturers instruction. Non-apoptotic (no Br-dUTP was detected) and apoptotic populations were measured on a BDFacsAriaII flow cytometer (BD Bio-sciences, San Jose, USA).
Cell adhesion assay
MA), and 96-well plates coated with vitronectin (R&D Systems, Minneapolis, MN). Cells were seeded in six replicates at 1.0 × 10⁵ cells per well in 24-well plates and 2 × 10⁴ cells per well in 96-well plates and two independ-ent cell counts in Nexcelom Auto T4 Hemacytometer cell chambers (Nexcelom, Lawrence, MA) were obtained. Time course ratios of adherent versus floating cells were graphed using GraphPad Prism version 7 (La Jolla, CA).
Results
Characteristics of hereditary diffuse gastric cancer c.del1380A CDH1 mutant SB.mhdgc‑1 cells
The patient is a 44-year old male who presented for management of metastatic diffuse gastric cancer. His sister and father were diagnosed with diffuse gastric cancer at the age of 44 and 72, respectively (Fig. 1). The patient, and other family members had been previously tested for germline CDH1 mutations and found to har-bor a heterozygous c.1380delA variant in exon 10 of the CDH1 locus. The protein product is a 480-amino acid long (P461Lfs*20) variant of CDH1 (Additional file 3: Figure S1), and is predicted to be disease causing and subject to nonsense-mediated RNA decay by Mutation-Taster and SIFT prediction leading to loss of expression. A palliative paracentesis was performed; cytological conformation of cancer cells was confirmed and used to establish the c.1380delA CDH1 SB.mhdgc-1 cancer cell line.c.1380delA CDH1 SB.mhdgc-1 grow as a pleiomor-phic, irregular shaped cells monolayers to near conflu-ency (Fig. 2a). Cells displayed considerable heterogeneity without one morphological phenotype becoming domi-nant after repeat passaging (>20 passages). Cells are able to raise daughter cells and cell islands both in early (<5), as well as later passages. Doubling time was prolonged between 72 and 84 h. Immunocytochemical staining shown in Fig. 2b demonstrates loss of E-cadherin expres-sion in c.1380delA CDH1 SB.mhdgc-1 cells and strong (≥90% of cells) expression of the gastrointestinal tissue marker glycoprotein CEA. Multiple SKY karyotyping shows a diploid karyotype with frequent chromosomal aberrations including losses, duplications, and trans-locations typically observed in cancer (Fig. 2c). Several translocations were validated by FISH, Additional file 1: Table S1 summarizes the main detected chromosomal abnormalities. We assessed next the ability of mono-dispersed c.1380delA CDH1 SB.mhdgc-1 gastric cancer cells to self-assemble and form multicellular spheroids (MCS), both as a measure of their self-renewal ability and tumorigenicity as well as to investigate the possible impact the loss of CDH1 might have on self-aggregation and the ability to form cell-to-cell contact. Figure 2d shows different phases of MCS grown from c.1380delA CDH1 SB.mhdgc-1 cells over 6 weeks. To confirm that
MCS and 2D monolayer cells maintained the same CDH1 genotype, we performed deep sequencing using the CLIA-approved OncoVar assay in both spheroids as well as monolayer c.1380delA CDH1 SB.mhdgc-1 cells confirming the unique c.1380delA CDH1 variant in both subpopulations (Fig. 2e). c.1380delA CDH1 SB.mhdgc-1 cells initiated tumors upon implantation into nude mice which failed to grow beyond 5 mm (4 months). All fol-lowing experiments, including drug screening, were per-formed with c.1380delA CDH1 SB.mhdgc-1 cells grown as monoloyer.
The detection of the previously affirmed germline c.1380delA CDH1 germline variant in the derived cells, the loss of E-cadherin in combination with features of malignant transformation suggests the establishment of a de novo primary cell culture line from a patient with HDGC.
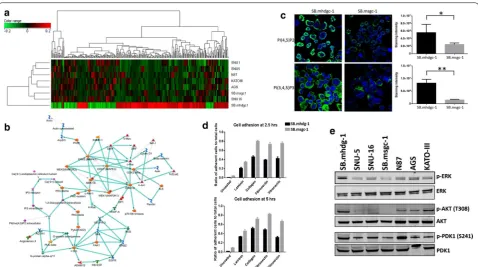
Gene expression analysis of c.1380delA CDH1 mutant SB.mhdgc‑1 cells shows upregulated ERK1‑ERK2 and inositoltrisphosphat (IP3)/diacylglycerol (DAG) signaling in comparison to sporadic gastric cancer cells
canonical pathways with networks are prioritized based on the number of fragments of canonical pathways on the network. Figure 3b shows the top ranked ERK1/ERK2 network (gScore 112.87; zScore 10.37; p value 1.23e-05) with MAPK pathway, inositol triphosphate (IP3)/diacyl-glycerol (DAG), and alternative erb receptor signaling via FAK, c-Src, or protein kinase C most prominently enriched. Other secondary networks represented in gene expression profile of c.1380delA SB.mhdgc.-1 gas-tric cancer cells include cytoskeletal regulators like actin, paxillin, or β-catenin.
To confirm above signal transduction aberrations observed on differential gene expression profiling of c.1380delA SB.mhdgc.-1 and sporadic gastric cancer cells, we first measured intracellular phosphatidylino-sitol 4,5-bisphosphate (PIP2) levels, and its metabo-lite phosphatidylinositol 3,4,5-trisphosphate (PIP3),
as intermediaries of inositoltrisphosphat (IP3)/diacyl-glycerol (DAG) signaling between c.1380delA CDH1 SB.mhdgc-1 and sporadic SB.msgc-1 gastric cancer cells. SB.msgc-1 cancer cells were derived from a left liver lobe lesion of metastatic sporadic, moderately to poorly differentiated adenocarcinoma of the stomach with intestinal and signet ring cell features of a 44-years old female and has been previously described [14]. Tumor cells stained positive for Ecadherin and strongly posi-tive (3+) for HER2 (Additional file 5: Figure S3).
Lev-els of intracellular phosphoinositide metabolites were measured by quantitative immunofluorescence using anti-lipid phosphoinositide antibodies (Fig. 3c). Phos-phatidylinositol 4,5-bisphosphate (PI(4,5)P2) is a sub-strate for phospholipase C–G-protein coupled receptor pathway signaling intimately involved in intracellular calcium release and overall phosphoinositide metabolism Fig. 3 c.1380delA CDH1 SB.mhdgc‑1 harbors select transcriptomic alterations compared to sporadic gastric cancer cells. a Unsupervised hierarchi‑ cal cluster analysis and associated heat map of baseline transcriptomic profiles. Columns represent individual probes while rows represent individual cell lines. The color of each probe reflects log2 ratio of normalized expression values for each cell line compared to the median from all cell lines (see
scale, top 200 upregulated and 100 downregulated (FC > 2; p < 0.05) in c.1380delA CDH1 SB.mhdgc‑1 shown). b Most relevant network selective
for SB.mhdgc‑1 cells by GeneSpring GX analyze networks (AN) algorithm using shortest paths algorithm with main parameters (1) relative enrich‑
ment and (2) relative saturation of networks with canonical pathways. Networks are prioritized based on the number of fragments of canonical
pathways in the network. c c.1380delA CDH1 SB.mhdgc‑1 gastric cancer cells harbor increased phosphoinositide‑derived messengers. Immuno‑
fluoresence of SB.mhdgc‑1 and sporadic SB.msgc‑1 gastric cancer cells measuring anti‑phosphatidylinositol 4,5‑bisphosphate (top) and anti‑phos‑
phatidylinositol 3,4,5‑trisphosphate levels (bottom). Mean of staining intensity normalized to DAPI of 100 cells of SB.mhdgc‑1 and SB.msgc‑1 shown
on the right. d Reduced cell adhesion including extracellular matrix substrate adhesion of c.1380delA CDH1 SB.mhdgc‑1 versus SB.msgc‑1 cells.
Time course of ratios of adherent versus non‑adhered cells (student’s t test; two images were acquired of each triplicate and the mean taken). e
[image:8.595.59.538.86.353.2][22]. Phosphatidylinositol 3,4,5-trisphosphate (PI(3,4,5) P3)) is formed by PI 3-kinase. PI(4,5)P2 levels, and to a lesser degree, PI(3,4,5)P3 intermediaries were meas-ured elevated in c.1380delA SB.mhdgc.-1 gastric can-cer cells compared to SB.msgc-1 sporadic gastric cancan-cer cells (Fig. 3c) commensurate with findings of compara-tive gene expression profiling of hereditary c.1380delA SB.mhdgc.-1 cells. To examine if detected transcriptomic perturbations in cytoskeletal regulation in hereditary c.1380delA SB.mhdgc-1 cells measured by Gene Ontol-ogy (GO) cellular process analysis and Analyze Net-works (AN) algorithm might result in altered adhesion function, we compared next the ability of c.1380delA SB.mhdgc.-1 gastric cancer to SB.msgc-1 cells to adhere on regular non-treated tissue culture flasks, and then examined rescue by repeating adhesion experiments on plates coated with extracellular matrix molecules includ-ing collagen I, fibronectin, and laminin. When measur-ing the ratio of adherent versus non-adherent cells at 2.5 and 5 h after seeding of cells, adhesion of c.1380delA CDH1 SB.mhdgc.-1 gastric cancer cells was substan-tially reduced compared to CDH1 wild type sporadic SB.msgc-1 cells. The presence of extracellular matrix adhesion molecules rescued impaired adhesion of c.1380delA CDH1 SB.mhdgc-1 cells, albeit significantly less compared to SB.msgc-1 sporadic gastric cancer cells (Fig. 3d). We next measured signaling activity of the PI3K-AKT and MAPK pathway in hereditary c.1380delA CDH1 SB.mhdgc.-1 gastric cancer cells versus a panel of sporadic gastric cancer cell lines by determining ratios of phosphorylated Akt, PDK1, and ERK1/2 (MAPK42/44) to total Akt, PDK1, and ERK kinase levels. Phospho-ERK-to-total ERK, and phospho-Akt-to-total AKT ratios were elevated in c.1380delA CDH1 SB.mhdgc.-1 gastric cancer cells compared to a panel of six heterogenous spo-radic gastric cancer lines (Fig. 3e), a finding in line with above gene set enrichment analysis identifying ERK1/ ERK2 network as top network enriched in SB.mhdgc-1 cells. Albeit not different to sporadic gastric cancer cell lines N87 and SNU16, c.1380delA CDH1 SB.mhdgc-1 cells showed activation of the Akt-upstream regulator and PIP3 sensor 3-phosphoinositide dependent protein kinase-1 (PDK1, measured as serine 241 phosphoryla-tion), a finding consistent with elevated PIP3 levels in SB.mhdgc-1 cells compared to SB.msgc-1 cells.
Overall, select signal transduction alterations in c.1380delA CDH1 SB.mhdgc-1 gastric cancer cells derived from differential gene expression profiling, phos-phoinositide intermediary level measures, and immuno-blotting suggest perturbations in MAPK kinase pathway, phosphoinositide-mediated signaling, as well as extracel-lular matrix adhesion dysfunction enriched in c.1380delA
CDH1 SB.mhdgc-1 gastric cancer cells compared to spo-radic gastric cancer cell lines.
Dose response quantitative high‑throughput screening of c.1380delA CDH1 SB.mhdgc‑1 and sporadic gastric cancer cells SB.msgc‑1 with an oncology library identifies selective pharmacological vulnerabilities in hereditary diffuse gastric cancer cells
were significantly different between c.1380delA CDH1 SB.mhdgc-1 and SB.msgc-1 cells: while topoisomerase II and AKT inhibiting agents were identified as preferen-tially active, some of the previously differently observed drug classes like MEK, protein kinase C, or ALK inhibi-tors were not measured as different activity profiles in the two cell lines (Additional file 7: Figure S5B) when using logAC50. When applying the most stringent cri-teria for drug activity by combining both cricri-teria high quality drug response curve (drugs yielding high quality CRCs including −1.1, −1.2, −2.1, and −2.2) and potency
(Δ-log[AC50] (SB.mhdgc-1–SB.msgc-1) < 1) and com-paring drug activity profiles between c.1380delA CDH1 SB.mhdgc-1 and SB.msgc-1 cells, compounds target-ing mTOR, PI3KCA, and AKT1 were significantly (p value < 0.01) enriched as selectively active in hereditary diffuse gastric cancer versus sporadic SB.msgc-1 cells (Additional file 8: Figure S6A). Box plots showing the logAC50 distribution of logAC50 for the compounds of targets showing enrichment as being more selec-tively potent for c.1380delA CDH1 SB.mhdgc-1 shown in Additional file 8: Figure S6B identifies activities of
anti-mTOR, topoisomerase II, and tubulin inhibitors as most different between the two cell lines. Since dysregu-lated gene expression of druggable targets can indicate dependency, and possibly pharmacological vulnerability in affected cells, we overlaid differential drug phenotype and gene expression changes (fold difference) between c.1380delA CDH1 SB.mhdgc-1 and SB.msgc-1 cells of known direct druggable targets of any of the compounds represented in the MIPE 4.0 Oncology Library. Only 52 of the direct targets of compounds in the MIPE collec-tion showed greater than twofold difference in expres-sion levels between c.1380delA CDH1 SB.mhdgc-1 and SB.msgc-1 cells. Using difference in potency (delta logAC50) and maximum response percent viability upon treatment of both cell lines shown as overlaid boxplots in Additional file 8: Figure S6C, the most distinct cor-relations between dysregulated genes and pharmaco-logical profile of c.1380delA CDH1 SB.mhdgc-1 versus SB.msgc-1 cells included anti-topoisomerase II and anti-microtubule (TUBB) regulation. As the above dif-ferential screening approach missed common pharma-cological vulnerabilities shared between c.1380delA a
Max Response SB.mhdgc-1
Max
Re
sponse
SB.msgc-1
130 120 110 100 90 80 70 60 50 40 30 20 10 0
0 10 20 30 40 50 60 70 80 90 100 110 120 130 140
MaxResponse <30% for both cell lines (314 compounds)
PSMD 1 EGFRHDAC
1 JAK2
BCL2L 1 AR ITK
CCR5CDK4 TXNR
D1 STAT
3 PDE5
A 0
2 4 6
Target Class
-lo
gp-va
lu
e
b
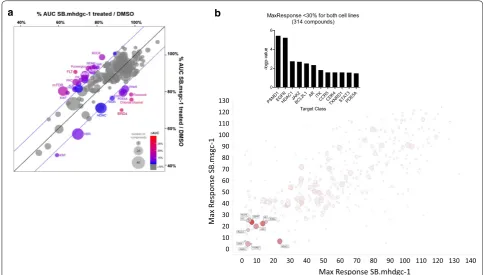
Fig. 4 Comparative quantitative high‑throughput screening (qHTS) using compounds from the MIPE Oncology 4.0 library identifies compounds
with preferential activity against c.del1380A CDH1 SB.mhdgc‑1 cells compared to SB.msgc‑1 gastric cancer cells. a Bubble diagram of drug phe‑
notypes by compound class of SB.mhdgc‑1 versus SB.msgc‑1 cells depicting class activities (number of compounds per drug class) measured by
area under the curve (AUC) (drug class activities ≥2 standard deviations from the mean of ΔAUC(% AUC(c.1380delA SB.mhdgc‑1/SB.msgc‑1) being
[image:10.595.55.539.88.363.2]CDH1 SB.mhdgc-1 and SB.msgc-1 cells, which may harbor valuable future therapeutic leads, we also exam-ined activities screen results for active hits present in both cell lines using MAXR. There were a total of 314 compounds which ≥70% complete cell killing at high-est drug concentration (Fig. 4b). Classes with significant enrichment (number of active compounds in a target class relative to the total number of compounds for that target class; computed enrichment for each target, com-pared to background, using Fishers exact test; p < 0.01) included anti-EGFR and JAK2 inhibitors (Fig. 4b).
In summary, hereditary c.1380delA CDH1 SB.mhdgc-1 have select pharmacological vulnerabilities which, in part, align with signal transduction perturbations and gene expression alterations detected in these cells.
Validation of candidate active compounds in c.1380delA CDH1 SB.mhdgc‑1 cells
Based on both the enrichment profile of preferentially active drugs as well as gene expression and signal trans-duction aberrations in c.1380delA CDH1 SB.mhdgc-1 gastric cancer cells, we selected the dual PI3K/mTOR inhibitor PI-103 and the topoisomerase II inhibitors etoposide and mitoxantrone as leads for further follow-up. One of the other candidates targeting microtubule assembly and disassembly, anti-tuberin agent taxane, is already used in the management of advanced gastric cancer, including in hereditary diffuse gastric cancer, and we elected not to extend studies on this class of agents further. We first aimed to validate the increased activity of the dual PI3K/mTOR and topoisomerase II inhibitors in hereditary c.1380delA CDH1 SB.mhdgc-1 gastric can-cer cells in an extended panel of sporadic gastric cancan-cer cell lines. Figure 5a shows full 10-point dose response curves of PI-103, etoposide, and mitoxantrone confirm-ing select sensitivity of hereditary c.1380delA CDH1 mutant SB.mhdgc-1 gastric cancer cells compared to most sporadic gastric cancer cells (up to 100- to 1000-fold lower GI50 measurements compared to SNU-16 or SB.msgc-1 cells). Next, we examined apoptosis levels upon treatment in c.1380delA CDH1 SB.mhdgc-1 and sporadic gastric cancer lines. Levels were initially meas-ured via a caspase-3 and 7 chemoluminescence screening assay at 1 µmol drug treatment which showed elevated levels of activated caspase-3 and -7 in c.1380delA CDH1 SB.mhdgc-1 cells (Additional file 9: Figure S7). Flow cytometry analysis of cell death measured by labeling DNA breaks with FITC-dUTP confirmed increased frac-tion of BrU positive cells in mitoxantrone, etoposide, and PI-103-treated hereditary c.1380delA CDH1 mutant SB.mhdgc-1 gastric cancer cells showed increased cell death compared to sporadic gastric cancer cells (Fig. 5b). These findings, in line with results of above qHTS screen
result, may hence provide possible leads for future pre-clinical, and pre-clinical, studies.
Discussion
Recent large-scale molecular subtyping efforts have opened novel individualized treatment avenues for gas-tric cancer [23–25]. For example, patients with meta-bolic subtype of gastric cancer derived from large gene expression profiling of multiple cohorts of clinical gas-tric cancer specimens show improved clinic outcome upon treatment with 5-FU [23]. While cancer cells of the metabolic subtype were measured more sensitive to 5-FU, gastric cancer cells of the mesenchymal sub-type responded to a greater degree to PI3K/mTOR inhi-bition [23]. Similarly, the recently released data from The Cancer Genome Atlas (TCGA) initiative suggests genomically defined leads, for example, of increased sen-sitivity to receptor tyrosine kinase or cell cycle modulat-ing agents in the chromosomal unstable (CIN) identified gastric cancers, or increased sensitivity to PI3K kinase, JAK2, and immune checkpoint blockade in the EBV posi-tive subtype [25]. In contrast, leads for drug sensitivities unique to familial gastric cancer due to germline CDH1 mutations are to date largely derived from a synthetic lethality and drug screen in an isogenic CDH1 knock-out breast fibroblast model (MCF10A CDH1(−/−)) [12], CDH1-negative systems overexpressing wild type ver-sus mutant forms of CDH1 [26, 27], or correlative tissue studies of the early unique T1a lesions of prophylactic gastrectomy specimens [8, 10]. That hereditary diffuse gastric cancer (HDGC) due to germline CDH1 variants, and sporadic gastric cancers with somatic CDH1 pertur-bations are unique subtypes of gastric cancer, likely to harbor different drug sensitivity profiles and hence offer opportunities for genotype-directed personalized treat-ment approaches, is supported by a number of observa-tions; for example, in a detailed CDH1 profiling effort of 174 sporadic and 72 familial gastric cancer specimens Corso et al. reported significant differences in clini-cal outcomes depending on presence and type of CDH1 alternation with the worst survival rates observed across all examined gastric cancers in cases with structural CDH1 defects and in particular in familial tumors [11]. Or, eleven percent of the 205 primary gastric adenocar-cinoma, examined as part of the TCGA effort, harbored somatic mutations in the CDH1 gene, which occurred nearly exclusively in the genomically stable (GS) gastric cancer subtype (37% of GS cases) which, by far, com-prised of the largest number of cancers with diffuse his-tology [25].
an HDGC patient with a c.1380delA CDH1 truncating germline mutation leading to loss of CDH1 expression, and compared the transcriptomic profile and drug sen-sitivity profile of these cells to a panel of sporadic gas-tric cancer cells. GO analysis identified upregulation of ERK and phosphoinositide-mediated signaling network
processes in hereditary c.1380delA CDH1 SB.mhdgc-1 gastric cancer cells which showed selective sensitivities to different drug classes including mTOR, MEK as well as c-Src, FAK, or topoisomerase II inhibiting agents. These findings of select drug response profiles of heredi-tary SB.mhdgc-1 gastric cancer cells to MEK and mTOR Fig. 5 c.1380 CDH1 SB.mhdgc‑1 gastric cancer cells show vulnerabilities to toposisomerase II and PI3K/mTOR inhibition. a Drug response curves of a panel of gastric cancer cell lines treated with a range of concentrations of mitoxantrone, etoposide (both TOPO2A inhibitors), or PI‑103 (dual class IA phosphatidylinositol 3 kinase/mTOR inhibitor) for 72 h. X-axis indicates log [concentration] tested, y-axis indicates cell viability percentage nor‑ malized to vehicle‑control samples. Mean cell viability values are plotted with standard error of the mean (SEM) from at least 2 independent experi‑
ments done in triplicate. b Rate of apoptosis induced by 24‑h treatment of 1 µM etoposide, mitoxantrone, or PI‑103 normalized to DMSO‑treated
samples in sporadic gastric cancer SNU‑16 and hereditary c.1380delA SB.mhdgc‑1 cells. Flow cytometry profiles of FITC‑labeled anti‑BrdU staining of
[image:12.595.58.531.87.548.2]inhibition, in combination with gene expression dysregu-lation of ERK and phosphoinositide-mediated signaling networks, also appear to be in line with elevated phos-pho-ERK: total ERK and phospho-Akt (T308): total Akt ratios observed as a measure of dysregulated signal trans-duction activity in SB.mhdgc-1 cells. Additionally, these results, in part, overlap with data obtained from compar-ative gene expression profiling, synthetic RNA lethality and drug screening in the isogenic MCF10A CDH1(−/−) breast fibroblast model as well as prior large-scale gene profiling studies of sporadic clinical gastric cancer speci-mens [12, 23, 28].
Similar to the MCF10A CDH1(−/−) mutant cells, c.1380delA CDH1 SB.mhdgc-1 gastric cancer cells showed altered gene expression of genes involved in cel-lular component organization, cytoskeletal organization, and cell adhesion (Additional file 4: Figure S2), including microtubule nucleation involving genes like TUBB2 [28]. We found c.1380delA CDH1 SB.mhdgc-1 cells sensitive to taxanes targeting TUBB1 as well as agents targeting mitosis like the aurora kinase inhibitors, a finding also made by Telford and colleagues in the MCF10A CDH1 (−/−) system [12, 29]. Elevated phosphoinositide signal-ing, both by direct detection of PI(4,5)P2 and PI(3,4,5)P3s messenger intermediates as well as by network analysis of differential gene expression profiling may be a conse-quence of increased GPCR signaling, which was the most enriched functional cluster (enrichment score = 10.01) in the synthetic lethality screen and confirmed by increased sensitivity to JAK2 inhibition, an immediate downstream effector kinase of GPCR signaling complexes, in the iso-genic MCF10A CDH1 (−/−) system studied by Telford et al. [12]. Overall, drug sensitivities with overlap to Tel-ford and colleagues’ findings in the CDH1(−/−) isogenic mutant MCF10A model include inhibitors of the PI3K/ mTOR axis, including PI-103 followed up in our valida-tion studies, mTOR, aurora kinase inhibitors as well as inhibitors of c-Src kinase. Our findings are also in line with the characteristics, both on a molecular and drug sensitivity level, of a large gene expression profiling effort across 258 tumors which identified three subclasses of gastric cancer [23]. In this large study of well-validated patient specimens, gene expression analysis identified three subgroups, mesenchymal, proliferative and meta-bolic, based on transcriptomic differences. The mesen-chymal subtype most frequently harbored diffuse gastric cancers (up to 92.5%), showed cell adhesion and cell motility as well as focal adhesion and ECM receptor gene expression aberrations and displayed sensitivity to inhibi-tors of the PI3K/AKT pathway. These tumors were fre-quently hyper-methylated and of high grade and appear to be most similar to the genomically stable (GS) subtype by TCGA which consists of 75% Lauren classification
[30–32]. Thus, while previous results including pharma-cological leads from the isogenic E-cadherin deficient MCF10A model, or from a study in a CDH1 null dros-ophila model, might be mostly applicable to the early, intramucosal T1a stage, we propose that leads derived from patient-derived c.1380delA CDH1 SB.mhdgc-1 cells capture later tumor stages shifting from a drug profile with primarily chemopreventative merit to a therapeutic one. The anecdotal use of anti-EGFR therapy with cetuxi-mab in HDGC patients with advanced gastric cancers applied by some medical oncologists in the field appears to be in line with the detected sensitivities to EGFR, PI3K and MEK inhibition as well as elevation of MAPK kinase signaling in c.1380delA CDH1 SB.mhdgc-1 cells. Similar to KRAS wild type colon cancer, in the absence of con-stitutively active RAS reduction of upstream input to the MAPK and PI3 kinase signal transduction pathways, EGFR inhibition might have merit as a molecular ther-apy option which might be improved by the use of select downstream mTOR inhibition considering alternative non-erb receptor ligand activation of the PI3K pathway via increased phosphoinositol-mediated signaling, c-Src or protein kinase C signaling via ERK-mediated release of TSC1/2 and mTORC1 inhibition.
Together, combined comparative gene expression pro-filing and qHTS in patient-derived hereditary c.1380delA CDH1 SB.mhdgc-1 cells may open new avenues to improved individualized treatment options for familial gastric cancer.
Conclusion
Hereditary diffuse gastric cancer due to CDH1 ger-mline mutations has to date largely escaped the benefits of the personalized medicine approach. While signifi-cant progress with regard to improvements in screening, surveillance, and risk reducing interventions has been made, HDGC patients affected by advanced gastric can-cer have few effective treatment options, and receive, in large, despite the significant clinicopathological and genetic differences, the same systemic treatment options like patients affected by sporadic gastric cancer. Using the patient-derived c.1380delA CDH1 SB.mhdgc-1 and SB.msgc-1 tissue culture lines, and an extended panel of sporadic gastric cancer cell lines, combined comparative gene expression profiling and qHTS drug screening with a large oncology library identified leads with selective activity in familial gastric cancer cells occurring in the context of CDH1 germline mutations. Some of the vali-dated leads have regulatory approval for other oncology indications, and thus can be expeditiously translated into early clinical trial testing possibly opening new avenues to improved treatment options for patients with familial gastric cancer.
Additional files
Additional file 1: Table S1. Chromosomal aberrations detected by FISH in SB.mhdgc‑1.
Additional file 2: Table S2. Quantitative high‑through put drug screening using MIPE Oncology 4.0 library in hereditary c.delA1380 CDH1 SB.mhdgc‑1 and sporadic SB.msgc‑1 cells.
Additional file 3: Figure S1. Protein product of c.1380delA CDH1 variant predicted by MutationTaster. Wild type CDH1 sequence (UniProt ENST00000261769) shown on top, c.1380delA CDH1 variant on bottom. Additional file 4: Figure S2. Top ten Gene Ontology (GO) cellular pro‑ cesses differently regulated in c.1380delA CDH1 SB.mhdgc‑1 versus panel of sporadic gastric cancer cells. Enrichment analysis of all genes with FC > 2; p < 0.05 and q < 0.05 was carried out using GeneGo Metacore data mining and analysis software (online version; http://portal.genego. com). Probabilities of a random intersection between a set of IDs the size of target list with ontology entities estimated in p value of hypergeomet‑ ric intersection (top; the lower p value means higher relevance of the entity to the dataset, which shows in higher ranking for the entity). Additional file 5: Figure S3. E‑cadherin (left) and HER2 expression in metastatic, moderately to poorly differentiated adenocarcinoma of the stomach SB.msgc‑1. Immunohistochemical staining at magnification ×20, inlet ×40.
Additional file 6: Figure S4. Diagrams of different dose responses and the corresponding curve response class (CRC) scores. CRC parameters integrate potency and efficacy measurements of the compounds. Drug response curves with CRC −1.1 exhibit a near complete maximum response; −1.2 exhibit less effective maximum cell killing; −2.1 do not have a maximum response but can achieve killing of nearly all the cells; −2.2 do not have a maximum response and can only achieve intermedi‑ ate killing; and 4 are inactive.
Additional file 7: Figure S5. Selective pharmacological vulnerabilities of c.1380delA SB.mhdgc‑1 versus SB.msgc‑1 gastric cancer cells identified by comparative qHTS screening with the MIPE Oncology 4.0 library. A, Bub‑ ble diagram of drug phenotypes by compound class of SB.mhdgc‑1 ver‑ sus SB.msgc‑1 cells depicting class activities (number of compounds per drug class) measured by maximum response (max response SB.mhdgc‑1 / max response SB.msgc‑1). B, Bubble diagram comparing drug activities measured by potency (logAC50SB.mhdgc‑1 versus logAC50SB.msgc‑1).
Additional file 8: Figure S6. A, Target enrichment for compounds with CRC −1.1, −1.2, −2.1, or −2.2 and delta logAC50 (SB.mhdgc‑1 logAC50–
SB.msgc‑1 logAC50) < −1. −log p values were calculated as described
in materials and methods based on the total number of compounds targeting a gene or mechanism. B, LogAC50 distributions of compounds
that show CRC −1.1, −1.2, −2.1, or −2.1 and logAC50 <−1 organized by enriched target class in c.1380delA CDH1 SB.mhdgc‑1 versus SB.msgc‑1 gastric cancer cells. Box plots of median logAC50 values of select target
classes showing enrichment in c.1380delA CDH1 SB.mhdgc‑1 (red plots) and SB.msgc‑1 (blue plots). C, Concomitant dysregulation of target genes and selective activity of MIPE compounds in c.1380delA CDH1 SB.mhdgc‑1 versus SB.msgc‑1 gastric cancer cells. Genes with greater than two‑fold expression difference in c.1380delA CDH1 SB.mhdgc‑1 com‑ pared to SB.msgc‑1 cells and which are direct targets of compounds in MIPE Oncology 4 are shown. Genes that are downregulated in c.1380delA CDH1 SB.mhdgc‑1 compared to SB.msgc‑1 cells are represented by green dots; red dots represent upregulated genes (log10 fold change indicated on the right). Overlaid are boxplots for difference in logAC50 (LAC50)
SB.mhdgc‑1–SB.msgc‑1 for all compounds in MIPE Oncology 4 per target (top) or maximum response (bottom).
Abbreviations
ALK: Anaplastic Lymphoma receptor tyrosine Kinase; CDH1: E‑cadherin; DAG: diacylglycerol; EGFR: epidermal growth factor receptor; EMT: epithelial–mesen‑ chymal transition; ERK: extracellular signal regulated kinase; FAK: focal adhesion kinase; HDGC: hereditary diffuse gastric cancer; IP3: inositol trisphosphate; JAK: Janus Kinase; MEK: mitogen‑activated protein kinase; mTOR: mammalian target of rapamycin; PI3K: phosphatidylinositol 3‑kinase; PKC: protein kinase C; STAT3: signal transducer and activator of transcription 3; TOPO2: topoisomerase II.
Authors’ contributions
IC conducted gene expression analysis, drug response testing, and apop‑ tosis assays, DL performed adhesion assay, imaging and western blots, YB conducted immunofluorescent staining, VS conducted BrU apoptosis flow experiments, AAO, AZ and RG performed WB and gene expression analysis, JB coordinated clinical care of involved patient, LMG, XZ, CT, BG, SR and MF performed drug screening, hit selection, ranking, and analysis. UR conceived and designed experiments and wrote paper. All authors read and approved the manuscript.
Author details
1 Thoracic and Gastrointestinal Oncology Branch, National Cancer Institute,
National Institutes for Health, CCR 4 West/4‑3740, 10 Center Drive, Bethesda, MD 20892‑0001, USA. 2 Washington University School of Medicine, St. Louis,
KY, USA. 3 Division of Preclinical Innovation, National Center for Advanc‑
ing Translational Sciences, National Institutes of Health, Rockville, MD, USA.
4 Department of Biology and Center for Cancer Research, Tuskegee University,
Tuskegee, AL, USA. 5 Surgery Branch, NCI, NIH, Bethesda, MD, USA. 6 Genetics
Branch, NCI, NIH, Bethesda, MD, USA. 7 Indiana University School of Medicine,
Indianapolis, IN, USA. 8 Advanced Biomedical Computing Center, Frederick
National Laboratory for Cancer Research, Leidos Biomedical Research Inc., Frederick, MD, USA.
Acknowledgements
Not applicable.
Competing interests
The authors declare that they have no competing interests. There are no patents, products in development or marketed products to declare. This does not alter the authors’ adherence to all the J Translational Medicine policies on sharing data and materials.
Availability of data and materials
All data and materials either included into manuscript as additional informa‑ tion or available upon request from the corresponding author.
Consent for publication
Not applicable. However, as part of enrollment onto IRB approved study NCI‑ 09‑0079 the patient provided written informed consent for publication.
Ethics approval and consent to participate
Enrollment of patient from which c.1380delA CDH1 SB.mhdgc‑1 cells were derived, occurred under clinical protocol NCI‑09‑C‑0079 approved by the Institutional Review Board of the National Cancer Institute, NIH. The patient provided full informed written consent to participation in the study.
Funding
This work was supported, in part, by the Intramural Research Program of the NIH, National Cancer Institute, Center for Cancer Research, and was also made possible through the National Institutes of Health (NIH) Medical Research Scholars Program, a public–private partnership supported jointly by the NIH and generous contributions to the Foundation for the NIH from Pfizer Inc, The Doris Duke Charitable Foundation, The Newport Foundation, The American Association for Dental Research, The Howard Hughes Medical Institute, and the Colgate‑Palmolive Company, as well as other private donors. AAO was supported via a U54 Cooperative Agreement (2 U54 CA118623‑11) from the National Institutes of Health.
Publisher’s Note
Springer Nature remains neutral with regard to jurisdictional claims in pub‑ lished maps and institutional affiliations.
Received: 2 February 2017 Accepted: 24 April 2017
References
1. Guilford P, Hopkins J, Harraway J, et al. E‑cadherin germline mutations in familial gastric cancer. Nature. 1998;392(6674):402–5.
2. Hansford S. Hereditary diffuse gastric cancer syndrome: CDH1 mutations and beyond. JAMA Oncol. 2015;1(1):23–32.
3. Pharoah PD, Guilford P, Caldas C. Incidence of gastric cancer and breast cancer in CDH1 (E‑cadherin) mutation carriers from hereditary diffuse gastric cancer families. Gastroenterology. 2001;121(6):1348–53. 4. van der Post RS, Vogelaar IP, Manders P, et al. Accuracy of hereditary
diffuse gastric cancer testing criteria and outcomes in patients with a germline mutation in CDH1. Gastroenterology. 2015;149(4):897–906. 5. Siegel RL, Miller KD, Jemal A. Cancer statistics, 2016. CA Cancer J Clin.
2016;66(1):7–30.
6. Kaurah P, MacMillan A, Boyd N, et al. Founder and recurrent CDH1 mutations in families with hereditary diffuse gastric cancer. JAMA. 2007;297(21):2360–72.
7. Oliveira C, Sousa S, Pinheiro H, et al. Quantification of epigenetic and genetic 2nd hits in CDH1 during hereditary diffuse gastric cancer syn‑ drome progression. Gastroenterology. 2009;136(7):2137–48.
8. Carneiro F, Oliveira C, Suriano G, Seruca R. Molecular pathology of familial gastric cancer, with an emphasis on hereditary diffuse gastric cancer. J Clin Pathol. 2008;61(1):25–30.
9. Humar B, Blair V, Charlton A, More H, Martin I, Guilford P. E‑cadherin deficiency initiates gastric signet‑ring cell carcinoma in mice and man. Cancer Res. 2009;69(5):2050–6.
10. Humar B, Fukuzawa R, Blair V, et al. Destabilized adhesion in the gastric proliferative zone and c‑Src kinase activation mark the development of early diffuse gastric cancer. Cancer Res. 2007;67(6):2480–9.
11. Corso G, Carvalho J, Marrelli D, et al. Somatic mutations and deletions of the E‑cadherin gene predict poor survival of patients with gastric cancer. J Clin Oncol Off J Am Soc Clin Oncol. 2013;31(7):868–75.
12. Telford BJ, Chen A, Beetham H, et al. Synthetic lethal screens identify vulnerabilities in GPCR signaling and cytoskeletal organization in E‑cadherin‑deficient cells. Mol Cancer Ther. 2015;14(5):1213–23. 13. Ray S, Langan RC, Mullinax JE, et al. Establishment of human ultra‑low pas‑
sage colorectal cancer cell lines using spheroids from fresh surgical speci‑ mens suitable for in vitro and in vivo studies. J Cancer. 2012;3:196–206. 14. Turcotte S, Gros A, Hogan K, et al. Phenotype and function of T cells
infiltrating visceral metastases from gastrointestinal cancers and melanoma: implications for adoptive cell transfer therapy. J Immunol. 2013;191(5):2217–25.
15. Sorber R, Teper Y, Abisoye‑Ogunniyan A, et al. Whole genome sequenc‑ ing of newly established pancreatic cancer lines identifies novel somatic mutation (c.2587G > A) in axon guidance receptor Plexin A1 as enhancer of proliferation and invasion. PLoS ONE. 2016;11(3):e0149833.
16. Mathews LA, Keller JM, Goodwin BL, et al. A 1536‑well quantitative high‑ throughput screen to identify compounds targeting cancer stem cells. J Biomol Screen. 2012;17(9):1231–42.
17. Inglese J, Auld DS, Jadhav A, et al. Quantitative high‑throughput screening: a titration‑based approach that efficiently identifies biological activities in large chemical libraries. Proc Natl Acad Sci USA. 2006;103(31):11473–8.
18. Wang Y, Jadhav A, Southal N, Huang R, Nguyen DT. A grid algorithm for high throughput fitting of dose‑response curve data. Curr Chem Genom‑ ics. 2010;4:57–66.
19. Atkinson K. An Introduction to Numerical Analysis. 2nd ed. New York: Wiley; 1989.
20. Fisher R. On the interpretation of χ2 from contingency tables, and the calculation of P. J R Stat Soc. 1922;85(1):87–94.
21. Benjamini Y, Hochberg Y. Controlling the false discovery rate: a practical and powerful approach to multiple testing. J R Stat Soc. 1995;57(1):289–300.
• We accept pre-submission inquiries
• Our selector tool helps you to find the most relevant journal
• We provide round the clock customer support
• Convenient online submission
• Thorough peer review
• Inclusion in PubMed and all major indexing services
• Maximum visibility for your research
Submit your manuscript at www.biomedcentral.com/submit
Submit your next manuscript to BioMed Central
and we will help you at every step:
23. Lei Z, Tan IB, Das K, et al. Identification of molecular subtypes of gastric cancer with different responses to PI3‑kinase inhibitors and 5‑fluorouracil. Gastroenterology. 2013;145(3):554–65.
24. Wang K, Yuen ST, Xu J, et al. Whole‑genome sequencing and comprehen‑ sive molecular profiling identify new driver mutations in gastric cancer. Nat Genet. 2014;46(6):573–82.
25. Cancer Genome Atlas Research N. Comprehensive molecular characteri‑ zation of gastric adenocarcinoma. Nature. 2014;513(7517):202–9. 26. Pereira PS, Teixeira A, Pinho S, et al. E‑cadherin missense mutations,
associated with hereditary diffuse gastric cancer (HDGC) syndrome, display distinct invasive behaviors and genetic interactions with the Wnt and Notch pathways in Drosophila epithelia. Hum Mol Genet. 2006;15(10):1704–12.
27. Figueiredo J, Soderberg O, Simoes‑Correia J, Grannas K, Suriano G, Seruca R. The importance of E‑cadherin binding partners to evaluate the pathogenicity of E‑cadherin missense mutations associated to HDGC. Eur J Hum Genet. 2013;21(3):301–9.
28. Chen A, Beetham H, Black MA, et al. E‑cadherin loss alters cytoskeletal organization and adhesion in non‑malignant breast cells but is insuf‑ ficient to induce an epithelial–mesenchymal transition. BMC Cancer. 2014;14:552.
29. Heiser LM, Sadanandam A, Kuo WL, et al. Subtype and pathway specific responses to anticancer compounds in breast cancer. Proc Natl Acad Sci USA. 2012;109(8):2724–9.
30. Lamouille S, Xu J, Derynck R. Molecular mechanisms of epithelial–mesen‑ chymal transition. Nat Rev Mol Cell Biol. 2014;15(3):178–96.
31. Wilson C, Nicholes K, Bustos D, et al. Overcoming EMT‑associated resist‑ ance to anti‑cancer drugs via Src/FAK pathway inhibition. Oncotarget. 2014;5(17):7328–41.