Received 30 Sep 2014|Accepted 27 Nov 2014|Published 22 Jan 2015
Structural analysis of herpes simplex virus
by optical super-resolution imaging
Romain F. Laine
1,*, Anna Albecka
2,*, Sebastian van de Linde
3, Eric J. Rees
1, Colin M. Crump
2& Clemens F. Kaminski
1Herpes simplex virus type-1 (HSV-1) is one of the most widespread pathogens among humans. Although the structure of HSV-1 has been extensively investigated, the precise organization of tegument and envelope proteins remains elusive. Here we use super-reso-lution imaging by direct stochastic optical reconstruction microscopy (dSTORM) in combi-nation with a model-based analysis of single-molecule localization data, to determine the position of protein layers within virus particles. We resolve different protein layers within individual HSV-1 particles using multi-colour dSTORM imaging and discriminate envelope-anchored glycoproteins from tegument proteins, both in purified virions and in virions present in infected cells. Precise characterization of HSV-1 structure was achieved by particle aver-aging of purified viruses and model-based analysis of the radial distribution of the tegument proteins VP16, VP1/2 and pUL37, and envelope protein gD. From this data, we propose a model of the protein organization inside the tegument.
DOI: 10.1038/ncomms6980 OPEN
1Laser Analytics Group, Department of Chemical Engineering and Biotechnology, Cambridge University, Pembroke Street, Cambridge CB2 3RA, UK.2Division
T
he Herpesviridae comprise a large family of enveloped DNA viruses that infect a wide range of hosts, including humans. One of the most widespread human members of this family, herpes simplex virus type-1 (HSV-1), is a common cause of cold sores but can also result in herpes keratitis1, a leading infectious cause of blindness, and herpes simplex encephalitis2, which has a high mortality even in patients treated with antiviral therapy. It is highly contagious and can be easily passed from individual to individual via direct contact. In addition, after primary infection, HSV-1 establishes a lifelong latent infection in sensory ganglia with periodic reactivation of the virus leading to both symptomatic and asymptomatic virus shedding3.Electron microscopy (EM) and electron tomography (ET) studies of HSV-1 have revealed that virus particles have a spherical shape4, with diameter ranging from 155 to 240 nm, each containing an icosahedral capsid with a diameter of 125 nm5,6, which contains the viral DNA. The structure of the highly ordered capsid complex has been studied extensively and is now well defined. A partially ordered layer of tegument proteins surrounds the nucleocapsid and the viral envelope encloses the nucleocapsid/tegument core. The envelope carries a set of glycoproteins that are essential for virus entry and viral morphogenesis. Among them, glycoprotein D (gD) mediates interactions with cellular receptors and initiates the cascade of events essential for HSV-1 entry into target cells7. The tegument is the most structurally complex layer of the virus, and so far, over 20 tegument proteins have been identified for HSV-1 (ref. 8). In particular, VP1/2 (also known as pUL36) is the largest tegument protein (4330 kDa) and is essential for HSV-1 entry and assembly9,10. Owing to the interaction of its carboxy terminus with the minor capsid protein pUL25, VP1/2 is often referred to as being a part of the inner tegument. With its binding partner pUL37 (refs 11,12), VP1/2 plays an essential role in capsid transport on microtubules13. In contrast to VP1/2 and pUL37, one of the major tegument proteins VP16 is thought to reside closer to the viral envelope and be a part of the outer tegument. VP16 also interacts with VP1/2 (ref. 14) and induces transcription of immediate-early viral genes, thus playing an important role in the viral life cycle15. Owing to its multiple interactions with other viral proteins, VP16 has been proposed to serve as a central organizer for the tegument12.
Although it is now clear that the tegument is not as disordered as previously thought, its structure and organization are still poorly understood. Structural information is also missing on the distribution of specific glycoproteins in the virus envelope. EM studies of biological materials are often restricted to highly ordered structures and, therefore, cannot be used to resolve viral tegument and envelope organization. Moreover, although EM and ET are powerful tools to visualize overall physical structure, their ability to localize specific proteins is limited. Optical techniques do not suffer this latter disadvantage; however, they are limited by optical diffraction, with a typical lateral resolution of B200 nm. This resolution is comparable to the entire virus diameter and thus too coarse to reveal structural information. Recently, a host of sub-wavelength resolution optical imaging methods have been developed to circumvent the diffraction limit16–18. These super-resolution methods include stimulated-emission depletion microscopy19and single-molecule localization microscopy (SMLM), such as photoactivated localization microscopy (PALM)20, stochastic optical reconstruction microscopy21 (STORM) and direct STORM (dSTORM)22. Although PALM20,23, stimulated-emission depletion24 or dSTORM25–27 have begun to be used in the investigation of viral replication and structure, their application in the context of virology research is still in its infancy.
In particular, the lateral resolution achievable with SMLM (typically 20–30 nm, full width at half maximum) is well suited for the study of HSV-1 particles. The increased resolution in SMLM is based on the temporal separation and the subsequent precise localization of individual fluorescent emitters. Compared with other super-resolution methods, not only can the fluor-ophore localizations be used for the reconstruction of a high-resolution image, but they also allow for the counting of molecule numbers28–30, cluster analysis31,32or geometric modelling33.
Here we present a study of HSV-1 viral structure using
dSTORM. First, multi-colour localization microscopy was used to visually distinguish virus proteins in individual virus particles. We then designed a model-based analysis of SMLM data and used particle averaging (a method routinely used in EM34) to reconstruct a high-resolution image and to determine the position of individual protein layers within the virus particle with nanometre precision. We additionally investigated the effect of the fluorophore linker size and compared immuno-labelling strategies in the context of model-based analysis. Finally, our data set confirmed and quantified the spatial offset of the capsid with respect to the centre of the virion.
Results
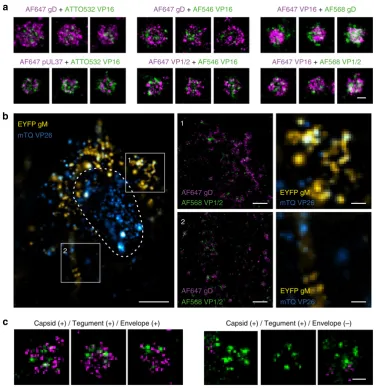
Multi-colour dSTORM resolves protein layers in HSV-1. We used two-colourdSTORM imaging of purified virions to inves-tigate the architecture of different protein layers within individual virus particles. The use of Alexa Fluor (AF) 647 is well established in localization microscopy, owing to its favourable photoswitch-ing behaviour and its high photostability and quantum yield. We thus searched for a second fluorophore that could be reliably used in combination with AF647 for imaging virus particles and tested AF647/ATTO532, AF647/AF546 and AF647/AF568 in a range of photoswitching environments. All fluorophores were linked to secondary antibodies and imaging protocols were optimized for each fluorophore combination (Fig. 1a).
As shown in the top row in Fig. 1a, for every fluorophore combination tested, two-colour dSTORM consistently demon-strated the envelope protein gD to be located at larger radial distance than the tegument protein VP16. The two tegument proteins VP16 and pUL37 showed a large overlap and similar radial distributions, suggesting that VP16 and pUL37 reside in the same region of the tegument layer (Fig. 1a, bottom row). The inner tegument protein VP1/2 and the outer tegument protein VP16 are thought to reside at different radial locations, with VP1/2 expected to lie closer to the capsid than VP16. However, by resolving and analysing individual virus particles, we could not consistently differentiate between outer and inner tegument, irrespective of dye combination used (Fig. 1a, bottom row, second and third panel).
present in the perinuclear region of the cytoplasm and near the plasma membrane, as expected for a viral envelope glycoprotein that undergoes vesicle-based transport through the secretory and endocytic compartments of the cell35.dSTORM imaging of both AF647 and AF568 allowed the identification and characterization of structural elements of individual particles (tegument and envelope) directly in the infected cells and the mTurquoise fluorescence image was used to identify the particles that were capsid positive. Among the capsid-positive particles, two main types were observed: those containing both tegument and envelope (Capsid(þ)/Tegument(þ)/Envelope(þ)) and others that were devoid of envelope (Capsid(þ)/Tegument(þ)/ Envelope()) (Fig. 1c). The particles exhibiting all viral components (Capsid (þ)/Tegument(þ)/Envelope(þ)) displayed structures that were consistent with those observed in purified viruses (Fig. 1a). In particular, VP1/2 (tegument) consistently appeared to be contained within the gD layer (envelope). We observed no clear visual difference in the distribution of VP1/2 between virus particles that were envelope positive and envelope negative.
These data demonstrate that the use of two-colourdSTORM in combination with two-colour wide-field fluorescence (using genetically expressed mTurquoise-VP26 and gM-EYFP) provides super-resolution information about individual virions at different assembly steps.
However, we noted that the mean localization precision (defined further on as 1 s.d.) achieved for the two-colour
dSTORM images obtained both in cells and in purified viruses was of the order of 10–15 nm, irrespective of the fluorophore and the antibody used. We also observed that the fraction of localization with high-localization precision (5–10 nm) was much greater for AF647 than AF568, AF546 or ATTO532. This observation is in agreement with AF647 being one of the brightest fluorophore commonly used fordSTORM.
Particle averaging and model-based analysis of HSV-1. Nano-metre-scale structural analysis by SMLM is a developing field. However, it requires high spatial resolution and high labelling specificity, and typically involves complex data analysis. This
Capsid (+) / Tegument (+) / Envelope (–) AF568 VP1/2
AF647 gD 2
AF568 VP1/2 AF647 gD 1
1 EYFP gM
mTQ VP26
EYFP gM
mTQ VP26 2
Capsid (+) / Tegument (+) / Envelope (+)
AF647 gD + ATTO532 VP16 AF647 gD + AF546 VP16 AF647 VP16 + AF568 gD
AF647 pUL37 + ATTO532 VP16 AF647 VP1/2 + AF546 VP16 AF647 VP16 + AF568 VP1/2
[image:3.595.109.486.46.436.2]EYFP gM mTQ VP26
complexity is notably due to the need for assessing effects of the localization error and the linker size between the protein of interest and the fluorescent label36,37. Here we present a structural analysis method taking these effects into account and apply it for the precise determination of the distribution of important tegument and envelope proteins in HSV-1.
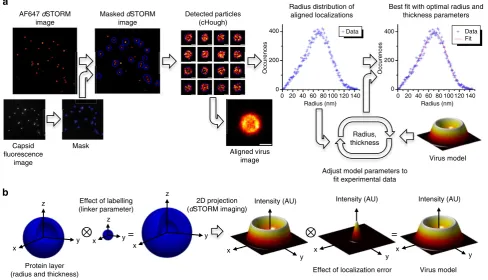
We acquired single-colourdSTORM images of purified viruses labelled with AF647. Here, a recombinant virus expressing mTurquoise-VP26 was used. We imaged a large number (450) of particles and data sets were analysed as shown in Fig. 2a (see also Supplementary Notes 1–3 and Supplementary Figs 1–3). We ensured that only fully assembled virus particles, for example, containing capsid, tegument and envelope, were used for the analysis. For this, capsid-positive particles were selected by creating a mask from the mTurquoise-VP26 fluorescence image. A second mask was also created from an additional wide-field fluorescence image using AF568 as described in the Methods section.
Images of individual virus particles (as those shown in Figs 2a and 3) were typically reconstructed from 100 to 300 localizations, with a typical localization precision of 5–10 nm (1 s.d. as described by Mortensenet al.38, see Supplementary Note 3). By aligning the obtained particles, the localizations can be combined to reconstruct a high-density super-resolution image of a specific protein layer. Furthermore, with the large number of localizations obtained in the aligned data set, the radial distribution of the aligned localizations can be accurately retrieved and analysed to determine the position of this individual layer. For this, the radial distribution of localizations was fitted to a Monte-Carlo model of virus localization data set (Monte-Carlo-based virus (MCV) model, presented in Fig. 2b and Supplementary Note 2), developed assuming spherically symmetric virus particles. In this model, each viral protein is
assumed to lie within a spherical shell described by two parameters: the shell diameter and the shell thickness. The model takes both the linker size and the localization error into account. The shell diameter and thickness are the structural parameters of interest and are both obtained by fitting, whereas the linker size and localization precision are first estimated and then fixed during the analysis (Supplementary Note 3). The shell diameter represents the average radial position of the protein of interest in a population of virus particles. On the other hand, the shell thickness obtained by our method is a result of several contributions: the actual thickness of the protein layer (the thickness of the shell shown in Fig. 2b), the variability of the diameter from particle to particle in a population of virus particles and any deviation from the spherical symmetry.
First, we investigated the effect of the fixed parameters (linker size and localization precision) on the fitted parameters. The estimation of the shell diameter was found to be very robust with respect to the fixed parameters and errors of 50% in linker size or localization error estimates only introduced a bias of o5%. However, the shell thickness is more strongly affected by such errors. An overestimation of either linker length or localization precision leads to an underestimation of the shell thickness (and vice versa). Details can be found in Supplementary Note 4 and Supplementary Fig. 4.
The analysis presented here allows the quantification of both diameter and thickness of individual protein layers from localization data sets and provides much greater precision than single-particle imaging.
Direct labelling of viral proteins. To assess the effect of linker size, we compared three different antibody-based labelling
Capsid fluorescence
image
Mask
Aligned virus image
Radius distribution of aligned localizations
Adjust model parameters to fit experimental data
Radius, thickness
Best fit with optimal radius and thickness parameters
Virus model
= =
Protein layer (radius and thickness)
Effect of labelling (linker parameter)
x
y z
x
y z
x
y Intensity (AU)
x y
z
x
y Intensity (AU)
x
y Intensity (AU)
Effect of localization error Virus model 2D projection
(dSTORM imaging)
y AF647 dSTORM
image
Masked dSTORM image
Detected particles (cHough)
400 Data Data
Fit
200
Occurences
0
0 20 40 60 80 100 120 Radius (nm)
140 400
200
Occurences
0
0 20 40 60 80 100 120 Radius (nm)
[image:4.595.54.543.403.683.2]140
Figure 2 | Virus particle alignment and model-based analysis.(a) Flowchart representing the main data analysis steps. The image analysis procedure was
performed using a custom-written MATLAB routine. Briefly, thedSTORM image was masked using the mTurquoise and AF568 fluorescence image, and the
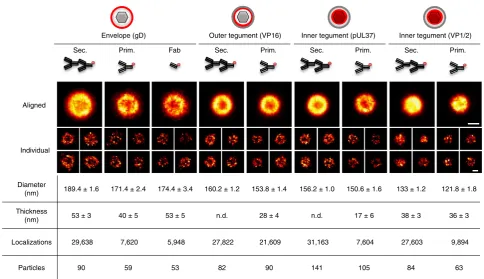
methods: indirect immunochemistry (successive primary and secondary antibody labelling, termed secondary labelling), direct dye-conjugated primary antibody (primary labelling) and direct dye-conjugated Fab fragments (Fab labelling), all conjugated with AF647. We estimated the corresponding linker sizes as 20, 10 and 5 nm, respectively, based on the structure of the IgG (PDB 1IGT39). The analysis was performed for the envelope protein gD and the three tegument proteins VP16, pUL37 and VP1/2.
In general, Fab fragments are preferable for super-resolution microscopy due to their small size. However, the specificity of the Fab fragments we produced was often compromised and efficient labelling was only achieved using the anti-gD Fab fragment. This is likely to be due to antibody structure and/or dye conjugation within the antigen-binding region, leading to lower affinity or avidity interactions between the specific epitopes. Therefore, only results from anti-gD Fab fragment are shown. Figure 3 shows the image of the virus obtained from particle alignment as well as representative single-particle images obtained from the raw
dSTORM images for each protein and labelling combination. The total number of localizations, the number of particles and the results from the MCV model fits are stated in the table. Radial distributions and the optimal fits for all data sets are shown in Supplementary Fig. 3.
Irrespective of the labelling approach, the envelope protein gD exhibited the largest diameter, VP16 and pUL37 showed a diameter consistent with their tegument location (between capsid and envelope), whereas the inner tegument protein VP1/2 appeared very close to the capsid (from the known capsid diameter of 125 nm5,6,40).
The reduction in the number of localizations that was observed when comparing the secondary with primary and Fab labelling strategies can be attributed to the reduction of the average number of fluorescent labels per antibody, from 3 to 4 on
commercial secondary antibody to 1.0–1.5 for in-house labelled primary antibodies and Fab fragments. In addition, multiple secondary antibodies may bind to a single primary antibody. This would also contribute to the greater number of localizations observed with secondary labelling.
As our analysis takes into account the linker size, different labelling strategies should lead to the same results. Any differences can then be interpreted as deviations from the model (in particular, non-spherical or non-random distribution) or direct effect of the labelling on the particles (labelling affecting the particle size, for instance). In fact, we observe that for VP16, pUL37 and VP1/2, changing the labelling from secondary to primary resulted in a small reduction of the diameter (by 5–10 nm). This small reduction may be a result of the heavy loading of the tegument with large labels that occurs with secondary labelling, leading to an observed swelling of the particle. The compact and rigid structure of the capsid may also contribute towards pushing the labels outwards rather than inwards.
For gD, the reduction in diameter from secondary to primary labelling is more pronounced than for the tegument proteins (B20 nm as opposed to 5–10 nm). In this case, the difference can be explained by a deviation between the envelope protein structure and the model. Instead of being randomly distributed around the average radial position of the protein layer, the labels may have a tendency to stretch outwards, away from the centre of the particle, and therefore smaller labels admit a smaller bias. This results in an overestimation of the protein diameter due to the linker size, which is then more pronounced in the case of the secondary labelling. An additional B20 nm on the diameter corresponds to B10 nm on the radius, which is in agreement with the size of a single antibody. No significant reduction in the diameter of the protein layer was observed between the primary and the Fab labelling, suggesting that the precision of our
Diameter
(nm) 189.4 ± 1.6 171.4 ± 2.4 174.4 ± 3.4 160.2 ± 1.2 153.8 ± 1.4 156.2 ± 1.0 150.6 ± 1.6 133 ± 1.2 121.8 ± 1.8
Thickness
(nm) 53 ± 3 40 ± 5 53 ± 5 n.d. 28 ± 4 n.d. 17 ± 6 38 ± 3 36 ± 3
Localizations 29,638 7,620 5,948 27,822 21,609 31,163 7,604 27,603 9,894
Particles 90 59 53 82 90 141 105 84 63
Sec. Prim. Fab
Envelope (gD)
Sec. Prim.
Outer tegument (VP16)
Sec. Prim.
Inner tegument (VP1/2)
Sec. Prim.
Inner tegument (pUL37)
Aligned
[image:5.595.55.540.45.324.2]Individual
measurements is not limited by the size of the labelling once the distance between the protein of interest and the fluorescent label is of the order of or below the size of a single complete antibody. The measurements of thickness obtained for gD are consistent across the three different labelling strategies. Similarly, the thicknesses recovered by primary and secondary labelling for VP1/2 are in good agreement with each other. We note that for VP16 and pUL37, the use of secondary labelling did not allow the estimation of the thickness parameter. This highlights that the use of primary labelling allows the measurement of smaller thickness that secondary labelling cannot reliably determine. A thorough analysis of the effect of the linker size (Supplementary Note 5) showed that the shell thickness may appear non-determinable if the estimation of the linker size is incorrect. This analysis also demonstrated that the linker size for the secondary labelling is more variable (between 15 and 25 nm for this data set depending, on the protein labelled) than for primary labelling. This variability in linker size using the same labelling approach is very likely to introduce bias or non-determinable thickness when the linker cannot be estimated precisely. On the other hand, a linker size of 10 nm for primary labelling provided reliable and consistent results.
As the secondary labelling is more subject to biases for model-based analyses, we conclude that the primary labelling appears the most robust method to measure the diameter and thickness of a discrete protein layer and is therefore the most appropriate approach fordSTORM structural analysis.
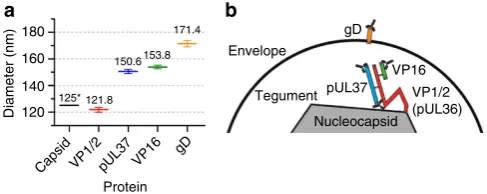
Modelling HSV-1 protein layer architecture. From the model-based analysis using primary labelling, the diameter of different protein layers could be obtained with high precision (1–2 nm error, 95% confidence interval). As shown in Fig. 4a, the diameter obtained decreased from envelope (171.4±2.4 nm) to the tegu-ment proteins VP16 (153.8±1.4 nm), pUL37 (150.6±1.6 nm)
and VP1/2 (121.8±1.8 nm). Moreover, the distance between the
capsid and the envelope (23±4 nm) can be interpreted as a
measurement of the average tegument thickness.
The diameter obtained here for VP16 is in good agreement with the observation that it interacts with a number of envelope-anchored proteins41,42and therefore is expected to localize close to the envelope. For VP1/2, it has been shown that the C-terminus of VP1/2 interacts with the minor capsid protein pUL25 (ref. 43), but the structure and the spatial arrangement of the remaining part of this large protein remains elusive. Here we were able to show that the binding site for the VP1/2-specific antibody used here (located between the amino acids 1564 and 1876) resides very close to the edge of the capsid. Furthermore, despite
the common view of pUL37 as an inner tegument protein (notably because it interacts with VP1/2 (ref. 12)), the data we obtained here provide evidence that pUL37 is located at a similar position in the tegument to VP16 and, hence, closer to the outer part of the virion than previously thought.
From our measurements, we propose a model for HSV-1 tegument architecture (Fig. 4b). In addition, this model includes the current understanding of the interaction and antibody-binding sites of the considered proteins in the tegument. Indeed, we have previously shown that VP16 binds to VP1/2 within the first 361 amino acids of VP1/2 (ref. 14). Moreover, the binding site of VP1/2 to pUL37 has been localized within the C-terminal region of pUL37 (ref. 11). The diameter measured for pUL37 (153.8 nm) is in good agreement with published data showing that the interaction site of VP1/2 with pUL37 is close to the VP16 interaction domain, within the amino terminus of VP1/2 (ref. 44), potentially placing both VP16 and pUL37 in a similar location relative to VP1/2.
Although interpretation is not as straightforward as for the shell diameter data, the shell thickness also provides structural information. For instance, as the gD protein layer is part of the membrane structure (with no intrinsic thickness), the large thickness obtained for gD (40 nm) indicates a large variability of the envelope diameter from particle to particle (supporting the large range of particle sizes found by EM) and/or a potential deviation from the spherical symmetry, underlying the plasticity of the envelope. On the other hand, the thickness of VP16 and pUL37 appear smaller than that of gD, which is consistent with the notion that there is much less plasticity in the virus tegument compared with the envelope layer. At the moment, we do not have a clear explanation as to the observed differences in the thickness for VP1/2 and pUL37. Reasons could include differential labelling efficiencies for the two proteins and dense packing of fluorophores on the small shell of VP1/2, increasing localization artefacts. An underestimation of the alignment error would also lead to an overestimation of the shell thickness (see Supplementary Note 4). Finally, there may be differential ‘plasticity’ of the two protein layers, leading to a real geometric distortion.
Spatial offset of the capsid. Cryo-ET studies indicated that HSV-1 particles are not symmetrical4,45. These studies demonstrated that the capsid does not lie in the centre of the particle. This spatial offset may be explained by the structure and function of the portal vertex, which is thought to form a connection between the capsid and the envelope45. A spatial offset between the centre of the capsid and the outer protein layer of B15 nm was measured by ET4.
Here we developed a method to estimate the average distance between the centre of the capsid and the centre of the outer protein layer (tegument or envelope), as detailed in Supplementary Note 6. Briefly, the displacement between the centre of the considered layer (tegument or envelope, determined by a fitted circle) and the centre of the capsid (determined by localization of the centroid of the mTurquoise-VP26 fluores-cence) was calculated for a large number of particles and the data were analysed with a further model-based analysis. This approach is related in nature to that of a recent investigation of sub-virion protein distribution in the related herpesvirus pseudorabies virus46. In the latter work, the displacement between the centroids of the wide-field fluorescence patterns from dually labelled virions was determined with high precision. The results of our analysis are shown in Supplementary Fig. 5b. After correction for the residual chromatic random error, the offset was estimated as 12, 7 and 24 nm for gD, VP16 and pUL37,
Nucleocapsid 120
Capsid VP1/2 pUL37VP16 gD
Protein 140
125* 121.8 150.6153.8
171.4
Envelope
Tegument gD
pUL37 VP16
VP1/2 (pUL36)
Diameter (nm)
160 180
[image:6.595.46.290.573.670.2]a b
Figure 4 | Model of protein distribution inside the tegument of HSV-1.
respectively. The order of magnitude of this offset is in good agreement with the value determined by ET4, although greater than expected for pUL37.
Discussion
Traditionally, fluorescence-based studies of HSV-1 structure have been limited by the small size of the viral particles. Here we used
dSTORM super-resolution microscopy to investigate and quan-tify the organization of key proteins within HSV-1 virions. Our results provide intriguing details on tegument architecture in mature HSV-1 virions that are not accessible to traditional EM or ET techniques. Our work establishesdSTORM as a powerful new tool in deciphering virus structure.
First, we conjugated a number of antibodies withd STORM-compatible organic dyes and optimized labelling protocols to minimize background from nonspecific antibody binding. With two-colour dSTORM, we were able to visualize and discriminate between tegument and envelope protein layers within single virus particles. The organization of important tegument and envelope proteins could then be observed both in purified viruses and in infected cells. The method thus shows great potential as a structural tool to study the organization and interaction of viral and cellular proteins during various stages of virus replication.
Structural information of biological nanostructures can be derived through averaging repetitive features as is commonly performed in EM. Particle averaging in SMLM images was originally shown for the nuclear pore complex34,47, and more recently for HIV-1 (ref. 27). Here we extended this approach and developed a model-based analysis of SMLM data to extract structural parameters for specific virus proteins layers with optimal precision (1–2 nm for the shell diameter ando6 nm for the thickness). We compared different antibody-labelling methods in the context of structural analysis and found that primary labelling offers the most robust readout of protein location. We found that errors in the estimates of linker size or localization error introduce bias in the analysis and this needs to be carefully considered when secondary labelling is used: for example, we found that linker lengths varied fromca. 15 to 25 nm depending on which protein was labelled; therefore, precise estimates may be difficult in a practical situation. In contrast, we found that primary labelling resulted in a reliable and constant linker length of 10 nm. Fab fragments offer potential for even shorter linker size. However, producing Fab fragments that retained sufficient binding specificity and/or affinity proved challenging for most of the proteins we considered. In future, other labelling techniques may offer more promising routes towards short linker size, for example, nanobodies48 or aptamers49. Furthermore, the effect of restricted rotational freedom is of great importance, as it affects the localization precision50. We show that for analysing purified virions, primary labelling offers a good compromise, introducing small to no bias and providing high localization precision.
We used our model-based analysis to accurately determine the diameters of different protein layers in purified virions and were thus able to build a structural model of the HSV-1 tegument architecture (Fig. 4). We observed significant differences in the diameter of all investigated protein layers and found that the central section of VP1/2 is located deep within the virus particle, featuring a diameter of onlyB122 nm. This is similar in size to the capsid itself, as established by prior EM studies5. This observation suggests that the central domain of VP1/2 may directly interact with the capsid, similar to the C-terminus of VP1/2 (ref. 43). In addition, our model suggests that the N-terminus of VP1/2 projects away from the capsid towards the
envelope, as both pUL37 and VP16 interact with the N-terminal domain of VP1/2 and were located near the envelope (Fig. 4b). To investigate this further, it would be interesting to measure particle diameters using antibodies specific to various epitopes along the length of VP1/2, in particular the N-terminus.
In addition, our data demonstrate that the spatial distribution of tegument proteins within a virion cannot necessarily be inferred from the stability of their attachment to the capsid. pUL37 is commonly defined as an inner tegument protein, partly due to its interaction with VP1/2 (ref. 12) and the resistance of both these proteins to removal from purified capsids51. Here we have shown that the N-terminal region of pUL37 is located close to VP16 and in proximity to the envelope. Interestingly, pUL37 has recently been shown to interact with the gK/pUL20 envelope protein complex52, implying that pUL37 could span the tegument, linking VP1/2 to the envelope. In addition, VP16 is known to interact with the cytoplasmic domains of other envelope glycoproteins41,42. These previous findings support our observations using super-resolution microscopy, which showed that both VP16 and pUL37 are located close to the envelope. It will be important in the future to also determine the spatial distribution of other tegument proteins to complete the model of the architecture of this complex structural domain.
It would be interesting to take advantage of the molecular counting capabilities of SMLM techniques, as described for PALM28,29 via the use of photo-activatable fluorescent protein and more recently for dSTORM30 via immunolabelling with synthetic dyes. However, this approach requires extensive calibration protocols30and will be the topic of future studies.
VP1/2 or not, it is unclear whether this discrepancy in spatial offset for VP16 and pUL37 is a genuine reflection of a different intra-virion distribution of the proteins or not. Future studies with other specific antibodies against VP16 and pUL37 should clarify this.
We have demonstrated the use of 2DdSTORM and particle averaging for the precise determination of 3D protein radial distribution in virus particles. In principle, 3D SMLM imaging techniques can also be used, such asdSTORM with astigmatic55 or biplanar56 detection schemes. Our method retain the high lateral resolution of 2DdSTORM techniques while recovering 3D information by taking into account the spherical symmetry of the particle. The same approach is applicable for any spherical system, such as other complex viruses, including coronaviruses (for example, the SARS, severe acute respiratory syndrome, or MERS, Middle East respiratory syndrome, coronaviruses) and rotaviruses. However, the spherical symmetry is not an a priori
constraint: any system is amenable to the methods presented here as long as structural information is available for accurate modelling of the SMLM data. For more complex structures, the alignment may require more complex algorithms, such as those reported for the alignment of nuclear pore complexes34. Another powerful approach to consider would be correlative imaging, combining optical fluorescence microscopy and EM as demonstrated previously57. This approach would potentially reveal structural information (notably on the capsid) to complement the molecule-specific fluorescence imaging.
In summary, we have developed the use ofdSTORM combined with particle averaging and modelling, to reveal hitherto unknown structural details of a complex virus. The data obtained with the presented methods establish SMLM as a high precision tool for structural investigations of virus particle architecture, offering excellent molecular specificity and the potential for the use in complex biological environments.
Methods
Cell lines and viruses.HaCaT cells58were grown in Glasgow minimal essential
medium supplemented with 10% FCS, 2 mM glutamine, 100 U ml1penicillin and 100 g ml1streptomycin. Vero cells (from ATCC) and telomerase immortalized human foreskin fibroblasts (HFF-TERT59) were maintained in DMEM completed
with 10% fetal bovine serum (FBS), 2 mM glutamine, 100 U ml1penicillin and
100 g ml1streptomycin. A bacterial artificial chromosome cloned HSV-1 genome isolate (strain KOS) was used in these studies and was described previously60. VP26-mTurquoise and EYFP-gM viruses were prepared using Red Recombination of bacterial artificial chromosome cloned HSV-1 genome61by replacing amino acids 1–4 of VP26 with mTurquoise and adding EYFP(A206K) to the C-terminus of gM. To prepare purified viruses, HaCaT cells were infected at 0.01 plaque-forming unit (PFU) per cell and incubated for 3 days. Supernatants were collected and cleared by low-speed centrifugation. The viruses obtained from the culture supernatants were pelleted at 24,000gfor 2 h and resuspended in PBS with 1% FBS. Viruses were further purified by 5–15% Ficoll gradient ultracentrifugation at 17,500gfor 1.5 h. Visible virus band was collected and spun down at 49,000gfor 2 h. Pellet was resuspended in PBS, aliquoted and stored at70°C. Virus titre was assessed by titration in Vero cells.
Antibodies preparation and labelling.Monoclonal antibodies against VP16 (LP1; Abcam (Ab110226)), gD (LP2) and VP1/2 (CB4) were described pre-viously14,62,63. To generate HSV-1 pUL37-specific monoclonal antibodies, female BALB/c mice were infected with HSV-1 (strain 17) by ear scarification followed by an intraperitoneal boost 1 month later. Spleens were harvested 3 days later, and B-cell hybridomas were generated as previously described64. Hybridoma
supernatants were screened for reactivity in immunofluorescence assays by using cells transfected with an HSV-1 pUL37 expression plasmid. A cloned hybridoma line secreting antibodies with a strong reactivity to HSV-1 pUL37 was selected and named CB8. Secondary AF antibodies were purchased from Molecular Probes, anti-mouse IgG1 conjugated to ATTO 532 were from Rockland antibodies and assays. AF647 succinimidyl ester was from Molecular Probes. Monoclonal antibodies were purified from hybridoma supernatants using Protein A or G sepharose 4B fast flow from Sigma. Fab fragments were prepared using Pierce Mouse IgG1 Fab and F(ab0)
2preparation kit for LP1 (IgG1) and Pierce Fab Preparation Kit for LP2 (IgG2a), CB8 (IgG2a) and CB4 (IgG2b), following the manufacturer’s instructions. Primary antibodies and Fab fragments were
labelled with succinimidyl ester AF probe as follows. Probe was dissolved in dissolved in dimethylformamide to concentration 1 mg ml1immediately prior reaction. Molecular ratio of probe to protein was set to 2.5. One hundred micrograms of antibody/Fab was incubated with probe in 50 mM NaHCO3 for 1 h. Labelled antibody was purified from unbound dye directly after reaction using NAP5 Sephadex G-25 column from GE Healthcare. Average degree of labelling was between 1.0 and 1.5, as determined using instructions from Molecular Probes.
Labelling viruses.Lab-Tek II chambers were first blocked with 2 M glycine and coated with poly-L-lysine. Viruses (4106PFU) was bound for 1 h and then fixed with 3% EM-grade formaldehyde. Blocking and permeabilization was performed with 0.1% Triton X-100, 2% FBS in PBS and followed by antibody binding. Typically, primary antibodies were used at 100mg ml1and secondary at a
dilu-tion of 1/500. An addidilu-tional post-staining fixadilu-tion step using 3% EM-grad for-maldehyde was included to prevent antibodies detaching from antigens.
Infection assay.HFF cells were seeded onto Lab-Tek II dish after glycine blocking the plate. The next day, cells were infected with KOS VP26-mTQ/gM-EYFP virus at 5 PFU per cell. After 12-h infection, cells were fixed, permeabilized and labelled with antibodies as described above.
dSTORM imaging.The imaging was performed on inverted total internal reflection fluorescence (TIRF) microscopes (Nikon TE-300 and Olympus IX-71, Japan) custom-built fordSTORM acquisition, as previously described22,65,66. The Nikon TE-300 microscope was equipped with an iXon3 897 EM-CCD camera (Andor, UK) and the Olympus IX-71 was equipped with two iXon DU897 EM-CCD cameras (Andor). The dyes were irradiated with lasers and their fluorescence collected with appropriate band-pass filters using the following laser-filter combinations: 640 nm diode laser (either iBeam Smart, Toptica, Germany, or Cube 640-100C, Coherent, USA) and 676/37 or 679/41 (Semrock, USA) for AF647, 561/568 nm laser (either 561 DPSS, Oxxius, France, or 568LP, Coherent) and 607/ 70 (Semrock) for AF568, 532 nm Nd:YAG laser (Nano 250-532-100, Linos, Germany) and 582/75 (Semrock) for ATTO532, 491 nm DPSS laser (Cobolt, Sweden) and 530/55 (Semrock) for EYFP and 405 nm diode laser with 530/55 (Semrock) for mTurquoise. For single-colourdSTORM imaging using AF647, the switching buffer was composed of 100 mM mercaptoethylamine (Sigma) in PBS solution at pH 8.2. For each field of view, a time series of up to 30,000 frames was acquired with 15 ms exposure and 1–2 kW cm2irradiance. Subsequently, fluorescence emission from AF568 and mTurquoise were acquired (100 frames and 100 ms exposure).
For two-colourdSTORM acquisition, between 15,000 and 30,000 frames were acquired for each channel at a frame rate of 10–100 Hz. AF647/AF568, AF647/ AF546 and AF647/ATTO532 were excited with irradiation intensities at 2– 5 kW cm2in switching buffer (Supplementary Note 7). The imaging of purified viruses was carried out using TIRF illumination. For cell imaging, highly inclined illumination67was used.
Localization and super-resolution image reconstruction.AlldSTORM data set were analysed using rapidSTORM 3.3 (ref. 68). In addition, for two-colour
dSTORM imaging, the chromatic offset between the channels was corrected by using image registration (Fiji, bUnwarpJ69). The chromatic transformations were obtained from white fluorescent microspheres (100 nm TetraSpeck microsphere, Invitrogen).
Virus particle averaging and parameter fitting analysis.All analysis subsequent todSTORM image reconstruction was performed using custom-written MATLAB routines (Mathworks). Briefly, the fluorescence image stacks obtained for mTur-quoise and AF568 were independently averaged and converted into masks by thresholding. The masks obtained were applied to thedSTORM image. The protein labelled with AF568 was chosen such that it is located in a different structure than that labelled with AF647. When AF647 was used to label a protein present in the tegument, AF568 was used to label a protein in the envelope (glycoproteins). Inversely, if AF647 was used to label a protein from the envelope, AF568 was used to label a protein in the tegument. Virus particles present in the maskeddSTORM image were then located by circular Hough transform70, allowing detection of circular structures and determination of the coordinates of their centre (see Supplementary Note 1).
The coordinates of the centre of each particle identified by circular Hough transform were used for particle alignment. The aligned localizations were used to produce the high-density super-resolved image, using the same image
The goodness of fit was assessed by calculating the corresponding reduced
w2parameter as shown in equation (1).
w2¼ 1
np1 Xn
i¼1
N rð Þ i Nmð Þri
ð Þ2
N rð Þi
ð1Þ
WhereN(ri) is the value of the experimental histogram at the radius binri,
Nm(ri) is the value of the histogram at the radiusriobtained from the MCV model,
nis the total number of bins in the radius histogram andpis the number of fitted parameters (p¼2).
The two fitted parameters (the shell diameter and thickness) are determined from the optimal fit along with their 95% confidence interval. In some cases, the analysis returned a value of zero for the thickness parameter. The thickness was then considered not determinable (shown as n.d. in Fig. 3).
The analysis of the capsid spatial offset is described in details in Supplementary Note 6.
The MATLAB routines for model-based and capsid spatial offset analysis used in this study are available from our website: http://wiki.laser.ceb.cam.ac.uk/wiki/ index.php/Resources.
References
1. Farooq, A. V. & Shukla, D. Herpes simplex epithelial and stromal keratitis: an epidemiologic update.Surv. Ophthalmol.57,448–462 (2012).
2. Whitley, R. J. & Kimberlin, D. W. Herpes simplex encephalitis: children and adolescents.Semin. Pediatr. Infect. Dis.16,17–23 (2005).
3. Nicoll, M. P., Proenc¸a, J. T. & Efstathiou, S. The molecular basis of herpes simplex virus latency.FEMS Microbiol. Rev.36,684–705 (2012).
4. Gru¨newald, K.et al.Three-dimensional structure of herpes simplex virus from cryo-electron tomography.Science302,1396–1398 (2003).
5. Zhou, Z. H. Seeing the herpesvirus capsid at 8.5 Å.Science288,877–880 (2000).
6. Brown, J. C. & Newcomb, W. W. Herpesvirus capsid assembly: insights from structural analysis.Curr. Opin. Virol.1,142–149 (2011).
7. Heldwein, E. E. & Krummenacher, C. Entry of herpesviruses into mammalian cells.Cell. Mol. Life Sci.65,1653–1668 (2008).
8. Roizman, H. & Knipe, D. inFields Virology2399–2460 (Lippincott Williams and Wilkins, 2001).
9. Desai, P. J. A null mutation in the UL36 gene of herpes simplex virus type 1 results in accumulation of unenveloped DNA-filled capsids in the cytoplasm of infected cells.J. Virol.74,11608–11618 (2000).
10. Roberts, A. P. E.et al.Differing roles of inner tegument proteins pUL36 and pUL37 during entry of herpes simplex virus type 1.J. Virol.83,105–116 (2009). 11. Bucks, M. A., Murphy, M. A., O’Regan, K. J. & Courtney, R. J. Identification of interaction domains within the UL37 tegument protein of herpes simplex virus type 1.Virology416,42–53 (2011).
12. Vittone, V.et al.Determination of interactions between tegument proteins of herpes simplex virus type 1.J. Virol.79,9566–9571 (2005).
13. Sandbaumhu¨ter, M.et al.Cytosolic herpes simplex virus capsids not only require binding inner tegument protein pUL36 but also pUL37 for active transport prior to secondary envelopment.Cell. Microbiol.15,248–269 (2013). 14. Svobodova, S., Bell, S. & Crump, C. M. Analysis of the interaction between the essential herpes simplex virus 1 tegument proteins VP16 and VP1/2.J. Virol.
86,473–483 (2012).
15. Mossman, K. L., Sherburne, R., Lavery, C., Duncan, J. & Smiley, J. R. Evidence that herpes simplex virus VP16 is required for viral egress downstream of the initial envelopment event.J. Virol.74,6287–6299 (2000).
16. Hell, S. W. Microscopy and its focal switch.Nat. Methods6,24–32 (2009). 17. Patterson, G., Davidson, M., Manley, S. & Lippincott-Schwartz, J.
Superresolution imaging using single-molecule localization.Annu. Rev. Phys. Chem.61,345–367 (2010).
18. van de Linde, S., Heilemann, M. & Sauer, M. Live-cell super-resolution imaging with synthetic fluorophores.Annu. Rev. Phys. Chem.63,519–540 (2012). 19. Hell, S. W. & Wichmann, J. Breaking the diffraction resolution limit by
stimulated emission: stimulated-emission-depletion fluorescence microscopy.
Opt. Lett.19,780–782 (1994).
20. Betzig, E.et al.Imaging intracellular fluorescent proteins at nanometer resolution.Science313,1642–1645 (2006).
21. Rust, M., Bates, M. & Zhuang, X. Sub-diffraction-limit imaging by stochastic optical reconstruction microscopy (STORM).Nat. Methods3,793–795 (2006). 22. van de Linde, S.et al.Direct stochastic optical reconstruction microscopy with
standard fluorescent probes.Nat. Protoc.6,991–1009 (2011).
23. Ivanchenko, S.et al.Dynamics of HIV-1 assembly and release.PLoS Pathog.
5,e1000652 (2009).
24. Chojnacki, J.et al.Maturation-dependent HIV-1 surface protein redistribution revealed by fluorescence nanoscopy.Science338,524–528 (2012).
25. He, J.et al.Dual function of CD81 in influenza virus uncoating and budding.
PLoS Pathog.9,e1003701 (2013).
26. Malkusch, S., Muranyi, W., Mu¨ller, B., Kra¨usslich, H.-G. & Heilemann, M. Single-molecule coordinate-based analysis of the morphology of HIV-1
assembly sites with near-molecular spatial resolution.Histochem. Cell Biol.
139,173–179 (2013).
27. Muranyi, W., Malkusch, S., Mu¨ller, B., Heilemann, M. & Kra¨usslich, H.-G. Super-resolution microscopy reveals specific recruitment of HIV-1 envelope proteins to viral assembly sites dependent on the envelope C-terminal tail.
PLoS Pathog.9,e1003198 (2013).
28. Annibale, P., Vanni, S., Scarselli, M., Rothlisberger, U. & Radenovic, A. Quantitative photo activated localization microscopy: unraveling the effects of photoblinking.PLoS ONE6,e22678 (2011).
29. Lando, D.et al.Quantitative single-molecule microscopy reveals that CENP-A(Cnp1) deposition occurs during G2 in fission yeast.Open Biol.2,120078 (2012).
30. Ehmann, N.et al.Quantitative super-resolution imaging of Bruchpilot distinguishes active zone states.Nat. Commun.5,4650 (2014).
31. Hess, S. T.et al.Dynamic clustered distribution of hemagglutinin resolved at 40 nm in living cell membranes discriminates between raft theories.Proc. Natl Acad. Sci. USA104,17370–17375 (2007).
32. Sengupta, P.et al.Probing protein heterogeneity in the plasma membrane using PALM and pair correlation analysis.Nat. Methods8,969–975 (2011). 33. Schmied, J. J.et al.DNA origami-based standards for quantitative fluorescence
microscopy.Nat. Protoc.9,1367–1391 (2014).
34. Lo¨schberger, A.et al.Super-resolution imaging visualizes the eightfold symmetry of gp210 proteins around the nuclear pore complex and
resolves the central channel with nanometer resolution.J. Cell Sci.125,570–575 (2012).
35. Crump, C. M.et al.Alphaherpesvirus glycoprotein M causes the relocalization of plasma membrane proteins.J. Gen. Virol.85,3517–3527 (2004). 36. Heilemann, M.et al.Subdiffraction-resolution fluorescence imaging with
conventional fluorescent probes.Angew. Chem. Int. Ed. Engl.47,6172–6176 (2008).
37. Deschout, H.et al.Precisely and accurately localizing single emitters in fluorescence microscopy.Nat. Methods11,253–266 (2014).
38. Mortensen, K. I., Churchman, L. S., Spudich, J. A. & Flyvbjerg, H. Optimized localization analysis for single-molecule tracking and super-resolution microscopy.Nat. Methods7,377–381 (2010).
39. Harris, L. J., Larson, S. B., Hasel, K. W. & McPherson, A. Refined structure of an intact IgG2a monoclonal antibody.Biochemistry36,1581–1597 (1997). 40. Schrag, J. D., Prasad, B. V. V., Rixon, F. J. & Chiu, W. Three-dimensional
structure of the HSV1 nucleocapsid.Cell56,651–660 (1989).
41. Zhu, Q. & Courtney, R. J. Chemical cross-linking of virion envelope and tegument proteins of herpes simplex virus type 1.Virology204,590–599 (1994).
42. Gross, S. T., Harley, C. A. & Wilson, D. W. The cytoplasmic tail of Herpes simplex virus glycoprotein H binds to the tegument protein VP16 in vitro and in vivo.Virology317,1–12 (2003).
43. Coller, K. E., Lee, J. I.-H., Ueda, A. & Smith, G. A. The capsid and tegument of the alphaherpesviruses are linked by an interaction between the UL25 and VP1/ 2 proteins.J. Virol.81,11790–11797 (2007).
44. Mijatov, B., Cunningham, A. L. & Diefenbach, R. J. Residues F593 and E596 of HSV-1 tegument protein pUL36 (VP1/2) mediate binding of tegument protein pUL37.Virology368,26–31 (2007).
45. Schmid, M. F.et al.A tail-like assembly at the portal vertex in intact herpes simplex type-1 virions.PLoS Pathog.8,e1002961 (2012).
46. Bohannon, K. P., Jun, Y., Gross, S. P. & Smith, G. A. Differential protein partitioning within the herpesvirus tegument and envelope underlies a complex and variable virion architecture.Proc. Natl Acad. Sci. USA110,E1613–E1620 (2013).
47. Szymborska, A.et al.Nuclear pore scaffold structure analyzed by super-resolution microscopy and particle averaging.Science341,655–658 (2013). 48. Ries, J., Kaplan, C., Platonova, E., Eghlidi, H. & Ewers, H. A simple, versatile
method for GFP-based super-resolution microscopy via nanobodies.Nat. Methods9,582–584 (2012).
49. Opazo, F.et al.Aptamers as potential tools for super-resolution microscopy.
Nat. Methods9,938–939 (2012).
50. Lew, M. D., Backlund, M. P. & Moerner, W. E. Rotational mobility of single molecules affects localization accuracy in super-resolution fluorescence microscopy.Nano Lett.13,3967–3972 (2013).
51. Newcomb, W. W. & Brown, J. C. Structure and capsid association of the herpesvirus large tegument protein UL36.J. Virol.84,9408–9414 (2010). 52. Jambunathan, N.et al.Herpes simplex virus 1 protein UL37 interacts with viral
glycoprotein gK and membrane protein UL20 and functions in cytoplasmic virion envelopment.J. Virol.88,5927–5935 (2014).
53. Newcomb, W. W., Jones, L. M., Dee, A., Chaudhry, F. & Brown, J. C. Role of a reducing environment in disassembly of the herpesvirus tegument.Virology
431,71–79 (2012).
55. Huang, B., Wang, W., Bates, M. & Zhuang, X. Three-dimensional super-resolution imaging by stochastic optical reconstruction microscopy.Science
319,810–813 (2008).
56. Juette, M. F.et al.Three-dimensional sub-100 nm resolution fluorescence microscopy of thick samples.Nat. Methods5,527–529 (2008).
57. Lo¨schberger, A., Franke, C., Krohne, G., van de Linde, S. & Sauer, M. Correlative super-resolution fluorescence and electron microscopy of the nuclear pore complex with molecular resolution.J. Cell Sci.127,4351–4355 (2014). 58. Boukamp, P. Normal keratinization in a spontaneously immortalized aneuploid
human keratinocyte cell line.J. Cell Biol.106,761–771 (1988).
59. Sharma, G. G.et al.hTERT associates with human telomeres and enhances genomic stability and DNA repair.Oncogene22,131–146 (2003).
60. Gierasch, W. W.et al.Construction and characterization of bacterial artificial chromosomes containing HSV-1 strains 17 and KOS.J. Virol. Methods135, 197–206 (2006).
61. Tischer, B. K., Smith, G. A. & Osterrieder, N. En passant mutagenesis: a two step markerless red recombination system.Methods Mol. Biol.634,421–430 (2010). 62. McLean, C.et al.Monoclonal antibodies to three non-glycosylated antigens of
herpes simplex virus type 2.J. Gen. Virol.63,297–305 (1982).
63. Minson, A. C.et al.An analysis of the biological properties of monoclonal antibodies against glycoprotein D of herpes simplex virus and identification of amino acid substitutions that confer resistance to neutralization.J. Gen. Virol.
67,1001–1013 (1986).
64. Gill, M. B.et al.Murine gammaherpesvirus-68 glycoprotein H-glycoprotein L complex is a major target for neutralizing monoclonal antibodies.J. Gen. Virol.
87,1465–1475 (2006).
65. Erdelyi, M.et al.Correcting chromatic offset in multicolor super-resolution localization microscopy.Opt. Express21,10978–10988 (2013).
66. Kaminski Schierle, G. S.et al.In situ measurements of the formation and morphology of intracellularb-amyloid fibrils by super-resolution fluorescence imaging.J. Am. Chem. Soc.133,12902–12905 (2011).
67. Tokunaga, M., Imamoto, N. & Sakata-Sogawa, K. Highly inclined thin illumination enables clear single-molecule imaging in cells.Nat. Methods
5,159–161 (2008).
68. Wolter, S.et al.rapidSTORM: accurate, fast open-source software for localization microscopy.Nat. Methods9,1040–1041 (2012).
69. Arganda-Carreras, I.et al.inComputer Vision Approaches to Medical Image Analysis4241, 85–95 (Springer Berlin Heidelberg, 2006).
70. Atherton, T. J. & Kerbyson, D. J. Size invariant circle detection.Image Vis. Comput.17,795–803 (1999).
Acknowledgements
This work was supported by grants from the Leverhulme Trust (grant RPG-2012-793), the Royal Society (University Research Fellowship to C.M.C.), the Engineering and Physical Sciences Research Council, UK (grant EP/H018301/1) and by the Medical Research Council (grant MR/K015850/1).
Author contributions
R.F.L., A.A., S.v.d.L., C.M.C. and C.F.K. designed experiments. R.F.L., A.A. and S.v.d.L. performed experiments. R.F.L., E.J.R. and S.v.d.L. performed data analyses. C.M.C. and C.F.K supervised the project. All authors contributed to the writing of the manuscript.
Additional information
Supplementary Informationaccompanies this paper at http://www.nature.com/ naturecommunications
Competing financial interests:The authors declare no competing financial interests.
Reprints and permissioninformation is available online at http://npg.nature.com/ reprintsandpermissions/
How to cite this article: Laine, R. F.et al.Structural analysis of herpes simplex virus by optical super-resolution imaging.Nat. Commun.6:5980 doi: 10.1038/ncomms6980 (2015).