“A PROSPECTIVE, RANDOMIZED
PLACEBO-CONTROLLED STUDY EVALUATING THE
EFFECTIVENESS OF ORAL PREGABALIN AND
TRAMADOL FOR POSTOPERATIVE PAIN
MANAGEMENT IN PATIENTS UNDERGOING LUMBAR
LAMINECTOMY”
Dissertation submitted to
THE TAMILNADU DR. M.G.R.MEDICAL UNIVERSITY
in partial fulfilment for the award of the degree of
DOCTOR OF MEDICINE
IN
ANAESTHESIOLOGY
BRANCH X
INSTITUTE OF ANAESTHESIOLOGY & CRITICAL CARE
MADRAS MEDICAL COLLEGE
CHENNAI- 600 003
CERTIFICATE
This is to certify that the dissertation entitled, “A PROSPECTIVE, RANDOMIZED PLACEBO-CONTROLLED STUDY EVALUATING THE EFFECTIVENESS OF ORAL PREGABALIN AND TRAMADOL FOR POSTOPERATIVE PAIN MANAGEMENT IN PATIENTS UNDERGOING LUMBAR LAMINECTOMY” submitted by
Dr.V.REENA SANGES, in partial fulfilment for the award of the degree of Doctor of Medicine in Anaesthesiology by the Tamilnadu Dr. M.G.R. Medical University, Chennai., is a bonafide record of the work done by her in the INSTITUTE OF ANAESTHESIOLOGY & CRITICAL CARE, Madras Medical College and government hospital, during the academic year 2012-2015.
Prof. Dr. B. KALA M.D.,D.A., Dr. R. VIMALA M.D.
PROFESSOR AND DIRECTOR, DEAN,
INSTITUTE OF ANAESTHESIOLOGY MADRAS MEDICAL COLLEGE
AND CRITICAL CARE, & GOVT GENERAL HOSPITAL,
MADRAS MEDICAL COLLEGE, CHENNAI-600 003.
CHENNAI – 600 003.
CERTIFICATE BY THE GUIDE
This is to certify that the dissertation entitled, “A PROSPECTIVE, RANDOMIZED PLACEBO-CONTROLLED STUDY EVALUATING THE EFFECTIVENESS OF ORAL PREGABALIN AND TRAMADOL FOR POSTOPERATIVE PAIN MANAGEMENT IN PATIENTS UNDERGOING LUMBAR LAMINECTOMY” submitted by
Dr.V.REENA SANGES, in partial fulfilment for the award of the degree of Doctor of Medicine in Anaesthesiology by the Tamilnadu Dr. M.G.R. Medical University, Chennai., is a bonafide record of the work done by her in the INSTITUTE OF ANAESTHESIOLOGY & CRITICAL CARE, Madras Medical College and government hospital, during the academic year 2012-2015.
Prof. Dr. D. GANDHIMATHI M.D., D.A.,
Professor of Anaesthesiology,
Institute of Anaesthesiology & Critical Care,
DECLARATION
I hereby, solemnly declare that this dissertation entitled “A PROSPECTIVE, RANDOMISED PLACEBO-CONTROLLED STUDY EVALUATING THE EFFECTIVENESS OF ORAL PREGABALIN AND TRAMADOL FOR POSTOPERATIVE PAIN MANAGEMENT IN PATIENTS UNDERGOING LUMBAR LAMINECTOMY
”
is a bonafide work done by me in the Institute of Anaesthesiology and Critical Care, Madras Medical College and Government General hospital, Chennai, during the period 2012 to 2015 under the guidance of Prof. Dr.B.KALA M.D.,D.A., Director, Institute of Anaesthesiology and Critical Care, Madras Medical College and Government General Hospital, Chennai – 3 and submitted to The Tamilnadu Dr. MGR Medical University, Guindy, Chennai – 32, in the partial fulfilment of the requirements for the award of the degree of MD Anaesthesiology (Branch X), examinations to be held on April 2015.I have not submitted this dissertation previously to any university for the award of degree or diploma.
Place: Chennai, Dr.V.REENA SANGES
ACKNOWLEDGEMENT
I am extremely thankful to Dr.R.VIMALA M.D., Dean, Madras Medical College & Rajiv Gandhi Govt General Hospital, for her permission to carry out this study.
I am immensely grateful to Prof Dr.B.KALA M.D.,D.A., Director and Professor, Institute of Anaesthesiology and Critical Care, for her concern and support in conducting this study.
I am extremely grateful and indebted to my guide
Prof.Dr.D.GANDHIMATHI M.D.,D.A., Professor of Anaesthesiology, Institute of Anaesthesiology & Critical Care, for her concern, inspiration, meticulous guidance, expert advice and constant encouragement in preparing this dissertation.
I am very grateful to express my sincere gratitude to the Professors,
Institute of Anaesthesiology and Critical Care, for their constant motivation and valuable suggestions.
I am extremely thankful to my Assistant Professors for their guidance and expert advice in carrying out this study.
I am thankful to the Institutional Ethical Committee for their guidance and approval for this study.
My sincere thanks to the statistician, who played an important role during my study
I am thankful to all my colleagues, family and friends for their moral support, help and advice in carrying out this dissertation.
Last but not the least, I thank all the patients for willingly submitting themselves for this study.
CONTENTS
S.NO TOPIC PAGENO.
1 INTRODUCTION 1
2 AIMS AND OBJECTIVES 4
3 PAIN PATHWAY AND NEUROBIOLOGY OF
NOCICEPTION 5
4 PREVENTIVE ANALGESIA 12
5 MULTIMODAL APPROACH TO
PERIOPERATIVE RECOVERY 15
6 GABAPENTINOIDS IN PAIN MANAGEMENT 17
7 PHARMACOLOGY OF PREGABALIN 19
8 PHARMACOLOGY OF TRAMADOL 29
9 REVIEW OF LITERATURE 39
10 MATERIAL AND METHODS 47
11 OBSERVATION AND RESULTS 55
12 DISCUSSION 96
13 SUMMARY 101
14 CONCLUSION 104
15 BIBLIOGRAPHY 105
16 ANNEXURES
( i ) ETHICS COMMITEE APPROVAL ( ii ) ANTIPLAGIARISM SCREEN SHOT ( iii ) PATIENT CONSENT FORM
( iv ) PROFORMA ( v ) MASTER CHART
A PROSPECTIVE, RANDOMIZED, PLACEO-CONTROLLED STUDY EVALUATING THE EFFECTIVENESS OF ORAL PREGABALIN AND TRAMADOL FOR POSTOPERATIVE PAIN MANAGEMENT IN PATIENTS UNDERGOING LUMBAR LAMINECTOMY
ABSTRACT:
anaesthetic induction. Pregabalin showed stastistically significant analgesic and anxiolytic effect when compared to placebo but less than that of tramadol. Also, pregabalin was associated with less sedation than that of tramadol. Postoperative complications like nausea, vomiting, drowsiness was less in pregabalin group compared to placebo group. Also, pregabalin provided a stable hemodynamics throughout the intraoperative period and also prevented the pressor response to laryngoscopy and intubation similar to tramadol. The result of this study support the use of pregabalin for postoperative pain relief as it has fewer side effects, well tolerated and higher patient satisfaction.
KEYWORDS:
1
INTRODUCTION
Postoperative pain is one of the most feared problems among patients coming for surgery.
Postoperative pain management includes pain management22, prevention and treatment of postoperative complications90 and restoring preoperative function16.
Preventing pain and treating it is a big deal despite significant advancements in pain assessment and therapy2. By mobilising patients at the earliest, postoperative complications are reduced. It has been reported that roughly 80% of patients undergoing surgical procedures experience postoperative pain2. Pain on movement is comparatively resistant to opioids than the pain during rest91 and can lead to postoperative pulmonary49, cardiac33, and thromboembolic complications63, 56, 15.
The guidelines for postoperative pain treatment has been revised and drugs like S-ketamine, pregabalin, metamizole, oxycodone are used as new methods of preventing postoperative pain.45
2 A number of risk factors and predictors including the age, gender, surgical procedure, pre and postoperative pain, genes, psychosocial factors and pain modulation variables have been identified.
Together with an increased knowledge about the pathophysiology of chronic pain after surgery it may be possible to develop successful drugs and interventions in the near future.
Post-surgical pain is normally perceived as nociceptive pain. Surgical trauma causes central and peripheral sensitization and hyperalgesia which when untreated can lead to chronic postoperative pain after surgery.
Indeed pain is one among the three most common causes of delayed discharge after ambulatory surgery next to drowsiness and nausea/vomiting.
Antihyperalgesic drugs improve the postoperative pain by preventing the development of central sensitisation.99
The recent advance in postoperative pain management includes finding out the exact mechanism of action of drugs at molecular level, newer routes and modes of analgesic delivery.
3 continues in order to improve postoperative analgesia and reduce opioid related side effects.3
In this context, the gabapentinoids (gabapentin and pregabalin) have been extensively studied.
Gabapentinoids were successfully used in the treatment of trigeminal neuralgia, diabetic neuropathy, post herpetic neuralgia46, 14, 57, 77, 51, 18. In addition their usefulness for postoperative pain relief is also studied55, 7
4
AIMS AND OBJECTIVES
AIM:
The aim of my study is to assess and compare the efficacy and safety of preoperative administration of pregabalin and tramadol in patients undergoing elective lumbar laminectomy.
OBJECTIVES:
To measure the analgesic, anxiolytic and sedative effects by VAS score, anxiety score and Ramsay sedation score respectively.
To evaluate the intraoperative hemodynamics.
5
PAIN PATHWAYS AND THE NEUROBIOLOGY OF
NOCICEPTION
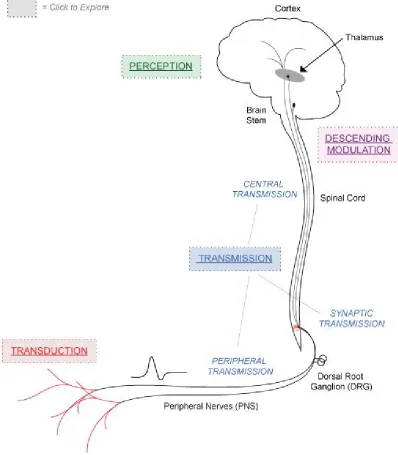
The physiological processes involved in nociception are
1. Transduction- process by which a noxious stimuli produced by tissue injury gets converted into electrical signals. It occurs in nociceptors (Free endings of Aδ and C fibres).
2. Transmission – process of pain impulse transmission by the nociceptors from periphery to the spinal cord and then to thalamus and finally to the cerebral cortex. Aδ and C fibres, spinothalamic and spinoreticular tracts are involved in this.
3. Modulation- process by which pain impulses produced are either inhibited or facilitated. It occurs peripherally in nociceptors and also in dorsal horn of the spinal cord and supraspinal structures.
6
7 Surgery produces tissue injury which results in release of histamine and inflammatory mediators such as peptides (e.g., bradykinin), lipids (e.g., prostaglandins), neurotransmitters (e.g., serotonin), and neurotrophins (e.g., nerve growth factor)51. This activates the peripheral nociceptors, which initiate transduction and transmission of nociceptive information to the central nervous system (CNS) as well as the process of neurogenic inflammation in which release of neurotransmitters (substance P and calcitonin gene–related peptide) in the periphery causes vasodilatation and plasma extravasation.51 Noxious stimuli are transduced by peripheral nociceptors and then transmitted
by Aδ and C nerve fibres from peripheral somatic and visceral sites to the dorsal horn of the spinal cord, where integration of peripheral nociceptive and descending modulatory input (i.e., norepinephrine, serotonin, encephalin,
8 functional nociceptors and activates dormant ones.18 Sensitization of peripheral nociceptors leads to decreased threshold for activation, increased rate of basal (spontaneous) discharge and increased rate of discharge with activation.18 It may also result in central sensitization (“persistent postinjury changes in the CNS that result in pain hypersensitivity”)55 and hyperexcit
ability (“exaggerated and prolonged responsiveness of neurons to normal afferent input after tissue damage”).55 Such noxious input may cause functional changes in the dorsal horn of the spinal cord which may later on cause postoperative pain to be perceived as more painful than it would have been. Thus the neural circuitry in the dorsal horn is extremely complex.
However, it seems that certain receptors (e.g., Nmethyldaspartate
[NMDA]) may be especially important and the second messenger effectors (e.g., substance P, protein kinase C) may also play important roles in spinal cord sensitization and development of chronic pain after acute pain.7 Thus
10
ACUTE AND CHRONIC EFFECTS OF POSTOPERATIVE PAIN
ACUTE EFFECTS58, 113, 25
Emotional and physical suffering
Sleep disturbance
Cardiovascular system: tachycardia, hypertension, increased oxygen consumption, myocardial ischemia, deep venous thrombosis
Respiratory system: decreases lung volumes, impairs cough, sputum retention, infection, atelectasis
Gastrointestinal system: reduces bowel motility
Genitourinary system: urinary retention
Central nervous system: anxiety
Endocrine system: increases catabolic hormones, increases blood glucose, causes sodium and water retention
Immunological impairment, infection, delayed wound healing.
11 CHRONIC EFFECTS:
Risk of development of chronic pain
Risk of behavioural changes especially in children
12
PREVENTIVE ANALGESIA
The concept of pain prevention was first introduced by Crile in 191324 and later developed by Wall96 and Wolf100.
Central sensitization and hyper excitability develop after surgical incision which results in amplification of postoperative pain.
Preventing the establishment of altered central processing by analgesics may result in short and long term benefits for the patient during convalescence.16
DEFINITION:
13 SCIENTIFIC RATIONALE:
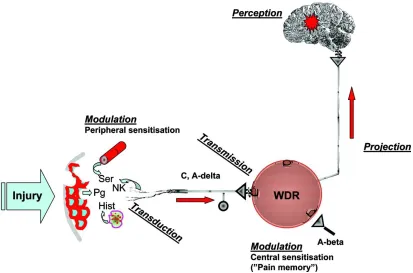
As already discussed above, tissue damage detected by free nerve endings (peripheral nociceptors) are transduced by them and transmitted by Aδ and C fibres to the dorsal horn of spinal cord.
The myelinated Aδ fibres conduct rapid, sharp and well localised pain called the first pain. Unmyelinated C fibres conduct duller, slower and poorly localised pain called the second pain.
The dorsal horn consists of two groups of neurons. Nociceptive specific (NS) neurons respond only to noxious stimuli from Aδ and C fibres. Wide dynamic range (WDR) neurons respond to both noxious stimuli and non- noxious stimuli from Aβ fibres (touch). Activity of WDR neurons depend on
excitatory and inhibitory input from nociceptive and non- nociceptive peripheral nerve fibres and descending input from supraspinal sites.
Tissue damage during surgery results in conduction of noxious stimuli from nociceptors to dorsal horn neurons (NS and WDR) which results in altered responsiveness of these neurons.
Stimuli from Aδ and C fibres are amplified (i.e.,) hyperalgesia and stimulus
from Aβ fibres are misinterpreted (i.e.,) allodynia. This is central
14 Pre-emptive analgesia may help to prevent the neurological and biochemical consequences of noxious input to central nervous system.
15
MULTIMODAL APPROACH TO PERIOPERATIVE
RECOVERY
Kehlet and Dahl were the first to describe the concept of combining multiple analgesic techniques in 199372
By applying multimodal strategy the analgesic benefits of controlling postoperative pain are generally maximised and opioid related adverse effects are reduced.
Multimodal analgesia is achieved by combining different analgesics that act by different mechanisms at different sites in the nervous system such that adequate analgesia is attained with lower doses and reduced incidence of side effects.
16 BENEFITS
Effective analgesia due to synergistic action.
It is useful in patients at risk for larger doses of opioids such as elderly, obstructive sleep apnoea and chronic pain patients.
Fewer side effects due to lower dosage of drug used.
17
GABAPENTINOIDS IN PAIN MANAGEMENT
Gabapentinoids (Pregabalin and Gabapentin) were originally introduced as antiepileptic but they also have analgesic, anticonvulsant and anxiolytic effects.
These drugs are easily tolerable and have limited side effects
GABAPENTIN
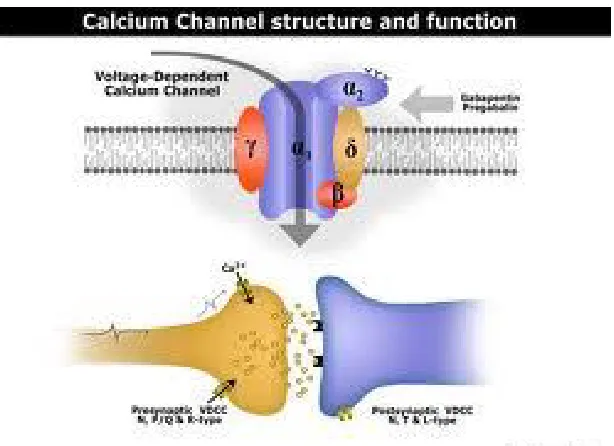
Gabapentin binds to the α-2 delta subunit of the presynaptic voltage gated calcium channel, inhibits the release of calcium, thereby preventing the release of excitatory neurotransmitters involved in the pain pathways.3, 44
Gabapentin has demonstrated the analgesic effect in postherpetic neuralgia, diabetic neuropathy and neuropathic pain.
18 PREGABALIN
Pregabalin is a structural analog of GABA (gamma amino- butyric acid).
Pregabalin acts by presynaptic binding to the α-2λ subunit of the voltage
gated calcium channel.
These channels are widely distributed in brain and the spinal cord.31
By binding to the calcium channels, pregabalin modulates the release of several excitatory neurotransmitters like norepinephrine, glutamate, substanceP, and calcitonin gene – related peptide.
This leads to inhibitory modulation of “overexcited neurons” and returns them back to their “normal” state.
It also reduces the hyperexcitability of dorsal horn neurons that is induced by tissue damage.31
19
PHARMACOLOGY OF PREGABALIN
30, 8Pregabalin belongs to the gabapentenoid group of drugs. It possesses chemical structure similar to inhibitory neurotransmitter GABA (gamma amino butyric acid). Pregabalin has got similar properties like the prototype drug gabapentin.
Figure 7.1 Chemical structure of Pregabalin
20 DRUG APPROVAL30
July 2004–European Commission, granted the pharmaceutical company Pfizer, approval for pregabalin for the treatment of peripheral neuropathy and as an adjunctive therapy for partial seizures in patients with epilepsy.
December 2004-The Food and Drug Administration (FDA) approved pregabalin, for the treatment of neuropathic pain associated with diabetic peripheral neuropathy and post herpetic neuralgia.
June 2005-The FDA approved pregabalin for use as an adjuvant in partial seizure treatment.
March 2006- Pregabalin got approval from European commission, for the treatment of generalised anxiety disorder
21 MECHANISM OF ACTION
Pregabalin is only structurally related to the inhibitory neurotransmitter GABA. It neither acts on GABA receptor, nor mimics it physiologically. The precise mode of action of pregabalin has not been fully elucidated. Pregabalin has got similar pharmacological profile as gabapentin. The main site of action of pregabalin is on the alpha 2 delta subunit of neuronal calcium channels.
PREGABALIN- AN ALPHA 2 DELTA LIGAND17
22 Voltage gated calcium channels are divided into six types P, Q, N, L, R, and T-type channels. N-type calcium channels are involved in pain sensitization phenomenon in response to noxious stimuli. Calcium channel blockers like nifedipine binds to L-type channels, whereas pregabalin binds to N-type. Cardiac and other peripheral tissues have L-type calcium channels. This explains the lack of cardiovascular side effects with pregabalin.
23 DOSAGE AND ADMINISTRATION
For painful diabetic peripheral neuropathy, the maximum recommended dosage is 100 mg thrice a day. Because pregabalin is eliminated primarily by renal excretion, the dose needs to be reduced in patients with reduced renal function. For peripheral neuropathy, dosing should begin at 75 mg per day, and may be increased to 300 mg per day within a week based on efficacy and tolerability.
PHARMACOKINETICS
24 DISTRIBUTION, METABOLISM, ELIMINATION
L-transporter is an important system which is responsible for the transport of substances across the brain and gut. Pregabalin is a substrate of this system and hence crosses blood brain barrier rapidly. This property is essential for a drug that influences central nervous system activity.
In humans, pregabalin undergoes less than 2% metabolism. It is excreted unchanged by the kidneys. In patients with compromised renal function the dose of pregabalin needs to be reduced. In patients with creatinine clearance between 30 to 60 ml/minute, daily dose of pregabalin needs to be reduced by 50% when compared to patients with creatinine clearance more than 60 ml/minute.
PREGABALIN VERSUS GABAPENTIN
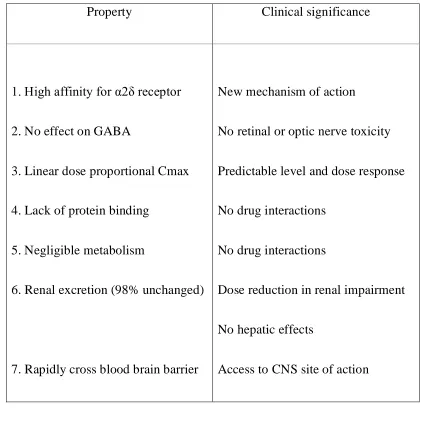
25 Table 7.1 Pharmacological properties of pregabalin8
Property Clinical significance
1. High affinity for α2δ receptor
2. No effect on GABA
3. Linear dose proportional Cmax
4. Lack of protein binding
5. Negligible metabolism
6. Renal excretion (98% unchanged)
7. Rapidly cross blood brain barrier
New mechanism of action
No retinal or optic nerve toxicity
Predictable level and dose response
No drug interactions
No drug interactions
Dose reduction in renal impairment
No hepatic effects
Access to CNS site of action
26 PREGABALIN LACKS DRUG - DRUG INTERACTIONS
Pregabalin does not bind to plasma proteins and is not subjected to hepatic metabolism. Studies done on human liver microsomes have demonstrated that pregabalin does not affect the cytochrome P450 system.
These facts indicate that pregabalin is unlikely to cause pharmacokinetic drug interactions. This property is important when administering pregabalin with other anticonvulsant drugs.
SAFETY IMPLICATIONS
27 CLINICAL USES
Highly effective adjunctive therapy in the treatment of partial seizures
Chronic pain syndromes like, diabetic peripheral neuropathy, and post herpetic neuralgia.
Chronic anxiety disorder.
Adjuvant in acute pain management.
Since pregabalin possess anticonvulsant, sedative, analgesic, and anti-hyperalgesic properties, studies are being done on potential perioperative uses like pre-operative sedation, anxiolysis, reduced intraoperative opioid requirement, and attenuation of hemodynamic stress response to laryngoscopy and tracheal intubation.
28 SIDE EFFECTS AND PRECAUTIONS
Pregabalin is a well-tolerated, relatively safe drug with dose-dependent adverse effects which are mild to moderate and usually transient.
1. Dizziness (29%)
2. Somnolence (22%)
3. Dryness of mouth (9.1%)
4. Blurred vision (6.4%)
5. Edema (6.1%)
6. Weight gain (5.6%)
7. Abnormal thoughts (5.4%)
There are case reports of myoclonus, gynaecomastia, and a single case report of carpus callosum edema. Withdrawal of pregabalin after long term therapy should be gradual as it may potentiate seizure activity.
29
PHARMACOLOGY OF TRAMADOL
Tramadol is a centrally acting atypical opioid with additional serotonin- norepinephrine reuptake- inhibitory action.36
It is marketed as a racemic mixture of both R- and S- enantiomers as they are known to complement each others analgesic efficacy. It is called an atypical opioid because apart from being a serotonin reuptake inhibitor it is a fairly weak µ-opioid receptor agonist.
CHEMICAL SRUCTURE OF TRAMADOL
[image:38.612.120.334.445.668.2](1R, 2R)- tramadol ; (1S, 2S)- tramadol
30 Tramadol is chemically [2-(dimethylaminomethyl)-1-(3-methoxyphenyl) cyclohexanol]. Tramadol has two stereogenic centres at the cyclohexane ring. Thus it may exist in four different configurational forms.
(1R,2R)-isomer
(1R,2S)-isomer
(1R,2S)-isomer
(1S,2R)-isomer
DRUG APPROVAL39-42
March 1995- FDA approval for treatment of moderate to moderately severe pain.
September 2005- FDA approval for extended release formulation
May 2005- FDA approval of Tramadol for orally disintegrating form for treatment of moderate to moderately severe pain.
31 MECHANISM OF ACTION42, 30, 26, 39, 66, 79, 59, 80, 78
Tramadol acts as a µ- opiod receptor agonist, serotonin releasing agent, norepinephrine reuptake inhibitor.
It is also an NMDA receptor antagonist, 5- HT2C receptor antagonist, nicotinic
acetyl choline receptor agonist, transient receptor potential cation channel (TRPV1) and M1 and M2 muscarinic acetylcholine receptor antagonist.
Tramadol has inhibitory action on 5- HT2C receptor which could be partially
responsible for tramadol’s reducing effect on depressive and obsessive- compulsive symptoms in patients with pain and comorbid neurological illness. It may also be responsible for its seizure lowering threshold. However, it may also be attributed to tramadol’s putative inhibition of GABAA receptors
at high doses.
32 DOSAGE AND ADMINISTRATION72
It can be administered by oral, intravenous, intramuscular and rectal routes.
It can be administered either as 50mg or 100mg every 4 to 6 hours not exceeding the dosage of 400mg per day.
PHARMACOKINETICS11,72
Tramadol has a linear pharmacological profile within the therapeutic range.
Absorption:
Tramadol is almost completely and rapidly administered after oral administration. Maximum plasma concentration (Cmax) is reached two hours
after oral administration. The mean serum concentration after intravenous injection is 1.46 times higher than that of oral administration. Tramadol can be administered without regard to food.
Its bioavailability in oral route is 70-75%, for rectal it is 77% and 100% for intramuscular route
Distribution:
33 protein binding is about 20 percent. Tramadol crosses the placental and blood brain barriers.
Metabolism:
Tramadol undergoes hepatic metabolism. It involves demethylation and glucuronidation via cytochrome P450 isozymes and metabolised to five different metabolites. Of these O- desmethyltramadol has 200 times affinity to µ- opioid receptor. Further, it has a elimination half- life of nine hours while that of tramadol is only six hours.
Phase II hepatic metabolism results in water- soluble metabolites which are then excreted by the kidneys. Thus, in renal and hepatic impairment doses may be reduced.
Excretion:
Tramadol and its metabolites are excreted mainly by kidneys (95%). Approximately 15- 19% of an administered dose is excreted as unmetabolised drug which increases in elderly to about 35%.
34 DRUG INTERACTIONS72, 76, 52
Potentially fatal drug interactions occur with drugs such as serotonergics, monoamine oxidase inhibitors, selective serotonin reuptake inhibitors, serotonergic antidepressants, certain analgesics (pethidine, oxycodone, dextromethorphan, fentanyl) .certain antibiotics (linezolid, isoniazid), certain anxiolytics,amphetamines, phenethylamine, lithium, methylene blue and a lot other therapeutic agents. Any agents that either induce or inhibit cytochrome P450 are likely to interact with tramadol as it is a substrate of these enzymes.
CLINICAL USES OF TRAMADOL76, 52, 76, 38, 19
Tramadol is used in the treatment of moderate to moderately severe pain in both acute and chronic setting.
35 INVESTIGATIONAL USES40, 41, 76, 36, 11, 82, 84, 101,98, 81
Diabetic neuropathy
Antidepressant
Postherpetic neuralgia
Acute opioid withdrawal syndrome
Obsessive-compulsive disorder
Premature ejaculation
Post- traumatic stress disorder
ADVERSE EFFECTS72,81, 48, 10, 13, 75
Very common: (>10% frequency)
Dizziness
Nausea
Vomiting
Constipation
36 Somnolescence
Common:(1-10% frequency)
Anxiety
Dyspepsia
Pruritus
Dry mouth
Malaise
Urinary retention
Visual disturbance
Miosis
Spasticity
37 Uncommon: (0.1-1% incidence)
Palpitation
Tachycardia
Postural hypotension
Gastrointestinal irritation
Urticaria
Flushing
Retching
Rare: (0.01-1% incidence)
Bradycardia
Hypertension
Dyspnoea
Tinnitus
Migraine
38 Hallucinations
Respiratory depression
Epileptiform convulsions
Stevens – Johnson syndrome
Hepatitis
Liver failure
Pulmonary edema
Gastrointestinal bleeding
Pulmonary embolism
39
REVIEW OF LITERATURE
There are a lot of studies on search for newer drugs apart from opioids for postoperative main management.
Shnekar BF et al.81 reviewed other studies regarding pregabalin’s pharmacology, pharmacokinectics, efficacy and adverse effects in the treatment of neuropathic pain, epilepsy and anxiety. Abstracts from professional meetings were also included. They concluded that pregabalin is effective and safe analgesic, antiepileptic and also an anxiolytic. It will provide a new treatment option for patients with neuropathic pain and partial epilepsy.
40 Jokela R et al.48 conducted a randomized controlled trial of perioperative administration of pregabalin for pain relief after laparascopic hysterectomy. In this study, they evaluated the control of pain after perioperative administration of pregabalin 300 or 600 mg. 91 patients scheduled for laparascopic hysterectomy were randomized to receive either diazepam 10mg, pregabalin 150mg or pregabalin 600 mg as premedication and the dose was repeated after 12 hours except the diazepam group where they received placebo. Until the first postoperative morning, analgesia was provided by oxycodone using patient controlled analgesia. This study concluded that perioperative administration of pregabalin 600mg decreases oxycodone consumption compared with diazepam 10mg but is associated with an increased incidence of side effects.
41 was less in patients who received pregabalin and the decrease in VAS score was also greater in patients who received pregabalin rather than placebo. Pregabalin administration was associated with greater pain tolerance in both the lower limbs than placebo at 24 hours postoperatively. Pregabalin, a membrane stabiliser, may decrease central senitization and subsequent peripheral pain. Thus perioperative pregabalin administration is associated with less pain intensity and improved functional outcomes 3 months after lumbar discectomy.
42 concentration in CSF was at 8 hours. The study concluded that sufficient central nervous system concentration are reached after oral administration of pregabalin, suggesting that postoperative pain hypersensitivity can be reduced. As this acute pain or spinal cord excitability is decreased, it may prevent chronic pain from developing after surgery.
43 Choi YS et al.20 conducted a study using a combination of pregabalin and dexamethasone for evaluating the postoperative pain and functional outcome in patients undergoing lumbar spinal surgery. In this randomised-controlled study,one hundred and eight patients were randomised into three groups. Group C received placebo+placebo, group P received pregabalin+placebo and group PD received pregbalin+dexamethasone. The pain intensity and side effects were assessed in the postoperative period upto 72 hours. Pain intensity and daily activity performance were also assessed 1, 3 and 6 months after surgery. Compared to group C, the pain scores were lower in group PD 24 hours after surgery and the frequency of additional rescue doses were significantly lower in group PD until 48 hours after surgery. The same were lower in group P for 24 to 48 hours relative to group C. Daily activity performance was better in group PD compared with group C at 1 month after surgery. This study concludes that combined administration of pregabalin and dexamethasone conferred analgesic benefits superior to those of pregabalin alone. Further it also facilitated the return to normal activity after surgery.
44 induction of anaesthesia and 75 mg twice daily for two postoperative days whereas the control group received placebo at similar timings. VAS score and sedation score were observed upto 48 hours after extubation. Time to extubation, tramadol consumption and side effects were also noted. The study concluded that perioperative pregabalin reduced pain scores at rest and deep breath and also reduced the consumption of tramadol in the post operative period without causing any delay in extubation or excess sedation.
45 In their study, Balaban F et al.22 analysed the efficacy of two different doses of preoperative pregabalin (150 mg and 300 mg) on pain relief and total opioid consumption after laparascopic cholecystectomy. Postoperative VAS scores, Ramsay sedation score and Aldrette scores were measured upto 24 hours after surgery. Additional opioid requirement and side effects if any, were also noted. The results of this study showed that preemptive pregabalin decreased pain scores and postoperative fentanyl requirement in patients undergoing laparascopic cholecystectomy in a dose dependent manner. There was also no difference in side effects between the two different groups on two different dosages.
46 Meet JM et al.61 conducted a study in which patients undergoing photorefractive keratectomy were given pregabalin 75mg twice daily for five days whereas the control group received placebo. Both groups received the standard pain care regimen. It was found that in pregabalin group there was lower pain scores and the frequency of rescue pain medications were also low.
47
MATERIALS AND METHODS
After obtaining institutional ethical commmitee approval and informed consent, the study was conducted in 75 patients belonging to American Society of Anaesthesiology- 1 (ASA) and ASA- 2 of either sex and age group between 20-60 years undergoing elective decompressive lumbar laminectomy.
This a prospective, randomised, single blinded study.
The study was conducted in Rajiv Gandhi Government General Hospital, Madras Medical College.
48 INCLUSION CRITERIA
Age – 20 years to 60 years
Weight - 40 to 70 kilograms
BMI - < 30 kilograms/metre square
ASA- 1 & 2
Surgery- elective lumbar decompressive laminectomy
Patients who have given valid informed written consent.
EXCLUSION CRITERIA
Patients not satisfying inclusion criteria
Patients posted for emergency surgery
Patients with renal insufficiency
Patients with liver disease
History of allergy or sensitivity to the drugs used
History of seizure disorder
49 PRIMARY AND SECONDARY OUTCOME
The primary outcome of the study was to measure the analgesic and anxiolytic efficacy of pregabalin and tramadol for postoperative pain while the secondary outcome was to assess the intraoperative hemodynamics and adverse effects of these drugs.
MATERIALS
Pregabalin capsules 150mg
Tramadol capsules 100mg
Placebo capsules
Drugs- Injection Midazolam, Injection Glycopyrrolate, Inj Fentanyl, Inj.Thiopentone Sodium, Inj. Vecuronium, Inj. Neostigmine, Sevoflurane, emergency drugs, Normal Saline and Ringer Lactate.
50 STUDY DESIGN
The patients satisfying inclusion criteria were randomly allocated into three groups each containing 25 patients. Randomisation was done by closed envelope method.
Group 1(placebo)- received a placebo capsule orally 1 hour before anaesthetic induction.
Group 2 (tramadol)- received a tramadol capsule 100mg orally 1 hour before anaesthetic induction.
Group 3(pregabalin)- received a pregabalin capsule 150mg 1 hour before anaesthetic induction.
All patients were visited the evening before surgery. They were explained about the study methods, the visual analogue scale chart and were provided with information sheet. All were orally premedicated with alprazolam 0.5mg at 10.00 pm, the previous night of surgery.
ANAESTHESIA PROTOCOL
51 thiopentone sodium (5 mg/kg of 2.5% solution).Endotracheal intubation was facilitated by using vecuronium bromide as muscle relaxant in the dosage of 0.1mg/kg. Anaesthesia was maintained with N2O:O2 (66:33) and with
sevoflurane.
Standard monitoring included non invasive blood pressure monitoring, electrocardiogram, end tidal concentration of carbon dioxide and pulse oximetry.
Intravenous fluids, Normal Saline and Ringer’s Lactate, were administered at the rate of 100 ml/hour. There was minimal blood loss in the surgery.
All patients were given antiemetic ondansetron 4mg i.v.
At the end of the surgery, patients were extubated after the reversal of the residual neuromuscular blockade with inj.neostigmine (0.05 mg/kg) and inj. glycopyrrolate (0.01 mg/kg).
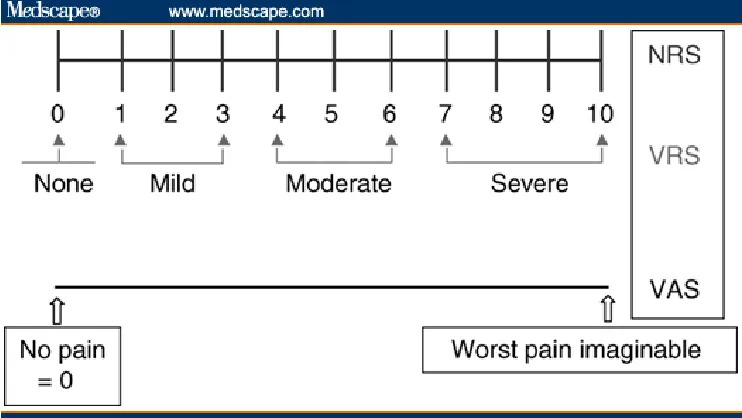
52 Pain quantification was done on a modified Visual Analog Scale Score between 0 and 10 (0 = no pain to 10 = worst imaginable pain.88
Figure 10.1 Visual Analog Scale Scoring
Sedation scores were based on Ramsay Sedation Scale.
RAMSAY SEDATION SCALE74
1— Patient anxious, agitated or restless or both
2— Patient co-operative, oriented and tranquil
3— Patient responds to commands only
4— Patient sedated with brisk response to stimulus
53 6— Patient sedated with no response to stimulus
[Stimulus indicates a light glabellar tap or loud command at ears]
ANXIETY SCORES75 were given by
1— fearful/afraid
2— worried
3— anxious
4— uneasy
5— calm and comfortable
The pain scores, sedation scores, anxiety scores were recorded preoperatively, after extubation then at 1, 2, 4 and 6 hours.
54 Postoperative blood pressure, heart rate, respiratory rate, postoperative pain, sedation, anxiety, total analgesic consumption were recorded at the end of 6 hours.
Side effects like nausea, vomiting, drowsiness, constipation and other complications, if any, were also recorded preoperatively, as well as 1, 2, 4 and 6 hours after extubation.
STATISTICAL ANALYSIS
Sample size was estimated by conducting a pilot study in 5 patients. The sample size needed was 50 for the power of the study to be 50% and alpha erroe to be 0.05. hence, considering the drop outs the sample size was chosen as 75.
55
OBSERVATION AND RESULTS
The study was done in 75 patients of either sexes in the age group of 20 to 60 years, belonging to ASA class-1 and ASA class- 2, undergoing elective lumbar laminectomy under general anaesthesia.
The patients were categorised into three groups
Group 1 - placebo
Group 2 - tramadol
56 DEMOGRAPHIC PROFILES
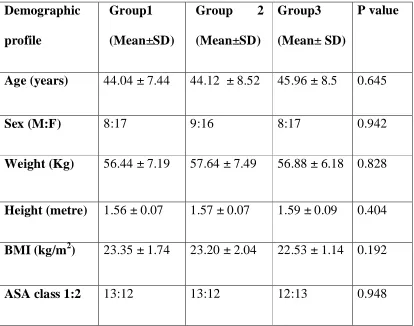
[image:65.612.120.534.267.593.2]The demographic profiles like age, sex, weight, height, BMI, ASA status were comparable between the three groups as shown in table 11.1.
Table 11.1 : Demographic profiles of the three groups
Demographic profile
Group1 (Mean±SD)
Group 2 (Mean±SD)
Group3 (Mean± SD)
P value
Age (years) 44.04 ± 7.44 44.12 ± 8.52 45.96 ± 8.5 0.645
Sex (M:F) 8:17 9:16 8:17 0.942
Weight (Kg) 56.44 ± 7.19 57.64 ± 7.49 56.88 ± 6.18 0.828
Height (metre) 1.56 ± 0.07 1.57 ± 0.07 1.59 ± 0.09 0.404
BMI (kg/m2) 23.35 ± 1.74 23.20 ± 2.04 22.53 ± 1.14 0.192
57
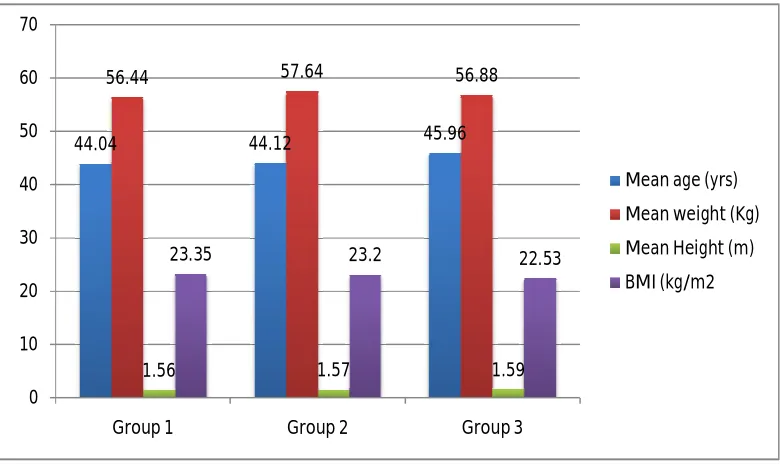
Figure 11.1: Comparison of demographic data among all the groups
The mean age of patients in group1 is 44.04 with a standard deviation of 7.44 and in group 2 the mean age is 44.12 with a standard deviation of 8.52 and in group 3 the mean age is 45.96 with a standard deviation of 8.5. The p value is 0.645, which is insignificant. So all the three groups are comparable in terms of age.
The mean weight of the patients in group 1 is 56.44 with a standard deviation of 7.19 and in group 2 are 57.44 with a standard deviation of 7.49 and in group 3 are 56.88 with a standard deviation of 6.18. The p value is found to be 0.828 which is not significant. Therefore the three groups are comparable in their weight.
44.04 44.12 45.96 56.44 57.64 56.88
1.56 1.57 1.59 23.35 23.2 22.53
0 10 20 30 40 50 60 70
Group 1 Group 2 Group 3
Mean age (yrs)
Mean weight (Kg)
Mean Height (m)
58 The mean height of patients in group1, group 2 and group 3 are 1.56, 1.57and 1.59 with a standard deviation of 0.07, 0.07 and 0.09 respectively. The p value is found to be 0.404 which is not significant. This implies that there is no significant difference in height among the three groups and they are comparable.
[image:67.612.120.510.408.641.2]The mean body mass index among group 1, group 2 and group 3 are 23.35, 23.20 and 22.53 with a standard deviation of 1.74, 2.04 and 1.14 respectively. The p value is 0.192 which is not significant. Therefore the body mass index is comparable among all the three groups.
Figure 11.2 Comparison of demographic data (gender distribution)
8
9
8 17
16
17
0 2 4 6 8 10 12 14 16 18
Group 1 Group 2 Group 3
Male
59 The figure 11.2 shows the gender distribution among all the three groups. The sex ratio (male:female) among group 1, group 2 and group 3 are 8:17, 9:16 and 8:17 respectively. The p value is found to be 0.942 which is not significant which shows the gender distribution among all the three groups is comparable.
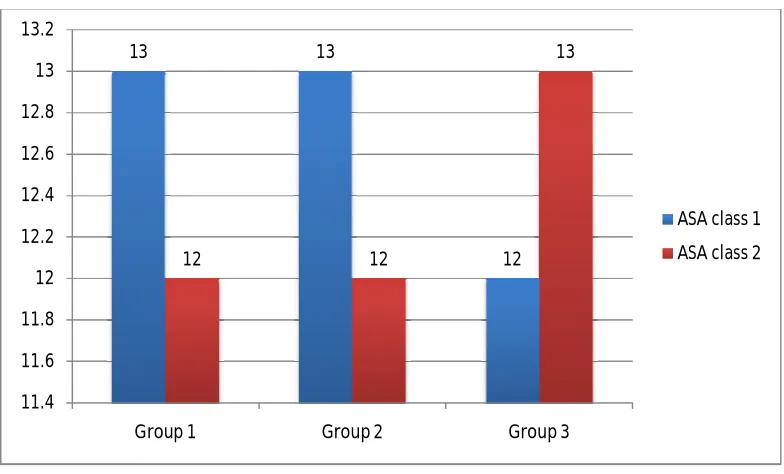
Figure 11.3 Comparison of ASA status among all the groups
The figure 11.3 shows the ASA status among all three groups. The ASA class1:2 ratios among the three groups 1, 2 & 3 are 13:12, 13:12 & 12:13 respectively. The p value is found to be 0.948 which is not significant. This implies that the ASA status among all the three groups is comparable.
13 13
12 12 12
13
11.4 11.6 11.8 12 12.2 12.4 12.6 12.8 13 13.2
Group 1 Group 2 Group 3
ASA class 1
60
Table 11.2 Duration of surgery and Spinal levels Group-1
Mean±SD)
Group-2 (Mean±SD)
Group-3 (Mean±SD)
P value
Duration of surgery (minutes)
148.00±15.00 144.80±11.3 146.40±17.29 0.63
Spinal levels (1:2) 12:13 11:14 13:12 0.852
The mean duration of surgery in minutes among group 1, group 2 and group 3 are 148±15, 148.80±11.3 and 146.40±17.29 respectively. The p value is found to be 0.63 which is insignificant. This shows that the mean duration of surgery among the three groups is comparable.
Figure 11.4 Mean duration of surgery among the three groups
148
144.8
146.4
143 144 145 146 147 148 149
Group 1 Group 2 Group 3
Mean Duration of surgery
61 The spinal levels of laminectomy (1:2) in group 1, group 2 and group 3 are 12:13, 11:14 and 13:12 respectively with a p value of 0.852 which shows that the groups are comparable.
Figure 11.5 Number of spinal segments operated among all the three groups
12
11
13 13
14
12
0 2 4 6 8 10 12 14 16
Group 1 Group 2 Group 3
Spinal level 1
62
Table 11.3 Baseline hemodynamic parameters of the three groups Parameter Group-1
(Mean±SD)
Group-2 (Mean±SD)
Group-3 (Mean±SD)
P-value
Heart rate 75.12 ± 4.49 74.84 ± 7.11 74.28 ± 6.60 0.422
Systolic blood pressure
122.00 ±11.09 122.24 ± 9.18 122.64 ±8.41 0.381
Diastolic blood pressure
78.92± 6.32 78.92 ± 9.10 78.04± 5.19 0.117
Mean arterial blood pressure
93.16± 7.64 93.24 ± 8.151 93.16 ± 5.41 0.101
63 Thus all three groups are comparable in their baseline hemodynamic parameters.
Figure 11.6 Comparison of Baseline hemodynamic parameters among all the groups
75.12 74.84 74.28 122 122.24 122.64
78.92 78.92 78.04 93.16 93.24 93.16
0 20 40 60 80 100 120 140
Group 1 Group 2 Group 3
HR
SBP
DBP
64
Table 11.4 Comparison of Baseline hemodynamic parameters among group 1 & 2
Parameter Group 1 (Mean±SD)
Group 2 (Mean±SD)
Mean
difference(1-2)
p-value
Heart rate 75.12 ± 4.49 74.84 ± 7.11 2.28 0.587
Systolic blood pressure
122.00±11.09 122.24±9.18 3.760 0.514
Diastolic blood pressure
78.92± 6.32 78.92 ± 9.10 3.120 0.368
Mean Arterial blood pressure
93.16 ± 7.64 93.24±8.151 3.720 0.212
[image:73.612.123.530.148.446.2]65
Table 11.5 Comparison of Baseline hemodynamic parameters between group 1 & 3
Parameter Group-1 (Mean±SD)
Group-3 (Mean±SD)
Mean
difference(1-3)
p-value
Heart rate 75.12 ± 4.49 74.28 ± 6.60 0.840 1.000
Systolic blood pressure
122.00±11.09 122.64 ±8.41 0.640 1.000
Diastolic blood pressure
78.92± 6.32 78.04± 5.19 0.880 1.000
Mean Arterial blood pressure
93.16 ± 7.64 93.16 ± 5.41 0.000 1.000
[image:74.612.120.533.146.475.2]66
Table 11.6 Trend in the heart rate Heart rate Group 1
(Mean±SD)
Group 2 (Mean±SD)
Group 3 (Mean±SD)
P value
Pre-op 80.36± 5.65 78.08 ± 6.44 80.32± 7.22 0.366
AI -1 min 90.52 ± 9.59 82.20± 5.06 82.48± 5.44 0.000#
AI -3 min 87.64 ± 8.61 81.88± 8.38 82.88± 7.80 0.026#
AI -5 min 81.44 ± 8.65 76.20 ± 7.19 77.76 ± 7.36 0.056
30 min 81.48 ± 4.71 72.56 ± 5.95 75.32 ± 6.38 0.000#
60 min 82.68 ± 5.23 71.36 ± 6.49 76.12 ± 7.02 0.000#
120 min 81.48 ± 4.71 70.92 ± 6.78 77.32 ± 6.46 0.000#
AE 97.76 ± 8.56 86.20 ± 6.81 91.68 ± 7.76 0.000# #- p value significant
The mean heart rate changes during different time intervals in group 1, 2 & 3 are shown in the above table. The p value appears to be significant in all the time intervals except preoperatively and five minutes after intubation.
67
Figure 11.7 Trend in the heart rate during various time intervals
0 20 40 60 80 100 120
Pre-op AI-1 min AI-3 min AI-5 min 30 min 60 min 120 min AE
Group 1
Group 2
68
Table 11.7 Heart rate changes between group 1& 2 during various time intervals
HeartRate Group 1 (Mean±SD)
Group 2 (Mean±SD)
Mean difference (1-2)
P value
Pre-op 80.36± 5.65 78.08 ± 6.44 2.280 0.674
AI -1 min 90.52 ± 9.59 82.20± 5.06 8.32 0.000#
AI -3 min 87.64 ± 8.61 81.88± 8.38 5.760 0.050#
AI -5 min 81.44 ± 8.65 76.20 ± 7.19 5.240 0.059
30 min 81.48 ± 4.71 72.56 ± 5.95 8.920 0.000#
60 min 82.68 ± 5.23 71.36 ± 6.49 11.320 0.000#
120 min 81.48 ± 4.71 70.92 ± 6.78 10.560 0.000#
AE 97.76 ± 8.56 86.20 ± 6.81 11.560 0.000#
#- p value significant
69
Table 11.8 Comparison of heart rate changes between group 1 & 3 at various time intervals
Heart Rate Group 1 (Mean±SD)
Group 3 (Mean±SD)
Mean difference (1-3)
P value
Pre-op 80.36± 5.65 80.32± 7.22 0.040 1.000
AI -1 min 90.52 ± 9.59 82.48± 5.44 8.040 0.010#
AI -3 min 87.64 ± 8.61 82.88± 7.80 4.760 0.049#
AI -5 min 81.44 ± 8.65 77.76 ± 7.36 3.680 0.294
30 min 81.48 ± 4.71 75.32 ± 6.38 6.160 0.001#
60 min 82.68 ± 5.23 76.12 ± 7.02 6.560 0.001#
120 min 81.48 ± 4.71 77.32 ± 6.46 4.160 0.040#
AE 97.76 ± 8.56 91.68 ± 7.76 6.080 0.001#
# - p value significant
70
Table 11.9 Trend in the systolic blood pressure SBP Group 1
(Mean±SD)
Group 2 (Mean±SD)
Group 3 (Mean±SD)
P value
Pre-op 124.00 ± 11.09 119.04 ± 8.35 119.12±9.93 0.133
AI-1 min 152.16 ± 22.09 125.04 ± 9.99 134.76 ± 15.64 0.000#
AI-3 min 129.16 ± 14.59 115.92 ± 16.49 119.56±7.92 0.003#
AI-5 min 122.28 ± 13.87 116.12 ± 9.19 116.64± 11.42 0.068
30 min 118.96 ± 12.37 108.76 ± 8.07 112.28 ± 10.55 0.018#
60 min 123.16 ± 12.16 111.00± 9.22 113.36 ± 10.41 0.007#
120 min 119.96 ± 12.37 114.48± 8.74 115.48 ± 10.48 0.265
AE 148.44 ± 20.61 117.28 ± 11.04 131.80 ± 15.71 0.000#
#- p value significant
71
Figure 11.8 Trend in the systolic blood pressure among the three groups
0 20 40 60 80 100 120 140 160
Pre-op AI-1 min AI-3 min AI-5 min 30 min 60 min 120 min AE
Group 1
Group 2
72
Table 11.10 Systolic blood pressure changes between group 1 & 2 SBP Group 1
(Mean±SD)
Group 2 (Mean±SD)
Mean difference (1-2)
P value
Pre-op 124.00 ±11.09 119.04 ± 8.35 4.960 0.238
AI-1 min 152.16 ±22.09 125.04 ± 9.99 27.120 0.000#
AI-3 min 129.16 ±14.59 115.92 ± 16.49 13.240 0.043#
AI-5 min 122.28 ±13.87 116.12 ± 9.19 6.16 0.150
30 min 118.96 ±12.37 108.76 ± 8.07 10.20 0.085
60 min 123.16 ±12.16 111.00± 9.22 12.16 0.079
120 min 119.96 ±12.37 114.48± 8.74 5.48 0.212
AE 148.44 ±20.61 117.28 ± 11.04 31.160 0.000#
# - p value significant
73
Table 11.11 Systolic blood pressure changes between group 1 & 3 SBP Group 1
(Mean±SD)
Group 3 (Mean±SD)
Mean difference (1-3)
P value
Pre-op 124.00 ± 11.09 119.12±9.93 4.880 0.253
AI-1 min 152.16 ± 22.09 134.76 ± 15.64 17.400 0.001#
AI-3 min 129.16 ± 14.59 119.56±7.92 9.600 0.099
AI-5 min 122.28 ± 13.87 116.64± 11.42 5.640 0.274
30 min 118.96 ± 12.37 112.28 ± 10.55 6.680 0.100
60 min 123.16 ± 12.16 113.36 ± 10.41 9.80 0.094
120 min 119.96 ± 12.37 115.48 ± 10.48 4.48 0.278
AE 148.44 ± 20.61 131.80 ± 15.71 16.640 0.002# # - p value significant
74
Table 11.12 Trend in the diastolic blood pressure DBP Group 1
(Mean±SD)
Group 2 (Mean±SD)
Group 3 (Mean±SD)
P value
Pre -op 78.28 ± 7.36 76.56 ± 9.38 77.44 ± 5.75 0.855
AI-1 min 99.52 ± 14.44 84.20 ± 11.84 90.96± 10.51 0.000#
AI-3 min 83.92 ± 9.88 75.56±11.96 80.20±11.26 0.033#
AI-5 min 81.28 ± 9.82 76.80±7.33 79.72 ± 8.55 0.183
30 min 73.52 ± 8.45 70.40±5.78 72.80 ± 5.78 0.270
60 min 75.20 ± 8.40 71.44 ± 5.65 74.60±9.26 0.130
120 min 73.52 ± 8.45 70.40 ± 9.42 72.40 ± 5.78 0.384
AE 93.96 ± 21.65 79.88 ± 9.06 88.04 ± 11.02 0.006# #- p value significant
75
Figure 11.9 Trend in the diastolic blood pressure
0 20 40 60 80 100 120
Pre-op AI-1 min AI-3 min AI-5 min 30 min 60 min 120 min AE
Group 1
Group 2
76
Table 11.13 Diastolic blood pressure changes between group 1 & 2 DBP Group 1
(Mean±SD)
Group 2 (Mean±SD)
Mean difference (1-2)
P value
Pre -op 78.28 ± 7.36 76.56 ± 9.38 01.72 1.000
1 min 99.52 ± 14.44 84.20 ± 11.84 15.32 0.000#
3 min 83.92 ± 9.88 75.56±11.96 08.36 0.028#
5 min 81.28 ± 9.82 76.80±7.33 04.48 0.211
30 min 73.52 ± 8.45 70.40±5.78 03.12 0.518
60 min 75.20 ± 8.40 71.44 ± 5.65 03.76 0.293
120 min 73.52 ± 8.45 70.40 ± 9.42 03.12 0.521
AE 93.96 ± 21.65 79.88 ± 9.06 14.08 0.004# # - p value significant
The mean diastolic blood pressure of group 2 is significantly decreased than that of group 1 at 1 & 3 minute after intubation and after extubation (p<0.05).
77
Table 11.14 Diastolic blood pressure changes in group 1and 3 DBP Group 1
(Mean±SD)
Group 3 (Mean±SD)
Mean difference (1-3)
P value
Pre -op 78.28 ± 7.36 77.44 ± 5.75 00.84 1.000
1 min 99.52 ± 14.44 90.96± 10.51 08.56 0.049#
3 min 83.92 ± 9.88 80.20±11.26 03.72 0.716
5 min 81.28 ± 9.82 79.72 ± 8.55 01.56 1.000
30 min 73.52 ± 8.45 72.80 ± 5.78 00.72 1.000
60 min 75.20 ± 8.40 74.60±9.26 00.60 1.000
120 min 73.52 ± 8.45 72.40 ± 5.78 01.12 1.000
AE 93.96 ± 21.65 8.04 ± 11.02 09.92 0.040# # - p value significant
78
Table 11.15 Trend in the mean arterial blood pressure MAP Group 1
(Mean±SD)
Group 2 (Mean±SD)
Group 3 (Mean±SD)
P value
Pre-op 93.28 ± 7.70 90.12 ± 8.57 91.60 ± 9.77 0.365
1 min 117.48 ± 18.07 97.08 ± 9.15 104.40 ± 13.38 0.000#
3 min 98.36 ± 11.05 87.64 ± 9.25 88.44 ± 13.30 0.011#
5 min 94.24 ± 10.40 87.88 ± 7.87 88.44 ± 9.15 0.050
30 min 86.88± 9.68 82.64± 7.88 83.88± 6.38 0.117
60 min 88.16 ± 9.17 80.66± 8.22 84.72± 6.63 0.038
120 min 86.60± 9.39 82.40 ± 8.34 84.80± 6.58 0.519
AE 114.16 ± 16.20 91.68± 8.93 102.44± 12.14 0.000# # - p value significant
79
Figure 11.10 Trend in the mean arterial blood pressure
0 20 40 60 80 100 120 140
Pre-op AI-1 min AI-3 min AI-5 min 30 min 60 min 120 min AE
Group 1
Group 2
80
Table 11.16 Mean arterial blood pressure changes in group 1 & 2 MAP Group 1
(Mean±SD)
Group 2 (Mean±SD)
Mean difference (1-2)
P value
Pre-op 93.28 ± 7.70 90.12 ± 8.57 03.160 1.000
1 min 117.48 ± 18.07 97.08 ± 9.15 20.400 0.000#
3 min 98.36 ± 11.05 87.64 ± 9.25 10.720 0.044#
5 min 94.24 ± 10.40 87.88 ± 7.87 06.360 1.000
30 min 86.88 ± 9.68 82.64 ± 7.88 04.240 1.000
60 min 88.16 ± 9.17 80.66 ± 8.22 07.500 0.821
120 min 86.60 ± 9.39 82.40 ± 8.34 04.200 1.000
AE 114.16 ± 16.20 91.68 ± 8.93 22.480 0.000#
# - p value significant
81
Table 11.17 Mean arterial blood pressure changes in group 1 and 3 MAP Group 1
(Mean±SD)
Group 3 (Mean±SD)
Mean difference (1-3)
P value
Pre-op 93.28 ± 7.70 91.60 ±9.77 01.680 0.663
1 min 117.48 ± 18.07 104.40 ± 13.38 13.080 0.005#
3 min 98.36 ± 11.05 88.44 ± 13.30 09.920 0.051
5 min 94.24 ± 10.40 88.44 ± 9.15 05.800 0.087
30 min 86.88 ± 9.68 83.88 ± 6.38 03.000 0.582
60 min 88.16 ± 9.17 84.72 ± 6.63 03.440 0.409
120 min 86.60 ± 9.39 84.80 ± 6.58 01.800 1.000
AE 114.16 ± 16.20 102.44 ± 12.14 11.720 0.005#
# - p value significant
82
Table 11.18 Pain scores in the three groups VAS Group 1
(Mean±SD)
Group 2 (Mean±SD)
Group 3 (Mean±SD)
P value
Pre-op 1.52 ± 0.510 0.68± 0.476 1.48± 0.510 0.000#
AE 4.84± .624 1.48± .510 3.12 ± 0.332 0.000#
1 hr 5.52± 0.510 2.00± 0.408 2.84± 0.374 0.000#
2 hr 6.48± 0.510 2.40± 0.500 3.40± 0.500 0.000#
4 hr 5.80± 0.408 2.32± 0.476 4.12± 0.332 0.000#
6 hr 5.72 ± 0.458 2.52 ± 0.510 4.08± 0.277 0.000#
# - p value significant
83
[image:92.612.121.511.78.309.2]Figure 11.11 Pain scores in the three groups at different time intervals
Table 11.19 Pain scores in group 1 and group 2 VAS Group 1
(Mean±SD) Group 2 (Mean±SD) Mean difference (1-2) P value
Pre-op 1.52 ± 0.510 0.68± 0.476 0.840 0.000#
AE 4.84± .624 1.48± .510 3.360 0.000#
1 hr 5.52± 0.510 2.00± 0.408 3.520 0.000#
2 hr 6.48± 0.510 2.40± 0.500 4.080 0.000#
4 hr 5.80± 0.408 2.32± 0.476 3.480 0.000#
6 hr 5.72 ± 0.458 2.52 ± 0.510 3.200 0.000# # - p value significant
1.52 4.84 5.52 6.48 5.8 5.72 0.68 1.48 2
2.4 2.32 2.52
1.48 3.12 2.84 3.4 4.12 4.08 0 1 2 3 4 5 6 7
Pre-op AE 1 hr 2 hr 4 hr 6 hr
Group 1
Group 2
84 The pain scores in group 2 is less than group 1 preoperatively, after extubation and 1, 2, 4 & 6 hours postoperatively and this difference is significant (p<0.05)
Table 11.20 Pain scores between group 1 and group 3 VAS Group 1
(Mean±SD)
Group 3 (Mean±SD)
Mean difference (1-3)
P value
Pre-op 1.52 ± 0.510 1.48± 0.510 0.040 1.000
AE 4.84± 0.624 3.12 ± 0.332 1.720 0.000#
1 hr 5.52± 0.510 2.84± 0.374 2.680 0.000#
2 hr 6.48± 0.510 3.40± 0.500 3.080 0.000#
4 hr 5.80± 0.408 4.12± 0.332 1.680 0.000#
6 hr 5.72 ± 0.458 4.08± 0.277 1.640 0.000#
# - p value significant
85
Table 11.21 Pain scores in group 2 and 3 VAS Group 2
(Mean±SD)
Group 3 (Mean±SD)
Mean difference (2-3)
P value
Pre-op 0.68± 0.476 1.48± 0.510 0.800 0.000#
AE 1.48± .510 3.12 ± 0.332 1.640 0.000#
1 hr 2.00± 0.408 2.84± 0.374 0.840 0.000#
2 hr 2.40± 0.500 3.40± 0.500 1.000 0.000#
4 hr 2.32± 0.476 4.12± 0.332 1.800 0.000#
6 hr 2.52 ± 0.510 4.08± 0.277 1.560 0.000#
# - p value significant
86
Table 11.22 Anxiety scores in the three groups AS Group 1
(Mean±SD)
Group 2 (Mean±SD)
Group 3 (Mean±SD)
P value
Pre-op 1.84± 0.37 0.20 ± 0.41 1.16 ± 0.37 0.000#
AE 1.72 ± 0.46 0.48± 0.51 1.16 ± 0.37 0.000#
1 hr 2.80± 0.41 0.40± 0.50 1.60± 0.50 0.000#
2 hr 3.52± 0.51 0.56± 0.51 1.96± 0.20 0.000#
4 hr 3.32± 0.48 0.60± 0.50 1.60± 0.50 0.000#
6 hr 3.32± 0.48 0.64 ± 0.49 1.64± 0.49 0.000# # - p value significant
[image:95.612.120.512.445.683.2]The mean anxiety scores in group 2 is less than group 3 which is less than group 1 and this difference is statistically significant.
Figure 11.12 Anxiety scores in the three groups at different time intervals
1.84 1.72 2.8 3.52 3.32 3.32 0.2
0.48 0.4 0.56 0.6 0.64 1.16 1.16 1.6 1.96 1.6 1.64 0 0.5 1 1.5 2 2.5 3 3.5 4
Pre-op AE 1 hr 2 hr 4 hr 6 hr
Group 1
Group 2
87
Table 11.23 Anxiety scores in group 1 & 2 AS Group 1
(Mean±SD)
Group 2 (Mean±SD)
Mean difference (1-2)
P value
Pre-op 1.84 ± 0.37 0.20 ± 0.41 1.640 0.000#
AE 1.72 ± 0.46 0.48 ± 0.51 1.240 0.000#
1 hr 2.80 ± 0.41 0.40 ± 0.50 2.400 0.000#
2 hr 3.52 ± 0.51 0.56 ± 0.51 2.960 0.000#
4 hr 3.32 ± 0.48 0.60 ± 0.50 2.720 0.000#
6 hr 3.32 ± 0.48 0.64 ± 0.49 2.680 0.000#
# - p value significant
88
Table 11.24 Anxiety scores between group 1 & 3 AS Group 1
(Mean±SD)
Group 3 (Mean±SD)
Mean difference (1-3)
P value
Pre-op 1.84± 0.37 1.16 ± 0.37 0.680 0.000#
AE 1.72 ± 0.46 1.16 ± 0.37 0.560 0.000#
1 hr 2.80± 0.41 1.60± 0.50 1.200 0.000#
2 hr 3.52± 0.510 1.96± 0.20 1.560 0.000#
4 hr 3.32± 0.48 1.60± 0.50 1.720 0.000#
6 hr 3.32± 0.48 1.64± 0.49 1.680 0.000# # - p value significant
89
Table 11.25 Anxiety scores between group 2 & 3 AS Group 2
(Mean±SD)
Group 3 (Mean±SD)
Mean difference (2-3)
P value
Pre-op 0.20 ± 0.41 1.16 ± 0.37 0.960 0.000#
AE 0.48± 0.51 1.16 ± 0.37 0.680 0.000#
1 hr 0.40± 0.50 1.60± 0.50 1.200 0.000#
2 hr 0.56± 0.51 1.96± 0.20 1.400 0.000#
4 hr 0.60± 0.50 1.60± 0.50 1.000 0.000#
6 hr 0.64 ± 0.49 1.64± 0.49 1.000 0.000# # - p value significant