Copyright © 2001, American Society for Microbiology. All Rights Reserved.
Evaluation of Accumulation of Hepatitis C Virus Mutations in a
Chronically Infected Chimpanzee: Comparison of
the Core, E1, HVR1, and NS5b Regions
LING LU,1TATSUNORI NAKANO,1ETSURO ORITO,2MASASHI MIZOKAMI,2ANDBETTY H. ROBERTSON1*
Hepatitis Branch, Division of Viral and Rickettsial Diseases, Centers for Disease Control
and Prevention, Atlanta, Georgia,1and Second Department of Medicine,
Nagoya City University Medical School, Nagoya, Japan2
Received 11 September 2000/Accepted 16 December 2000
Four hepatitis C virus genome regions (the core, E1, HVR1, and NS5b) were amplified and sequenced from yearly samples obtained from a chronically infected chimpanzee over a 12-year span. Nucleotide substitutions were found to accumulate in the core, E1, and HVR1 regions during the course of chronic infection; substitu-tions within the NS5b region were not detected for the first 8 years and were found to be minimal during the last 4 years. The rate of accumulation of mutations in the core and E1 regions, based on a direct comparison between the first 1979 sequence and the last 1990 sequence, was 1.120ⴛ10ⴚ3, while phylogenetic ancestral
comparison using the 12 yearly sequences showed a rate of 0.816 ⴛ10ⴚ3bases per site per year. Temporal
evaluation of the sequences revealed that there appeared to be periods in which substitutions accumulated and became fixed, followed by periods with relative stasis or random substitutions that did not persist. Synonymous and nonsynonymous substitutions within the core, E1, and HVR1 regions were also analyzed. In the core and E1 regions, synonymous substitutions predominated and gradually increased over time. However, within the HVR1 region, nonsynonymous substitutions predominated but gradually decreased over time.
Hepatitis C virus (HCV), a member of the flavivirus family, is the major causative agent of non-A, non-B hepatitis (3, 4). Genetic diversity of HCV can be categorized into two or three levels. Phylogenetic analysis of HCV sequences has identified six genotypes, or clades, some of which have discrete subtypes (23, 25). This level of diversity is the result of mutations during evolution of the virus and generally reflects a variety of geo-graphic regions. In addition, as has been found for most RNA viruses, HCV within an individual is composed of a group of closely related yet heterogeneous sequences (quasispecies) (16). The sequences of the quasispecies cluster around a dom-inant sequence (master sequence) that is the most abundant sequence in the population. This master sequence may or may not reflect the consensus sequence, which has been defined as the most frequently appearing nucleotide at a given position when a number of genomes in a quasispecies are sequenced (12) and is the sequence identified by direct sequencing of PCR products.
A number of studies have addressed the mutation rate of HCV and have estimated its range to be 0.4⫻10⫺3to 1.92⫻ 10⫺3 bases per site per year (1, 18, 20). These studies were based on paired HCV sequences that provided only two points for estimating this rate. The values were obtained by calculat-ing the number of nucleotide differences (direct comparison) between cloned fragments that might not reflect the consensus sequence. In addition, using direct comparison, the earlier
sequence is assumed to be the direct ancestor of the later sequence. Since HCV is composed of quasispecies, the two sequences may result from two coevolving variants derived from a common ancestor. If this is the case, the value obtained by direct comparison, using only two time points, would over-estimate this rate (14).
We used 12 yearly samples from a chimpanzee chronically infected with HCV to evaluate the rate of accumulation of mutations in four genome regions (the core, E1, HVR1, and NS5b) based on the consensus sequence determined by direct sequencing of PCR products. Two different methods were used for analysis of this information: (i) enumeration of nucleotide differences (direct comparison) and (ii) phylogenetic analysis (ancestral comparison).
A batch of human antihemophiliac factor, implicated in the transmission of non-A, non-B hepatitis (7), was intravenously inoculated into a chimpanzee and resulted in chronic hepatitis for 13 years (8). A plasma pool from this chimpanzee was used for characterization of the prototype HCV strain, HCV-1 (11). We selected archived serum samples from this chimpanzee from approximately the same time (February) each year from 1979 to 1990 (n ⫽12). In addition, five serum samples from 1982 were chosen to further investigate the accumulation of mutations.
RNA was extracted from 100 l of serum using Tripure (Boehringer Mannheim, Indianapolis, Ind.), and reverse tran-scription was performed using an antisense primer located at nucleotides (nt) 5379 to 5399 (M62321) and Superscript II reverse transcriptase (GIBCO/BRL, Rockville, Md.). The re-sulting cDNA was used to amplify a 4,657-bp fragment with primers HCV1 (nt 18 to 41, M62321) and HCV9 (nt 4653 to 4675, M62321). Nested PCR amplification was used to gener-* Corresponding author. Mailing address: Hepatitis Branch,
Divi-sion of Viral and Rickettsial Diseases, National Center for Infectious Diseases, Centers for Disease Control and Prevention, 1600 Clifton Rd. NE, MS A-33, Atlanta, GA 30333. Phone: (404) 639-2339. Fax: (404) 639-1563. E-mail: [email protected].
3004
on November 9, 2019 by guest
http://jvi.asm.org/
ate a 1,333-bp fragment using primers C1 (nt 276 to 298, M62321) and E2 (nt 1587 to 1608, M62321). The 1,333-bp fragment covers the complete core, E1, and HVR1 regions. Amplification of the NS5b fragment required a single round of PCR amplification and a pair of degenerate primers, ENO2 and ENO4, adapted from Enomoto et al. (13); the sequences were 5⬘-TGGGSTTYKCSTATGAYACCCGMTGYTTTG
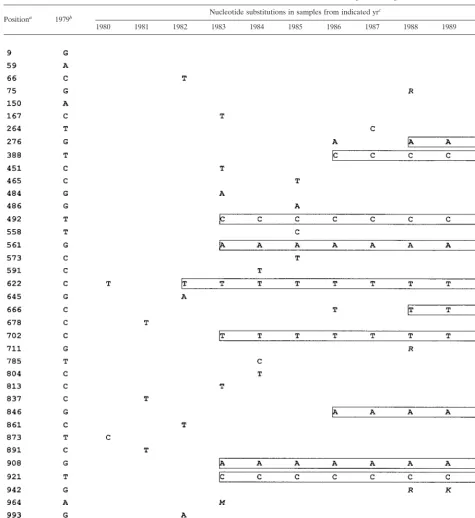
[image:2.612.66.541.83.600.2]A-3⬘(nt 8245 to 8275, M62321) for ENO2 and 5⬘-GGCKGA RTACCTRGTCATAGCCTCCGTGAA-3⬘ (nt 8616 to 8645, M62321) for ENO4. All amplifications were performed with the Advantage cDNA PCR kit (Clontech, Palo Alto, Calif.). The amplicons were gel purified and directly sequenced in both directions using dRhodamine terminators and electro-phoresed on an ABI 377 sequencer (PE Applied Biosystems, TABLE 1. Accumulation of nucleotide substitutions within the core-E1 genome region
Positiona 1979b Nucleotide substitutions in samples from indicated yr c
1980 1981 1982 1983 1984 1985 1986 1987 1988 1989 1990
aNucleotide positions in our sequences (accession numbers AF268569 to AF268580), counting from the initial polyprotein ATG. bNucleotides present in the 1979 sequence at the designated locations.
cDue to direct sequencing of PCR products, six degenerate nucleotides were generated and labeled with italic letters. Boxed nucleotides indicated substitutions that accumulated and became fixed.
VOL. 75, 2001 NOTES 3005
on November 9, 2019 by guest
http://jvi.asm.org/
Foster City, Calif.). All sequence information was analyzed using algorithms supplied by the Genetics Computer Group package.
A comparison of each yearly sequence with the 1979 se-quence revealed increasing numbers of substitutions within the core, E1, HVR1, and NS5b regions. Within the core and E1 regions, there was a gradual increase in substitutions (shown in Table 1), while the NS5b region had only one nucleotide change, which occurred late in the infection, and the overall number of substitutions within the HVR1 region was 10 times higher. HVR changes may result from the accumulation of random substitutions, changes in the predominant quasispecies
population, and immune pressure, while the NS5b region may have functional constraints that limit base changes (26). There-fore, the HVR1 and NS5b regions were excluded from further analysis when the rate of accumulation of mutations was cal-culated. The enumeration of nucleotide substitutions within the complete core and E1 regions using the 1979 and 1990 sequences gave a mutation rate of 1.12⫻10⫺3bases per site per year. This direct comparison method is the same as was used in three previous publications to estimate the rate of accumulation of HCV mutations (1, 18, 20).
[image:3.612.134.466.75.475.2]Since the 1979 and 1990 sequences could be derived from two variants descended from a common ancestor generated
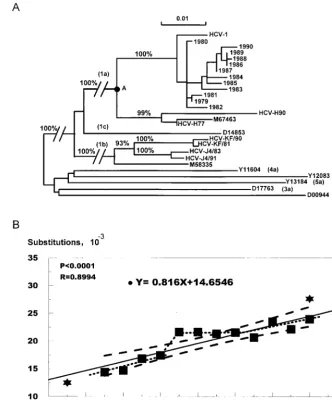
FIG. 1. Phylogenetic analysis of the 12 yearly HCV sequences from a chimpanzee chronically infected with HCV-1. (A) Neighbor-joining tree based upon the Jukes-Cantor one-parameter algorithm (15) for genetic distances using the 12 yearly sequences determined in this study and the following previously published sequences: HCV-H (M62381 and M62382) (18), HCV-J4 (D10687 and D10688) (20), HCV-KF (D01217 and D10750) (1), HCV-BK (M58335) (27), HC-G9 (D14853) (21), HCV-1 (M62321) (11), HC-J6 (D00944) (19), NZL1 (D17763) (24), ED43 (Y11604) (9), EUH1480 (Y13184) (10), and EUHK2 (Y12083) (2). The scale at the top indicates substitutions per site (branch length), and the circle labeled “A” indicates the common ancestor for HCV-1 and HCV-H. The percentages represent the values of bootstrap analysis resampled 1,000 times using the PHYLIP package. (B) Regression analysis of phylogenetic branch lengths to determine the rate of accumulation of mutations. The branch lengths (solid squares) of the 12 yearly sequences relative to the common ancestor A were plotted against time to estimate the rate of accumulation of mutations for HCV-1. The solid line represents the linear relationship based on this analysis. The dashed lines indicate the 95% confidence limits of the linear regression line. The dotted line indicates the alternative curve connecting the individual points. Stars indicate the values determined for the two H strain sequences H77 and H90 (20).
on November 9, 2019 by guest
http://jvi.asm.org/
prior to 1979, we performed a phylogenetic analysis (ancestral comparison) with all 12 sequences, other selected genotype 1 sequences, and prototype sequences representing the other genotypes to determine the rate of accumulation of mutations. A phylogenetic tree (Fig. 1A) was constructed using the 1,149-bp sequence covering the complete core and E1 regions. The 12 yearly sequences clustered together and the branch lengths generally increased with the length of infection. The branch length of each yearly isolate relative to the common ancestor of two different branches of subtype HCV-1a was
[image:4.612.53.550.81.567.2]determined (Fig. 1A). These values were plotted against the year the sample was collected, and the resulting relationship was eval-uated by regression analysis. Figure 1B shows the results of this analysis for the 12 yearly HCV-1 and paired HCV-H sequences (18). The slope (0.816) reflects the unit increase in substitutions over time and represents the rate of accumulation of mutations, 0.816⫻ 10⫺3bases per site per year. Ten of the twelve solid squares were well within the 95% confidence limits (Fig. 1B). The paired HCV-H sequences were within or close to the confidence limits defined by our study.
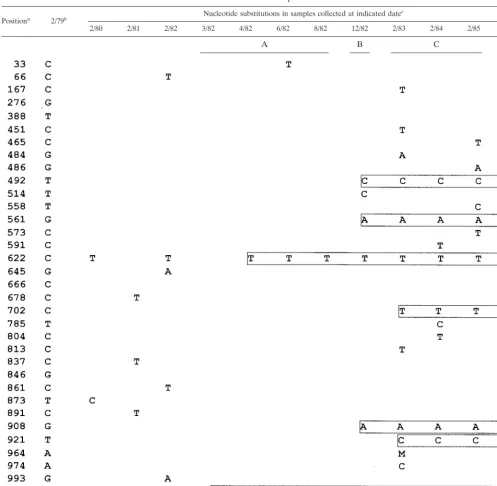
TABLE 2. Patterns of sequence shift
Positiona 2/79b Nucleotide substitutions in samples collected at indicated date c
2/80 2/81 2/82 3/82 4/82 6/82 8/82 12/82 2/83 2/84 2/85 2/86
A B C Dd
aNucleotide positions within the core-E1 region, counting from the initial polyprotein ATG. bNucleotides present in indicated positions at date of original sample collection (month/year).
cA, B, C, and D are nucleotide sequence patterns. Boxed nucleotides indicate substitutions that accumulated and became fixed. dThis pattern persisted until 1990.
VOL. 75, 2001 NOTES 3007
on November 9, 2019 by guest
http://jvi.asm.org/
The graph in Fig. 1B could be interpreted to indicate that the increase in nucleotide substitutions in this chimpanzee followed a linear pattern; however, inspection of the data points suggests that the relationship was not strictly linear. In addition, examination of the sequences from 1979 to 1982 reveals a pattern that is distinct from that of the sequences determined starting in 1983 (Table 1), and additional sequence shifts appear to have occurred between 1985 and 1986 and between 1987 and 1988 (Table 1). These nucleotide changes represent eight synonymous changes and three nonsynony-mous changes. The data shown in Table 1 are consistent with a punctuated substitution pattern that reflects the selective fixation of random substitutions or that may reflect the shift from one quasispecies variant population to another.
We investigated this further by selecting five additional sam-ples from the 1982 to 1983 time frame for amplification and sequencing and found that multiple sequence shifts occurred during this year. C1053appeared in March 1982 and was fol-lowed by the appearance of T622in April 1982 (Table 2). This pattern, pattern A, was maintained until December 1982, when three nucleotide changes were detected (C492, A561, and A908), resulting in sequence pattern B. Between December 1982 and February 1983, two additional nucleotide changes (T702and C929) accumulated, resulting in a sequence pattern (C) that persisted until 1985. A third sequence shift occurred during the year between the 1985 and 1986 samples; four additional nu-cleotide changes accumulated, resulting in sequence pattern D, which persisted for the remainder of the infection.
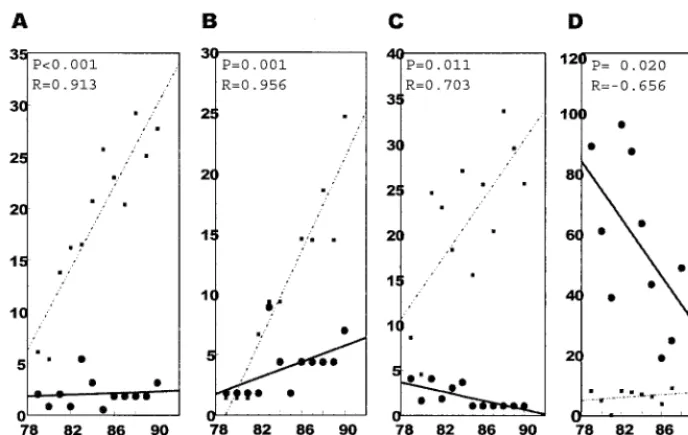
We also evaluated the core, E1, and HVR1 regions for synonymous and nonsynonymous substitutions. Phylogenetic trees were generated for the core to E1, core only, E1 only, and HVR1 regions, based on only synonymous or nonsynonymous substitutions, and regression analysis was performed using the resulting branch lengths. As shown in Fig. 2, synonymous sub-stitutions predominated and increased over time in the core
and E1 regions (Fig. 2A through C). The rates of accumulation of synonymous mutations for the core to E1, core only, and E1 only region were 2.0 ⫻ 10⫺3, 2.0 ⫻ 10⫺3, and 1.6⫻ 10⫺3, respectively. In contrast to the substitutions found within the core and E1 regions, nonsynonymous substitutions predomi-nated in the HVR1 region (Fig. 2D). Furthermore, it appeared by this analysis that nonsynonymous substitutions gradually decreased. An inspection of the HVR1 amino acid substitu-tions during the course of this infection revealed limited amino acid differences compared to those seen in H77 and H90 (data not shown). All of the differences were conservative and would not drastically alter the overall shape or properties of this region. Previous studies (17) have noted that changes within different HVR1 regions are not random, with homologous amino acid replacements being found within each genetic clade or genotype in human infections. Published data from other HCV-infected chimpanzees showed no or limited amino acid changes within the HVR1 region during infections lasting 1.9 and 8.3 years (6). As only 15 to 20% of chimpanzees generate detectable antibodies to E1 and E2 (6), the HVR1 region may be under less immune pressure in chimpanzees than in hu-mans.
[image:5.612.134.478.71.288.2]We have evaluated the nucleotide sequences of the core, E1, HVR1, and NS5b regions in a chronically infected chimpanzee over a period of 12 years. This is the first study of serial samples during chronic infection of a chimpanzee, and the sequence data have been used to estimate the rate of accumu-lation of mutations using the core and E1 genome regions and to evaluate the molecular patterns of changes in this HCV infection. Direct comparison of two paired sequences shows a higher rate than that found with the phylogenetic approach, a characteristic that has been noted by other investigators (14). We found this to be true not only of the data that we have generated but also of previously published paired sequences (data not shown) (1, 18, 20).
FIG. 2. Regression analysis to determine synonymous and nonsynonymous rates of accumulation of mutations in the core, E1, and HVR1 genome regions. (A) Core-E1 region as a whole; (B) core region only; (C) E1 region only; (D) HVR1 region. Solid lines, nonsynonymous mutations; broken lines, synonymous mutations.
on November 9, 2019 by guest
http://jvi.asm.org/
Infection of chimpanzees was used to define non-A, non-B hepatitis prior to the identification of the HCV agent and has served as an experimental model for HCV infection. However, recent data indicate that this model may have some limita-tions when applied to human infeclimita-tions. Chimpanzees appear to resolve chronic infections with a higher frequency than do humans (5), and the genetic diversity within an infected chim-panzee is much lower than that observed within human pop-ulations (5, 22). This indicates that the virus-host interaction in an HCV infection has an impact on the overall disease process and resolution. Our data are based on sequence information from a chronically infected chimpanzee, and comparable data from human chronic infections are needed to clearly define the process of mutations in the context of human disease.
Nucleotide sequence numbers.The sequences determined in this study have been given GenBank accession numbers AF268569 through AF268592.
We thank David Culver for helpful discussion of the data and Karen McCaustland and John Spelbring for assistance in sample retrieval.
REFERENCES
1.Abe, K., G. Inchauspe, and K. Fujisawa.1992. Genomic characterization and mutation rate of hepatitis C virus isolated from a patient who contracted hepatitis during an epidemic of non-A, non-B hepatitis in Japan. J. Gen. Virol.73:2725–2729.
2.Adams, N. J., R. W. Chamberlain, L. A. Taylor, F. Davidson, C. K. Lin, R. M. Elliott, and P. Simmonds.1997. Complete coding sequence of hepatitis C virus genotype 6a. Biochem. Biophys. Res. Commun.234:393–396. 3.Alter, H. J.1989. Chronic consequences of non-A, non-B hepatitis, p. 83–97.
InL. B. Seeff and J. H. Lewis (ed.), Current perspectives in hepatology. Plenum Medical, New York, N.Y.
4.Alter, M. J., H. S. Margolis, K. Krawczynski, F. N. Judson, A. Mares, W. J. Alexander, P. Y. Hu, J. K. Miller, M. A. Gerber, R. E. Sampliner, E. L. Meeks, and M. J. Beach.1992. The natural history of community-acquired hepatitis C in the United States. N. Engl. J. Med.327:1899–1905. 5.Bassett, S. E., K. M. Brasky, R. E. Lanford.1998. Analysis of hepatitis C
virus-inoculated chimpanzees reveals unexpected clinical profiles. J. Virol. 72:2589–2599.
6.Bassett, S. E., D. L. Thomas, K. M. Brasky, and R. E. Lanford.1999. Viral persistence, antibody to E1 and E2, and hypervariable region 1 sequence stability in hepatitis C virus-inoculated chimpanzees. J. Virol.73:1118–1126. 7.Bradley, D. W., E. H. Cook, J. E. Maynard, K. A. McCaustland, J. W. Ebert, G. H. Dolana, R. A. Petzel, R. J. Kantor, A. Heilbrunn, H. A. Fields, and B. L. Murphy.1979. Experimental infection of chimpanzees with antihemophiliac (factor VIII) materials: recovery of virus-like particles associated with non-A, non-B hepatitis. J. Med. Virol.3:253–269.
8.Bradley, D. W., K. Krawczynski, J. W. Ebert, K. A. McCaustland, Q. L. Choo, M. A. Houghton, and G. Kuo.1990. Parenterally transmitted non-A, non-B hepatitis: virus-specific antibody response patterns in hepatitis C vi-rus-infected chimpanzees. Gastroenterology99:1054–1060.
9.Chamberlain, R. W., N. Adams, A. A. Saeed, P. Simmonds, and R. M. Elliott. 1997. Complete nucleotide sequence of a type 4 hepatitis C virus variant, the predominant genotype in the Middle East. J. Gen. Virol.78:1341–1347. 10. Chamberlain, R. W., N. J. Adams, L. A. Taylor, P. Simmonds, and R. M.
Elliott.1997. The complete coding sequence of hepatitis C virus genotype 5a,
the predominant genotype in South Africa. Biochem. Biophys. Res. Com-mun.236:44–49.
11. Choo, Q.-L., G. Kuo, A. J. Weiner, L. R. Overby, D. W. Bradley, and M. Houghton.1989. Isolation of a cDNA clone derived from a blood-borne non-A, non-B viral hepatitis genome. Science244:359–362.
12. Duarte, E. A., I. S. Novella, S. C. Weaver, E. Domingo, S. Wain-Hobson, D. K. Clarke, A. Moya, S. F. Elena, J. C. de la Torre, and J. J. Holland.1994. RNA virus quasispecies: significance for viral disease and epidemiology. Infect. Agents Dis.3:201–214.
13. Enomoto, N., A. Takada, T. Nakao, and T. Date.1990. There are two major types of hepatitis C virus in Japan. Biochem. Biophys. Res. Commun.170: 1021–1025.
14. Ina, Y., M. Mizokami, K. Ohba, and T. Gojobori.1994. Reduction of syn-onymous substitutions in the core protein gene of hepatitis C virus. J. Mol. Evol.38:50–56.
15. Jukes, T. H., and C. R. Cantor.1969. Evolution of protein molecules, p. 21–132.InH. N. Munro (ed.), Mammalian protein metabolism. Academic Press, New York, N.Y.
16. Martell, M., J. I. Esteban, J. Quer, J. Genesca`, A. Weiner, R. Esteban, J. Guardia, and J. Go´mez.1992. Hepatitis C virus (HCV) circulates as a population of different but closely related genomes: quasispecies nature of HCV genome distribution. J. Virol.66:3225–3229.
17. McAllister, J., C. Casino, F. Davidson, J. Power, E. Lawlor, P. L. Yap, P. Simmonds and D. B. Smith.1998. Long-term evolution of the hypervariable region of hepatitis C virus in a common-source-infected cohort. J. Virol. 72:4893–4905.
18. Ogata, N., H. J. Alter, R. H. Miller, and R. H. Purcell.1991. Nucleotide sequence and mutation rate of H strain of hepatitis C virus. Proc. Natl. Acad. Sci. USA88:3392–3396.
19. Okamoto, H., S. Okada, Y. Sugiyama, K. Kurai, H. Lizuka, A. Machida, Y. Miyakawa, and M. Mayumi. 1991. Nucleotide sequence of the genomic RNA of hepatitis C virus isolated from a human carrier: comparison with reported isolates for conserved and divergent regions. J. Gen. Virol.72: 2697–2704.
20. Okamoto, H., M. Kojima, S. I. Okada, Hiroshi Yoshizawa, H. Iizuka, T. Tanaka, E. E. Muchmore, D. A. Peterson, Y. Ito, and S. Mishiro.1992. Genetic drift of hepatitis C virus during an 8.2-year infection in a chimpan-zee: variability and stability. Virology190:894–899.
21. Okamoto, H., M. Kojima, M. Sakamoto, H. Iizuka, S. Hadiwandowo, S. Suwignyo, Y. Miyakawa, and M. Mayumi.1994. The entire nucleotide se-quence and classification of a hepatitis C virus isolate of a novel genotype from an Indonesian patient with chronic liver disease. J. Gen. Virol.75:629– 635.
22. Ray, S. C., Q. Mao, R. E. Lanford, S. Bassett, O. Laeyendecker, Y. M. Wang, and D. L. Thomas.2000. Hypervariable region 1 sequence stability during hepatitis C virus replication in chimpanzees. J. Virol.74:3058–3066. 23. Robertson, B., G. Myers, C. Howard, T. Brettin, J. Bukh, B. Gaschen, T.
Gojobori, G. Maertens, M. Mizokami, O. Nainan, S. Netesov, K. Nishioka, I. T. Shin, P. Simmonds, D. Smith, L. Stuyver, and A. Weiner.1998. Clas-sification, nomenclature, and database development for hepatitis C virus (HCV) and related viruses: proposals for standardization. International Committee on Virus Taxonomy. Arch. Virol.143:2493–2503.
24. Sakamoto, M., Y. Akahane, F. Tsuda, T. Tanaka, D. G. Woodfield, and H. Okamoto.1994. Entire nucleotide sequence and characterization of a hep-atitis C virus of genotype V/3a. J. Gen. Virol.75:1761–1768.
25. Simmonds, P.1995. Variability of hepatitis C virus. Hepatology21:570–583. 26. Smith, D. B., S. Pathirana, F. Davidson, E. Lawlor, J. Power, P. L. Yap, and P. Simmonds1997. The origin of hepatitis C virus genotypes. J. Gen. Virol. 78:321–328.
27. Takamizawa, A., C. Mori, I. Fuke, S. Manabe, S. Murakami, J. Fujita, E. Onishi, T. Andoh, I. Yoshida, and H. Okayama.1991. Structure and orga-nization of the hepatitis C virus genome isolated from human carriers. J. Virol.65:1105–1113.
VOL. 75, 2001 NOTES 3009