RP-HPLC METHOD DEVELOPMENT AND VALIDATION
FOR ESTIMATION OF RELATED SUBSTANCES OF
ACETAMINOPHEN IN ACETAMINOPHEN,
PHENYLEPHRINE HCL AND
DEXTROMETHORPHANHBr SOFT GELATIN
CAPSULES
Dissertation
Submitted toTHE TAMILNADU Dr. M. G. R. MEDICAL UNIVERSITY
,
CHENNAI
In partial fulfilment for the award of the degree of In partial fulfilment for the award of the degree of In partial fulfilment for the award of the degree of In partial fulfilment for the award of the degree of
MASTER OF PHARMACY
IN
PHARMACEUTICAL ANALYSIS
261230051
DEPARTMENT OF PHARMACEUTICAL ANALYSIS
K. M. COLLEGE OF PHARMACY
APRIL-2014
CERTIFICATE
This is to certify that the dissertation entitled “RP-HPLC METHOD DEVELOPMENT AND VALIDATION FOR ESTIMATION OF RELATED SUBSTANCES OF ACETMINOPHEN IN ACETAMINOPHEN, PHENYLEPHRINE HCL AND DEXTROMETHORPHAN HBr SOFT GELATIN CAPSULES” submitted by NEELAM VEERAIAH(Reg. No: 261230051) in partial fulfilment of the degree of Master of Pharmacy in Pharmaceutical Analys is under The Tamilnadu Dr. M.G.R. Medical University, Chennai, done at K. M. COLLEGE OF PHARMACY, MADURAI-625107,is a bonafied work carried out by him under my guidance and supervision during the academic year 2013 - 2014. This dissertation partially or fully has not been submitted for any other degree or diploma of this university or any other universities.
GUIDE&HOD PRINCIPAL
Dr. M. Sundarapandian, M. Pharm.,Ph.D., Dr. S.Venkataraman, M. Pharm.,Ph.D.,
Professor and Head, Professor and Head,
Dept. of Pharmaceutical Analysis, Dept. of Pharmaceutical Chemistry,
K. M. College of Pharmacy, K. M. College of Pharmacy,
Madurai – 625107. Madurai – 625107.
CONTENTS
CHAPTER
NO TITLE PAGE NO
1 INTRODUCTION 01-20
2 PROFILE 21
2.1 DRUG PROFILE 21-23
2.2 IMPURITY DRUG PROFILE 24-25
3 LITERATURE REVIEW 26-33
4 AIM AND PLAN OF WORK 34
5 MATERIALS AND INSTRUMENTS USED 35-36
6
RP-HPLC METHOD DEVELOPMENT
37-42
7 METHOD VALIDATION 43-84
8 RESULTS AND DISCUSSION 85-87
9 CONCLUSION 88
BIBLIOGRAPHY
AN EXPRESION OF GRATITUDE “With God All Things Are Possible”
Milestones in life are achieved, not by individual efforts but by blessings and
guidance of elders, near and dear ones of collective wisdom and experience of all those who
have shared their views far this project is the product beyond those found within the covers of
book. I therefore take this opportunity to express my acknowledgement to all of them.
Let me first thank almighty for giving me life and my parents for educating me and
keeping my requirements in priority at all situations. Without their unconditional support and
encouragement it would have been impossible to pursue my interest.
It gives me immense pleasure to express my deepest thanks, heartfelt, indebtness and
regards to my respected guide, Dr. M. SUNDARAPANDIAN., M. Pharm.,Ph.D., Professor and HOD., Dept. of Pharmaceutical Analysis, K. M. College of Pharmacy, Madurai, for providing much of the stimuli in the form of suggestions, guidance and encouragements at all
stages of my work.
I owe my great debt of gratitude and heartfelt thanks to Prof. M. Nagarajan.,
M. Pharm.,M.B.A., DMS (IM)., DMS (BM)., chairman, K. M. College of Pharmacy, Madurai for
providing me all the facilities and support for the successful completion of my thesis work.
I express my deep sincere thanks to Dr. S. Venkataraman, M.Pharm., Ph.D.,
Principal, professor and H.O.D, Dept. of Pharmaceutical chemistry, for his timely instigation
and immeasurable esteemed help to complete this thesis.
I express my deep sense of gratitude and profound thankfulness to
Prof. M. S. Prakash., M. Pharm., Dept. of Pharmaceutical Analysis, K. M. College of Pharmacy, Madurai for his invaluable advice, suggestion and encouragement extended
throughout the work.
I extend my thanks to M. Shanthi., B.A, M.Li.Sc., Librarian and Mrs. M. Sasi kala.,
D.pharm.,Lab Assistant and Mrs. J. Sridevi., lab attender and all other non teaching staff members of our college for their co-operation.
I cannot forget to express my gratitude and grateful thanks to my classmates Selva ganesh, Ch.Narayana Swamy, Sindhuoor, Sudheer ,Sandhya, Sasi ruba, who helped me directly and indirectly for the successful completion of my project work.
I owe my thanks to my friends B. Jyothi, R. Leena, M. Kathiravn, Sivaraj, Firoz Shaik , Jarugu lakshmi Prasad andmy brother for their help during my work.
.
ABBREVATIONS
API - Active pharmaceutical ingredient
MeOH - Methanol
ACN - Acetonitrile
RT - Retention time
RH - Relative Humidity
CI - Confidence interval
NMT - Not more than
NLT - Not less than
NA - Not applicable
ND - Not detected
Fig - Figure
PDA - Photo diode array
PKa _ Acid dissociation constant
K - Partition coefficient
%RSD - %Relative standard deviation
RPM - Revolutions per minute
ODS - Octa decyl silane
K'
-Capacityfactor
N - Theoretical plate number/efficiency
LOD - Limit of detection
LOQ - Limit of quantitation
ICH - International Conference on Hormonization
Conc - Concentration
Std - Standard
ppb - Parts per billion
DS - Drug substance
DP - Drug product
µL - Micro liter
µg - Micro gram
λ - Lambda
µ - Micron
mL - Milli liter
mg - Milli gram
nm - Nanometer
Max - Maximum
S.no - Serial number
o
C - Degree celsius
pH - Hydrogen ion concentration
HPLC - High performance liquid chromatography
Introduction to analytical Chemistry
1. INTRODUCTION
Analytical chemistry is measurement science consisting of a set of powerful ideas
and methods that are useful in all fields of science and method. it is used to study the
chemical composition, structure and behavior of compounds. The purpose of chemical
analysis is together and interpret chemical information that will be the value of society in a
wide range of contexts. involves the application of a range of techniques and methodologies
to obtain and assess qualitative, quantitative and structural information on the nature of
components.[1,2]
Qualitative analysis is the identification of elements and compounds present in a sample.
Quantitative analysis is the determination of the absolute or relative amounts of elements or
compounds present in a sample.
Structural analysis is the determination of the special arrangement of atoms in an
element or molecule or the identification of characteristic groups or atoms.
A typical quantitative analysis[2] involves the sequence of steps shown in the
following flow diagram (figure-1)
Department of Pharmaceutical analysis, K.M college of pharmacy, Madurai.
Page
1
Select method
Acquire sample
Process sample
Change Chemical form
Is Sample soluble
Carry out chemical dissolution
Measurable property
Eliminate interferences
Measure property
Calculate result
Evaluating results by estimating their reliability
No No
Yes
Introduction to analytical Chemistry
High Performance Liquid Chromatography
[ 3,4,5,6,7]High performance liquid chromatography is the fastest growing analytical technique
for the analysis of the drugs. Its simplicity, high specificity and wide range of sensitivity
make it ideal for an analysis of many drugs in both dosage forms and biological fluids. HPLC
was developed in the late 1960s and 1970s. Today it is widely accepted separation technique
for both sample analysis and purification in variety of areas.
Guide to Liquid Chromatography Mode Selection
Selection of chromatography mode is based upon the analyte polarity, solubility and
ionic nature. [7]
A guide to liquid chromatography mode selection is represented in figure-2
Figure - 2 Guide to Liquid Chromatography Mode Selection Reverse Phase
HPLC
MW<2000
MW>2000
Department of Pharmaceutical analysis, K.M college of pharmacy, Madurai.
Page
2
Reverse phase, aqueous mobile phase
Non-ionic
High polarity Liquid, solid or bonded phase
Acidic Anion exchange/ion pair
ionic
Sample Basic
Cation exchange/ion pair
Water soluble
Size exclusion, aqueous mobile phase
Introduction to analytical Chemistry
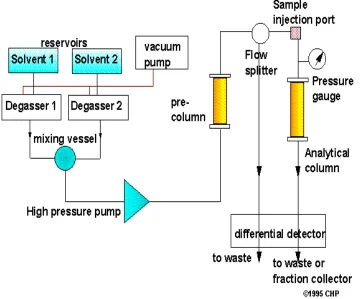
Figure - 3 Block diagram showing the components of an HPLC instrument
F
Introduction to analytical Chemistry
Reverse phase column packing
The liquid-liquid partition chromatography uses a stationary phase consisting of liquid
layer adsorbed to a surface of silica or alumina. In case of bonded phase or reverse phase
HPLC uses a stationary phase consisting of an organic moiety chemically bonded to the
surface of silica through the surface silanol groups. Since the organic moieties are generally
long-chain hydrocarbons, the mobile phases are generally polar. In this mode, the more polar
solutes are eluted first while the non-polar compounds are eluted later. The silanol group can
react with a chlorosilane group to form the popular (ODS & C18) octadecylsilane packing.
E.g. Octadecylsilane (ODS or C18).
CH
3CH
3Si OH + Cl – Si – (CH
2)
17– CH
3Si – O – Si – (CH
2)
17– CH
3+HCl
CH3
CH
3CH
3CH
3For silica based bonded materials, the suitable working pH range is 2 - 8. At pH values of
less than 2, the Si-C bond is attached and at the higher pH values, hydrolysis of the siloxane
Introduction to analytical Chemistry
takes place which leads to degradation or destruction of the packing. In most of the
applications of RP-HPLC, elution is carried out with highly polar solvents such as methanol,
acetonitrile or tetrahydrofuran in various concentrations. [8]
Reverse phase mobile phase
The primary constituent of RP-HPLC mobile phase is water. Water miscible solvents
such as methanol, ethanol, acetonitrile, dioxane, tetrahydrofuran and dimethyl formamide are
added to adjust the polarity of the mobile phase. Additionally acids, bases, buffers and/or
ionic surfactants are added. The water should be of high quality, either distilled or
demineralised water.
The most widely used organic modifiers are methanol, acetonitrile and
tetrahydrofuran. Methanol and acetonitrile have comparable polarities but acetonitrile is an
aprotic solvent. Ethanol, 1-propanol and 2-propanol are also useful but less polar than
methanol. Dioxane, tetrahydrofuran are aprotic solvents that are less polar than acetonitrile.
Reverse phase mobile phases are generally non-flammable due to high water content.
Degassing is quite important with reverse phase mobile phases.[8]
ANA
LYTICALMETHOD DEVELOPMENT
[1,9]Establishing an accurate assay procedure for each ingredient of complex dosage
formulation containing several therapeutically and chemically compatible drugs with very
similar chemical nature is a critical process. The presence of excipients, additives and
decomposition products further complicates the analysis. Therefore analytical development is
done for few drugs where no compendial method is available.
Method development is done for:
New drug products
Already existing products
Methods are developed for new products when no official methods are available and
for already existing products to reduce the cost and time for better precision and ruggedness.
STEPS OF METHOD DEVELOPMENT
1Introduction to analytical Chemistry
It starts with the documentation of the developed studies. All the data related to these
studies are established and recorded in laboratory notebook.
1. ANALYTICAL STANDARD CHARACTERIZATION
All the known information about the drug or analyte and its structure is collected such
as its physical and chemical properties, toxicity, purity, hygroscopic nature solubility and
stability.
a. The standard analyte is obtained. Necessary arrangement is made for proper storage in
refrigerator, desiccators and freezer.
b. When multiple components are to be analyzed in the sample matrix the number of
components are noted, data is assembled and the availability of standards for each
one is determined.
c. Special attention to be taken when sample is in less quality.
d.
Only the methods which are compatible with sample stability are considered.2. METHOD REQUIREMENTS
The objectives of method are defined. The required detection limits, linearity, range,
accuracy and precision are defined.
3. LITERATURE SEARCH AND RESEARCH METHODOLOGY
Carry out the literature survey for all types of information to the analyte. Literature is done
for synthesis, physico-chemical properties, solubility and relevant analytical methods. Books,
periodicals, chemical manufacturers and regulatory agency compendia such as USP/NF,
AOAC publications are reviewed along with chemical abstract service (CAS) automated
computerized literature searches.
a. If any reported methods from the literature are adaptable to the current laboratory
setting and future needs are determined.
b. Using information in the literature and prints, methodology is adapted. The methods
are modified wherever necessary; acquire additional existing methods for in house
analytes and samples.
c. If there are no prior methods for the analytes in the literature, the compounds that are
similar and chemical properties are investigated and are worked out.
4. INSTRUMENTAL SET UP AND INITIAL STUDIES
a. The required instrument is set up. Installation, operational and performance of
instrumentation using laboratory standard operating procedure are reviewed. b. Always new consumables (solvents, filter and gases) are used.
Introduction to analytical Chemistry
c. The analyte standard in a suitable injection/introduction solution and in known
concentration and solvents are prepared. It is important to start with an authentic,
known standard rather than with a complex sample matrix. If the sample is extremely
close to the standard (example: bulk drug) then it is possible to start work with the
actual sample.
d. Feasibility of method with regards to the analytical figures of merit obtained is
evaluated.
5. OPTIMIZATION
During optimization one parameter is changed at a time and set of conditions are
isolated rather than using a trial and error approach. Work has been done from an organized
methodological plan and every step is documented in case of dead ends.
6. DOCUMENTATION OF METHOD DEVELOPMENT WITH ACTUAL
SAMPLE
The sample solution should lead to absolute identification of the peak of interest apart from
all other matrix components.
7. EVALUATION OF METHOD DEVELOPMENT WITH ACTUAL
SAMPLE
The sample solution should lead to absolute identification of the peak of interest apart
from all other matrix components.
8. DETERMINATION OF PERCENT RECOVERY OF ACTUAL
SAMPLE AND DEMONSTRATION OF QUANTITATIVE SAMPLE
ANALYSIS.
Percentage recovery was determined by adding authentic standard analyte into a sample
matrix. Reproducibility of recovery from sample to sample and has been determined. It is not
necessary to obtain 100% recovery as long as the results are reproducible and known with
high degree of certainty.
ANALYTICAL METHOD VALIDATION
[10, 11, 12, 13, 35, 36]Validation is a key process for effective Quality Assurance "Validation is establishing
documented evidence which provides a high degree of assurance that a specific process or
equipment will consistently produce a product or result meeting its predetermined
specifications and quality attributes.
Introduction to analytical Chemistry
The validation guidelines recommended from ICH (International Conference on
Harmonization) consists characteristics for consideration during the validation of analytical
procedures included as part of registration applications within EC, Japan and USA.
Type of analytical procedures to be validated
Validation of analytical procedures is directed to the four most common types of analytical
procedures.
1. Identification test.
2. Quantitative test for impurities content. 3. Limit test for the control of impurities
4. Quantitative test of the active moiety in samples of drug substance on drug product on
other selected components in the drug product.
Assay procedures are intended to measure the analyte present in given sample, assay
represent a quantitative measurement of the major component(s) in the drug sample.
Objective of validation
[14, 15]The primary objective of validation is to form a basis for written procedure for
production and process control which are designed to assure that the drug products have the
identity, strength, quality, purity, safety and efficacy. Each step of the manufacturing process
must be controlled to maximize the probability that the finished products meet all quality and
design specification.
Benefits of Validation:
a. Produces quality products.
b. Helps in process improvement technology transfer, related product validation, failure
investigation, and increased employee awareness.
c. Cost reduction by increasing efficacy, few reject, longer equipment life, production of
cost effective products.
d. Helps in optimization of process or method.
e. Regulatory affairs department approved the products for export.
VALIDATION AS DEFINED BY DIFFERENT AGENCIES
1. USFDA:
Introduction to analytical Chemistry
According to this "Validation is the process of establishing documented evidence
which provides a high degree of assurance that a specific process will consistently produce a
product meeting its predetermined specifications and quality attributes.
2. WHO:
Defines Validation as an action of providing any procedure, process, equipment, material,
activity or system actually leads to the expected results.
3. EUROPEAN COMMITTEE:
Defines Validation as an action of providing in accordance with the principles of GMP that
any procedure, process, material, activity or system actually lead to expected results. This
process consists of establishment of the performance characteristics and the limitations of the
method.
Method performance parameters are determined using equipment that is:
1. Within specification. 2. Working correctly. 3. Adequately calibrated.
Method validation is required when:
1. A new method is developed. 2. Revision of established method.
3. When established methods are used in different laboratories and by different analysts. 4. Comparison of methods.
5. When quality control indicates method changes.
Typical analytical parameters used in assay validation include:
Precision
Accuracy
Linearity
Range
Ruggedness
Robustness
Limit of detection
Limit of quantitation
Selectivity
Specificity
Introduction to analytical Chemistry
PRECISION
A) Precision
The precision of an analytical procedure expresses the closeness of agreement between a
series of measurement obtained from multiple sampling of the same homogenous sample
under the prescribed conditions. Precision of an analytical procedure is usually expressed at
the variance, standard deviation or coefficient of variation of a series of measurements.
Validation of tests for assay and for quantitative determination of impurities includes
an investigation of precision.
Precisionisdeterminedbyusingthemethodtoassayasampleforasufficientnumberof times to
obtain statistically valid results (i.ebetween6-10).
Theprecisionisthen expressedastherelativestandarddeviation
STDdevx100% %RSD =
Mean
Repeatability
It express the precision under the same operating conditions over a short interval of
time. Repeatability is also termed as intra - assay precision. It should be assessed using a
minimum of nine determinations covering the specified range for the procedure (e.g. three
concentration/three replicates each) or a minimum of determinations at 100% of the test
concentration.
I
ntermediate precision
The extent to which intermediate precision should be established depends on the
circumstances under which the procedure is intended to be used. The applicant should
establish the effects of random events on the precision of the analytical procedure. Typical
variations to be studied include days, analysts, equipment, etc.
Reproducibility
Reproducibility is assessed by means of an inter-laboratory trial. Reproducibility should be
considered in case of the standardization of an analytical procedure, for instance inclusion of
procedures in Pharmacopoeias.
ACCURACY
Introduction to analytical Chemistry
"Accuracy is a measure of the closeness of test results obtained by a method to the true
value."
Accuracy indicates the deviation between the mean value found and the true value. It is
determined by applying the method to samples to which known amounts of analyte have been
added. These should be analyzed against standard and blank solutions to ensure that no
interference exists. The accuracy is then calculated from the test results as a percentage of the
analyte recovered by the assay. Accuracy and precision are not the same, as the diagram
below indicates. A method can have good precision and yet not be accurate.
Figure-4
Errors in measurement can be divided into two general categories: systematic errors
and random errors.
Systematic errors result from sources that can be traced to the methodology, the instrument
or the operator and affect both the accuracy and the precision of the measurement.
Random errors only affect the precision and are difficult to eliminate, because they
are the result of random fluctuations in the measured signal, due to noise and other factors.
Whilst systematic errors are proportional to the sum of individual contributions,
random errors are proportional to the root of the sum of the squares of the individual
contributions. Thus, the imprecision of the entire procedure is often dominated by the random
errors of the most imprecise step.
LINEARITY
Introduction to analytical Chemistry
This is the method's ability to obtain results which are either directly, or after mathematical
transformation proportional to the concentration of the analyte within a given range. Linearity
is determined by calculating the regression line using a mathematical treatment of the results
(i.e. least mean squares) vs. analyte concentration.
RANGE
The range of the method is the interval between the upper and lower levels of an analyte
that have been determined with acceptable precision, accuracy and linearity. It is determined
on either a linear or nonlinear response curve (i.e. where more than one range is involved, as
shown below) and is normally expressed in the same units as the test results.
Figure- 5
RUGGEDNESS
Ruggedness is the degree of reproducibility of results obtained by the analysis of the
same sample under a variety of normal test conditions i.e. different analysts, laboratories,
instruments, reagents, assay temperatures, small variations in mobile phase, different days
etc. (i.e. from laboratory to laboratory, from analyst to analyst.)
ROBUSTNESS
Robustness is depends on the type of procedure under study. It should show the
reliability of an analysis with respect to deliberate variations in method parameters. It is the
measure of capacity of an assay to remain by small but deliberate variations in method
parameters and provide an indication of its reliability in normal usage degradation and
variation in chromatography column, mobile phases and inadequate method development are
common causes of lack of robustness.
Introduction to analytical Chemistry
Examples of typical variations are
Stability of analytical solutions
Extraction time
Influence of variation of pH in a mobile phase
Influence of variation in mobile phase composition
Different columns
Temperatures
Flow rate
LIMIT OF DETECTION
This is the lowest concentration in a sample that can be detected, but not necessarily
quantitated, under the stated experimental conditions. The limit of detection is important for
impurity tests and the assays of dosages containing low drug levels and placebos.
The limit of detection is generally quoted as the concentration yielding a signal-to-noise
ratio of 2:1 and is confirmed by analyzing a number of samples near this value (6) using the
following equation. The signal-to-noise ratio (5) is determined by:
s = H/h
Where H = height of the peak corresponding to the component
h = absolute value of the largest noise fluctuation from the baseline of the
chromatogram of a blank solution.
Since the limit of detection is dependent on the signal-to-noise ratio, it can be
improved by enhancing the analyte signal and reducing the detector noise. The signal
(i.e. peak height) can be increased by selecting the optimum monitoring wavelength,
increasing the injection volume or mass (below signal or column saturation), increasing the
peak sharpness with high efficiency columns and by optimizing the mobile phase. For
absorbance detectors, longer path lengths in the flow cell enhance sensitivity though often to
the detriment of post column dispersion.
Noise can be reduced by using high sensitivity detectors with low noise and drift
characteristics, slower detector response time, mobile phases with low absorbance and pumps
with low pulsation.
LIMIT OF QUANTITATION
This is the lowest concentration of analyte in a sample that can be determined with
acceptable precision and accuracy.
Introduction to analytical Chemistry
It is quoted as the concentration yielding a signal-to-noise ratio of 1 0: 1 and is
confirmed by analyzing a number of samples near this value.
SELECTIVITY AND SPECIFICITY
Selectivity is the ability to measure accurately and specifically the analyte in the presence of
components that may be expected to be present in the sample matrix.
Specificity for an assay ensures that the signal measured comes from the substance of
interest and that there is no interference from excipients and/or degradation products and/or
impurities.
Determination of this can be carried out by assessing the peak identity and
purity.
Diode array detectors can facilitate the development and validation of HPLC assays. Spectral
data obtained from diode array detectors, effectively supplement the retention time data for
peak identification, also spectral manipulation often provides information about the peak
purity. The table below lists several of the techniques available for assessing peak identity
and purity.
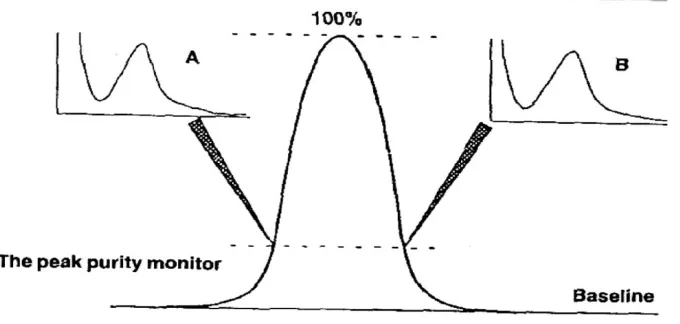
The purity index is a measure of the peak's relative purity, measured using a full comparison
of spectral data for the leading and training edge of the peak Figure 4. A value of 1.5 is
commonly accepted to indicate a pure peak but >1.5 would indicate the presence of an
[image:21.595.130.470.473.635.2]impurity, (9) as shown in Figure 6 & 7.
Figure- 6
Spectral comparison showing peak purity
Introduction to analytical Chemistry
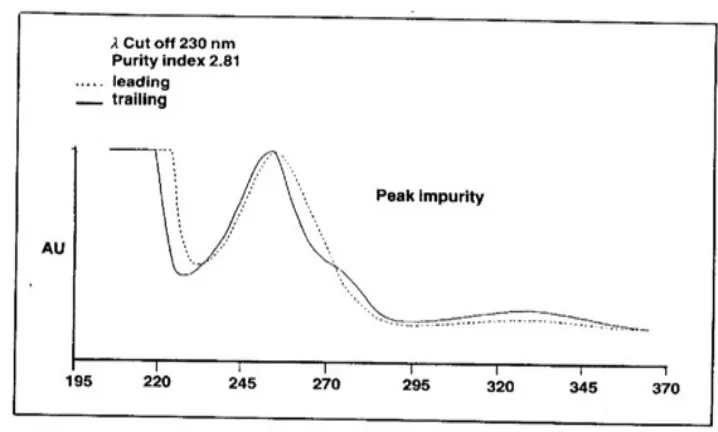
[image:22.595.116.475.68.284.2]Comparison of reference versus sample apex spectra for peak identity
Figure-7
SYSTEM SUITABILITY TESTS (SST)
Once a method or system has been validated the task becomes one of routinely
checking the suitability of the system to perform within the validated limits.
The simplest form of an HPLC system suitability test involves a comparison of the
chromatogram trace with a standard trace. This allows a comparison of the peak shape, peak
width, and baseline resolution.
Introduction to analytical Chemistry
Alternatively these parameters can be calculated experimentally to provide a
quantitative system suitability test report:
1. Number of theoretical plates (efficiency)
2. Capacity factor
3. Separation (relative retention)
4. Resolution
5. Tailing factor
6. Relative Standard Deviation (Precision)
These are measured on a peak or peaks of known retention time and peak width.
1. Plate number or number of theoretical plates (n)
This measures the sharpness of the peaks and therefore the efficiency of the column.
This can be calculated in various ways, for example the USP uses the peak width at the base
and the BP at half the Height.
An equation used to calculate ‘N’ is
N = 5.54[t/wh/2]2
Where
Wh/2 = peak width at 1/2 peak height Wb = peak width at base
[image:23.595.129.500.525.766.2]t = retention time of peak
Figure- 8
Introduction to analytical Chemistry
Therefore the higher the plate number the more efficient the column.
The plate number depends on column length - i.e. the longer the column the larger the plate
number. Therefore the column's efficiency can also be quoted as:
Either- as the plate height (h), or the height equivalent to one theoretical plate
(HETP).
h= L/n
Where L = length of column n
Or - as plates/meter.
2. Capacity factor (capacity ratio) k
This value gives an indication of how long each component is retained on the column
(i.e. how many times longer the component is retarded by the stationary phase than it spends
in the mobile phase).
Figure- 9
k' is used in preference to retention time because it is less sensitive to fluctuations in
chromatographic conditions (i.e. flow rate) and therefore ensures greater reproducibility from
run to run. In practice the k value for the first peak of interest should be >l to assure that it is
separated from the solvent.
3. Separation Factor (relative retention)
This describes the relative position of two adjacent peaks. Ideally, it is calculated using the
capacity factor because the peaks' separation depends on the components' interaction with the
stationary phase.
Introduction to analytical Chemistry
[image:25.595.72.545.480.830.2]Therefore considering peaks A and B
Figure- 10
k for the later peak is always placed in the numerator to assure a value >l.
If the capacity factor is used then the separation factor should be consistent for a
given column, mobile phase, composition and specified temperature, regardless of the
instrument used.
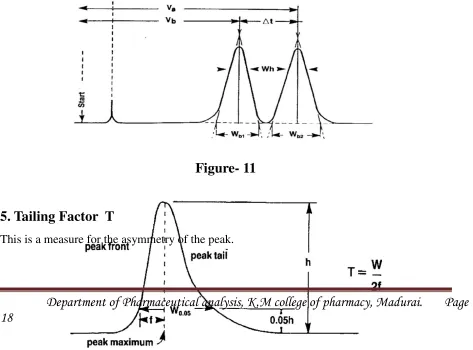
4. Peak Resolution R
This is not only a measure of the separation between two peaks, but also the efficiency of
the column. It is expressed as the ratio of the distance between the two peak maxima. (At) to
the mean value of the peak width at base (Wb).
Figure- 11
5. Tailing Factor T
This is a measure for the asymmetry of the peak.
Introduction to analytical Chemistry
Figure- 12
6. Relative Standard Deviation or precision
For an HPLC system this would involve the reproducibility of a number of replicate
injections (i.e. 6) of an analytical solution.
The USP requires that unless otherwise specified by a method:
if a relative standard deviation of <2% is required then five replicate injections should be
used. if a relative standard deviation of >2% is required then six replicate injections should be
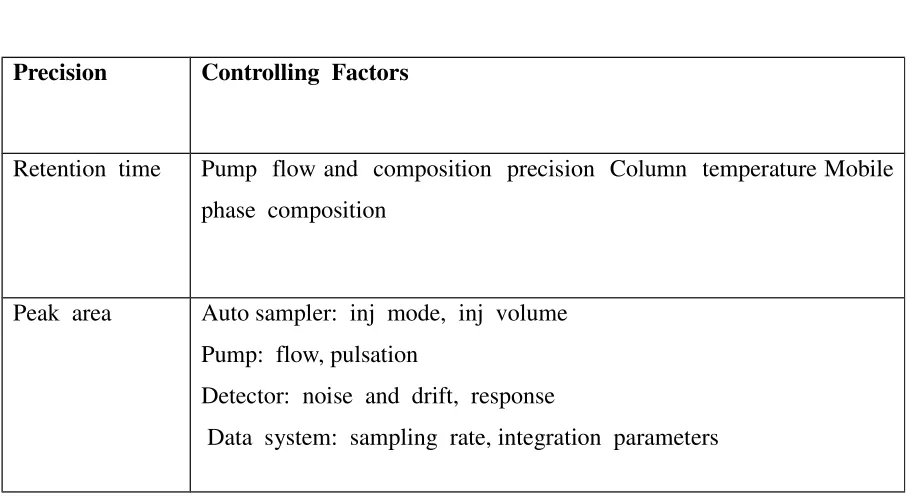
used Factors which could affect the precision of an HPLC system are shown in table 1.
Table No. 1
Precision Controlling Factors
Retention time Pump flow and composition precision Column temperature Mobile
phase composition
Peak area Auto sampler: inj mode, inj volume
Pump: flow, pulsation
Detector: noise and drift, response
Data system: sampling rate, integration parameters
In most cases the system's Relative Standard Deviation is required; deciding which of the
Introduction to analytical Chemistry
other tests are required is not straightforward. To assist with the decision it has been
suggested that those parameters which have an effect on the system precision should be used.
For instance the resolution of two peaks with similar retention times should be quoted,
because, if it is below a critical value, the precision will be affected.
In addition "diode array" detectors allow for the determination of the relative purity
factor typically called: Peak Purity.
The retention time precision is important, because not only is retention time the
primary method for peak identification, but also variations can indicate problems within the
LC system (i.e. with the piston seals, check valves etc). Use of a column oven can overcome
laboratory temperature variations, which is the most common cause of retention time drift.
The most dominant factor controlling the repeatability of peak area is the auto sampler’s
precision, though the effect of noise and integration parameters will become more significant
with small peaks
METHODS USED FOR THE EXAMINATION OF PHARMACEUTICAL
MATERIAL MAY BE BROADLY CLASSIFIED AS:
CLASS A:
Tests designed to establish identity, whether of bulk drug substances or of aparticular ingredient in a finished dosage form.
CLASS B:
Methods designed to detect and quantitate impurities in a bulk drug substanceor finished dosage form.
CLASS C:
Methods used to determine quantitatively the concentration of a bulk drugsubstance or of a major ingredient in a finished dosage form,
CLASS D:
Methods used to assess the characteristics of finished dosage forms such asdissolution profile and content uniformity.
Drug Profile
2. PROFILE
2.1 DRUG PROFILE
i. ACETAMINOPHEN
[16]Category : Analgesic and antipyretic.
Nomenclature
IUPAC NAME : N-(4-Hydroxyphenyl) acetamide.
synonyms : Paracetamol
Chemical Structure of Acetaminophen
Fig-12Structure of Acetaminophen
Molecular Formula : C8H9NO2
Molecular mass : 151.2 g/mol
Solubility : Sparingly soluble in water, freely soluble in alcohol,
very slightly soluble in ethylene chloride.
Melting point : 168 ℃ to 172 ℃
Drug Profile
ii. DEXTROMETHORPHAN HYDRO BROMIDE[17]
IUPAC name:Ent -3-Methoxy-17-methylmorphinan Hydrobromide monohydrate.
Chemical Structure of Dextromethorphan Hydro Bromide
Molecular Formula : C18H26BrNO, H2O
Molecular Weight : 370.3 g / mol
Appearance : Almost white, crystalline powder.
Solubility : Sparingly soluble in water, freely soluble in
alcohol.
Melting point : About 125 °C, with decomposition.
Action and use : Cough suppressant.
Drug Profile
iii.
PHENYLEPHRINE HCL
[16]Molecular Formula : C9H13NO2.HCL
Chemical Structure of Phenylephrine HCl
.HCL
Molecular Weight : 203.67 g / mol
IUPAC name : 1R)-1-(3-hydroxyphenyl)-2-(methylamino)
ethanol. Hydrochloride
Appearance : A white or almost white, crystalline powder
Solubility : Slightly soluble in water, sparingly soluble in
methanol, slightly soluble in alcohol. It
dissolves in dilute mineral acids and in dilute
solutions of alkali hydroxides.
Melting point : 174 °C.
Action and use : Sympathomimetic.
Drug Profile
2.2IMPURITIES DRUG PROFILE
i.
4 – AMINOPHENOL
[18]Molecular Formula : C6H7NO.
Chemical Structure of 4-Aminophenol
Molecular Weight : 109.13 g / mol
IUPAC name : 4-Amino 1- Hydroxy Benzen.
Appearance : Crystalline powder, gradually become darker.
Solubility : Very soluble in water, soluble in alcohols
Melting point : 186 °C.
Action and use : Photographic developer .
Drug Profile
ii.
4 – CHLOROACETANILIDE
[18]Molecular Formula : C8H8ClNO.
Chemical Structure of 4-chloroacetanilide
Molecular Weight : 169.60 g / mol
IUPAC name : N-(4-chloro phenyl) acetamide.
Appearance : Orthorombic crystals.
Solubility : Practicallysoluble in water, freely soluble in
alcohols, ether, carbon disulphide, slightly
soluble in carbon tetra chloride.
Melting point : 178 – 179°C.
Literature Review
3. LITERATURE REVIEW
D. B. Shepherd et al.,
[19] have developed stability indicating HPLC method for thedetermination of acetaminophen and its related substance.
Column : Restek Ultra II® Pentafluorophenyl column
(150mm X 4.6mm, 5um)
Mobile phase A : 10mM ammonium acetate buffer/methanol/acetonitrile (90:5:5)
Mobile phase B : Methanol and Acetonitrile (50:50)
Wavelength detection : UV detector at 272nm
Gradient program : 100% Mobile Phase A for 7 minutes
60% Mobile Phase B at 12minutes
The method was linear, accurate and precised for 4-aminophenol and other unknown
impurities between 0.25ug/mL to 5ug/mL(0.05% - 1.0% Acetaminophen).
Badea1*et al.,
[20]were developed and validated Reverse Phase High Performance
liquid Chromatography (RP-HPLC) method for the estimation of acetaminophen and it’
s
main impurities 4-nitrophenol, 4-chloroacetanilide as well as 4-aminophenol and it’
s
degradation products p-benzoquinone and hydroquinone.
Column : Hypersil Duet C18/SCX column
Mobile phase : Phosphate buffer (pH 5& 4.88) and methanol
Gradient program : Using gradient elution
The limits of detection and quantification was established to be lower than 0.1 mg/mL and
0.5 mg/mL, respectively. The method was successfully applied for the analysis of
Commercial acetaminophen preparations.
Literature Review
Eglal A. Abdelaleem
et al.,
[21]have developed and validated a simple, sensitive andstability indicating RP-HPLC method for the determination of related substance of
Paracetamol and methocarbamol (4-Aminophenol and guaifenesine) in their bulk powders
and laboratory prepared mixtures.
Column : ODS column
Mobile phase : 0.05 M KH2PO4 buffer : Acetonitrile
(72.5:27.5, v/v, pH = 6)
Flow rate : 1.0mL/min
Wavelength detection : U V detection at 225nm.
The developed method was validated as per ICH guidelines and the calibration plots
Were linear over the concentration ranges of 3–20, 4–25, 0.6–8 and 0.6–8 µg mL−1
For Paracetmol, Methocarbamol, 4-Aminophenol and Guafenesine, respectively.
Gnana Raj M et al.,
[22] have reported a validated stability indicating RP-HPLC methodfor the simultaneous estimation of related compounds of ibufrophen and paracetamol in the
tablet dosage form.
Column : RP 18 Embedded polar phase column
Mobile phase : Acetonitrile and 0.1 %of orthophosphoric acid (55:45)
Wavelength detection : U V detection at 230nm.
The developed method was validated as per USP and ICH guidelines.
Literature Review
T.A. Phazna Devi1 etal.,
[23]have developed High Performance LiquidChromatography (RP-HPLC) for the determination of paracetamol.
Column : C18 column [4.6x250mm, particle size 5µm].
Buffer : Ortho phosphoric acid buffer with pH of 3.5.
Mobile phase : Acetonitrile (ACN) and water (25:75 v/v).
Flow rate : 1mL/min
Wavelength detection : UV detector at 207nm
The statistical validation parameters such as linearity, accuracy, precision, interday and
intraday variation were checked. The limit of detection and limit of quantification of
paracetamol concentrations were found to be 120ng/mL and 360ng/mL. Recovery and
assay studies of paracetamol were within 99 to 102% and it was shown that the proposed
method could be adoptable for quality control analysis of paracetamol.
Sadana Gangishettyet al.,
[24]were described a simple, rapid and reproducible reverse
Phasehigh performance liquid chromatography (RP-HPLC) method for the simultaneous
estimation of clarithromycin (CLA) and paracetamol (PCM).
Column : C18 column (Kromasil ODS, 5µm, 250 × 4.6mm)
Mobile phase : Phosphate buffer (0.05M) along with 1-octane sulphonic
acid sodium salt monohydrate (0.005M) adjusted to
pH 3.2: acetonitrile (50:50).
Flow rate : 1mL/min
Wavelength detection : UV detector at 205nm
Literature Review
The developed method was validated according to ICH guidelines Q2 (R1) and found to be
linear within the range of 75–175µg/mL for both drug.
Arunadevi S. Birajdar* et al.,
[25] have developed high-performance liquidChromatographic method for the simultaneous estimation of paracetamol and tramadol in
combined solid dosage form.
Column : C18 reverse-phase column
(250 X 4.6 mm I.D., particle size 5µm).
Buffer : Triethylamine buffer (pH 7.3)
Mobile phase : Acetonitrile- 0.26 % Triethylamine buffer (pH 7.3) in ratio of
(45:55 % v/v)
Flow rate : 1mL/min
Wavelength detection : UV detector at 264nm
The method was linear over the concentration range of 1.0-12.0 µg/mL for paracetmol and
0.1-1.2 µg/mL for tramadol. Domperidone was used as an internal standard (IS).
The analytical recovery obtained was 99.88%. The validation of method carried out as per
ICH guidelines.
Swapnalee et al.,
[26]have developed simple, selective, rapid, précised and economicalRP-HPLC method for the determination of Acetaminophen Caffeine, Phenylephrine
Hydrochloride and Dextromethorphan Hydrobromide in the tablet formulation.
Column : Inertsil C8 (4.6 mm x 15 cm, 5 µm)
Buffer : Sodium salt of heptane sulphonic acid buffer solution
Mobile phase : Sodium salt of heptane sulphonic acid buffer solution and
Acetonitrile
Flow rate : 1mL/min
Wavelength detection : UV detector at 214nm
Literature Review
Fuad Al-Rimawi
[27]had developed simple, précised and accurate validated
HPLC method for the analysis of pseudophedrine hydrochloride, dextromethorphan
hydrobromide, chlorpheniramine maleate, and paracetamol in tablet formulations.
Column : Silica column (5 µm, 125 × 4.6 mm inner diameter)
Buffer : Ammonium dihydrogen phosphate buffer
Mobile phase : Methanol: Ammonium dihydrogen phosphate buffer
(90:10, v/v)
Flow rate : 1mL/min
Wavelength detection : UV detector at 220nm
This new method was validated in accordance with USP requirements for assay
accuracy, precision, selectivity, linearity and range, robustness and ruggedness.
I.M. Palabıyık et al.,
[28]have developed and validated HPLC method for the
simultaneous determination of phenylephrine hydrochloride, paracetamol,
chlorpheniramine maleate and dextromethorphan hydrobromide in pharmaceutical
preparations.
Column : C18 column
Mobile phase : Acetonitrile–Sodium perchlorate (0.01M, pH 3)
Flow rate : 1.4mL/min
Wavelength detection : UV detector at 204nm
Literature Review
Thummala V. et.al.,
[29] have developed sensitive, stability indicating gradient RP-HPLCmethod for the simultaneous estimation of impurities of Guaifenesin and Dextromethorphan
in pharmaceutical formulations.
Column : Sunfire C18, 250cm×4.6mm, 5µm column
Mobile phase : Gradient mixture of solvents A and B
Flow rate : 0.8mL/min
Wavelength detection : UV detector at 224nm
The developed method was validated according to ICH guidelines with respect to specificity,
Linearity, limits of detection and quantification, accuracy, precision and robustness.
Regression analysis showed an r2
value (correlation coefficient) greater than 0.999 for
Guaifenesin, Dextromethorphan and the impurities.
A. Marı
n et al.,
[30]have developed and validated a RP-HPLC method for the simultaneousestimation of acetaminophen, phenylephrine and chlorphenaramine in pharmaceutical dosage
form.
Mobile phase : Mobile phase A : Mobile phase B (92:8)
Mobile phase A : Phosphate buffer 40mM at pH 6.0
Mobile phase B : Acetonitrile
Wavelength detection : UV detector 215nm for phenylephrine and chlopheniramine
acetaminophen at 280nm
Gradient program : 75% Mobile Phase 25% Mobile phase B for 8 minutes
30% Mobile phase A 70% Mobile Phase B at 5minute
Literature Review
Rouhollah Heydari
ab*[31] was reported validated HPLC method for the simultaneousestimation of acetaminophen, phenylephrine, dextromethorphan and chlorpheniramine in
pharmaceutical formulation
Column : 25 cm underivatized silica column
Mobile phase : Methanol: water (containing 6.0 g of ammonium
acetate and 10 ml of triethylamine per liter, pH adjusted
to 5.0 with orthophosphoric acid), 95:5%(v/v)
Wavelength detection : UV-vis detector at 254 nm for acetaminophen
at 220 nm for phenylephrine, and at 227 nm for
dextromethorphan and chlorpheniramine.
The method showed linearity for the acetaminophen, phenylephrine, dextromethorphan, and
chlorpheniramine in the 162.5–650, 2.5–10, 7.5–30, and 1–4 µg/ml ranges, respectively.
The intraday and interday RSDs ranged from 0.92 to 1.52%, 1.00 to 1.76%, 1.21 to 1.74%
and 1.26 to 1.80% for the acetaminophen, phenylephrine, dextromethorphan, and
chlorpheniramine, respectively.
Marı
n
et al.,
[32]have developed HPLC method for the simultaneous determination of
acetaminophen, phenylephrine and chlorpheniramine in capsules as pharmaceutical
formulation after their dissolution test.
Column : HS PEG column (polyethylene glycol), 5 µm,
Mobile phase : 20 mM phosphate buffer at pH 7.0/acetonitrile 80:20 (v/v).
Flow rate : 1mL/min
Wavelength detection : UV detection at 210 nm for phenylephrine and
chlorpheniramine and at 305 nm for acetaminophen.
Literature Review
The validation parameters of both techniques were adequate for the intended purpose.
JOSHI et al.,
[33]have developed and validated isocratic RP-HPLC method for thesimultaneous estimation of dextromethorphan hydrobromide and levocetirizine
dihydrochloride in a cough syrup. The method was validated as per ICH guidelines.
Column : Phenomenex (USA) C18 analytical column, 250x4.0 mm
Mobile phase : potassium dihydrogen phosphate buffer (pH 2.5) – acetonitrile
and tetrahydrofuran (70:25:5, v/v/v).
Flow rate : 1.2mL/min
Wavelength detection : U V detection at 232nm
Brahmbhatt* et al.,
[34]have reported simple, accurate and precised RP-HPLC method
for Tramadolhydrochloride (THC) and Paracetamol (PCM).
Column : C18 ODS column (150 × 4.6 mm)
Mobile phase : Water : Methanol (70:30 v/v) at pH 3.4 adjusted by 5%
o-phosphoric acid
Flow rate : 1.0mL/min
Wavelength detection : U V detection at 228nm.
Linearity was observed over the concentration range of 195-455 µg/ml and 22.5-52.5 µg/ml
for PCM and THC respectively. The LOD was found to be 6.999 and 0.80 for PCM and THC
respectively. LOQ was found to be 2.10 for PCM and 2.42 for THC. Moreover, the % RSD
for repeatability, inter and intraday precision was found to be less than 2%, which reveals that
the method is precise. The % recovery was found to be 99.83%- 100.30%. For PCM and
98.52- 101.64% for THC.
Aim and Plan of work
4. AIM AND PLAN OF WORK
Aim and scope
Acetaminophen, Dextromethorphan HBr and Phenylephrine HCl are official in U.S.P. From
the literature survey, it was found that there were only few RP-HPLC methods reported for
the estimation of related substances of Acetaminophen in tablet formulation and no
analyt-ical method was reported for the estimation of related substances of acetaminophen in
cap-sule formulation.
Hence, the aim of present work is to develop RP-HPLC method for estimation of related
sub-stances of Acetaminophen in acetaminophen, phenylephrine Hcl and dextromethorphan HBr
soft gelatin capsules and to validate the developed RP-HPLC method by validation
paramet-ers as per ICH guidelines.
Plan of present work
Method development (By reverse phase HPLC).
Validation of the developed method (By using following parameters). a. System suitability studies
b. Limit of Detection c. Limit of Quantification d. Linearity and Range e. Accuracy
f. Precision g. Specificity h. Robustness i. Ruggedness
Materials and Instruments Used
5. MATERIALS AND INSTRUMENT USED
a) Active Ingredients used:
S.No.
Name
Specification
1. Acetaminophen As Referance standard
2. 4-Aminophenol As Referance standard
3. 4-Chloroacetanilide As Referance standard
4. Dextromethorphan HBr As Referance standard
5. Phenylephrine Hcl As Referance standard
b) Apparatus / Instruments used:
S.No
.
NAME
MODEL
MANFACTURER/SUPPLIER
1. Weighing balance AUM220D Schimadzu
2. Sonicator sonorex Sonorex dg 10p
3. pH Meter 9087 ELICO pH METER
4. HPLC-UV,PDA LC-2010 Schimadzu
5. Colum Zodiac C18 Zodiac
C) Chemical used:
Materials and Instruments Used
Department of Pharmaceutical analysis, K.M college of pharmacy, Madurai.
Page
S.No
.
NAME
GRADE
MANFACTURER/SUPPLIER
1.
Pottasium di hydrogen
orthophosphate HPLC Rankem Chemicals
2.
1-pentane sulponic acid
sodium salt HPLC Rankem Chemicals
3. Acetonitrile HPLC Afladam Chemicals
4. Methonol HPLC Rankem Chemicals
5. Phosphoric acid HPLC Merck Chemicals
6. Tri Ethylamine HPLC Rankem Chemicals
Method Development
6. RP-HPLC METHOD DEVELOPMENT
The method development stage, decision regarding choice of column, mobile phase,
detectors and method of quantitation must be addressed. In this way, development considers all
the parameters pertaining to any methods [15]
.
(1)Selection of stationary phase
Proper selection of the stationary phase depends up on the nature of the sample and
chemical profile. The drug selected for the present study was polar compound and could be
separated either by normal phase chromatography or reverse phase chromatography. From
literature survey, it was found that different C18columns could be appropriately used for the
separation of related substances for Acetaminophen.
(2)Selection of wavelength
The sensitivity of the HPLC method depends upon the selection of detection wavelength.
An ideal wavelength is one that gives good response for related substances and the drugs to be
detected. The wavelength for measurement was selected as 245 nm from the absorption
spectrum.
(3)Selection of mobile phase
The mobile phase was selected and chromatograms were recorded, trails were done on
different mobile phases.
TRIALS
Trial-1
Buffer preparation:
6.8 g of Potassium dihydrogen orthophosphate was dissolved in 1000 mL of milli-Q
water and pH was adjusted to 3.0 with orthophosphoric acid. Then it was filtered through 0.45 µ
nylon membrane filter and degassed.
Mobile phase A: Buffer (70%)
Mobile phase B: Methanol(30%)
Method Development
Chromatographic conditions
Column : Zodiac C-18, (250 × 4.6 mm, 5 µ)
Detector wavelength : 245 nm
Column temperature : 30 o
C
Injection Volume : 10 µ L
Flow rate : 1.0 mL/min
Runtime : 55 min
Observation:
Resolution of peaks were not satisfactory for 4-Aminophenol, Phenylephrine HCl and
Acetaminophen and Dextromethorphan HBr.
Figure-13
Trial 2:
Buffer Preparation:
2.0 g of Sodium di hydrogen orthophosphate was dissolved in 1000 mL of milli-Q water
and pH was adjusted to 3.0 with orthophosphoric acid. Then it was filtered through 0.45 µ nylon
membrane filter and degassed.
Mobile phase A: Buffer (70%)
Mobile phase B: Acetonitrile(30%)
Method Development
Chromatographic Condition:
Column & ID NO : Zodiac C-18, (250 × 4.6 mm, 5 µ)
Column temperature : 30o
C
Inj. Volume : 10 µ L
Flow rate : 1.0ml/min
λmax : 245 nm
Figure-14
Observation:
Resolution of peaks were not satisfactory for 4-Aminophenol, Phenylephrine HCl and
Acetaminophen and Dextromethorphan HBr
Trial 3: (Optimized Method)
Buffer preparation – 1
1.92g of 1-Pentane sulphonic acid sodium salt was dissolved in 1000ml distilled water followed
by the addition of 0.1ml Triethylamine and pH was adjusted to 6.0 with Orthophosphoric acid.
Buffer preparation - 2:
6.8g of potassium Dihydrogen ortho phosphate was dissolvedin1000ml distilled water and pH
was adjusted to 3.0 with orthophosphoric acid.
Method Development
Mobile phase A: Buffer-1: Methanol (85:15)
Mobile phase B: Buffer-2: Acetonitrile (70:30)
Chromatographic conditions
Column : Zodiac C-18, (250 × 4.6 mm, 5 µ)
Detector wavelength : 245 nm
Column temperature : 30 o
C
Injection Volume : 20 µ L
Flow rate : 1.0 mL/min
Runtime : 55 min
Diluent : Mobile phase-A
Gradient Program:
Table No: 2
Time (mins) Mobile phase-A (%) Mobile phase-B (%)
0.01 100 0
15.0 100 0
30.0 0 100
45.0 0 100
50.0 100 0
55.0 100 0
Figure-15
Method Development
Observation:
Resolution was satisfactory for 4-Aminophenol, Phenylephrine HCl and Acetaminophen
and Dextromethorphan HBr.
Sample preparation
Preparation of sample solution:
8000mg of medicament was accurately weighed (equivalent to 2000mg of Acetaminophen) and
transfered into a 100 ml volumetric flask.70mL of diluent was added and sonicated for
30minutes. Finally volume was made up with diluents and Filtered the solution through whatman
filter no:42.
Preparation of Diluted Standard Solutions:
Acetaminophen:
50mg of Acetaminophen working standard was accurately weighed and transfered into a 50 ml
Volumetric flask.30ml of diluent was added and sonicated and volume was made up with diluent.
5mlof stock solution was pipetted out into a 50 ml volumetric flask and finally volume was
made up with diluent (Solution 1).
4-Chloroacetanilide:
Method Development
20mg of 4-Chloroacetanilide working standard was accurately weighed and transferred in to a
50 ml Volumetric flask. 30ml of diluent was added and sonicated. Then volume was made up
with diluent.5ml of stock solution was pipetted out into a 50 ml volumetric flask and volume
was made up with diluent. 5ml of resulting solution was pipetted out into a 100ml of
volumetric flask and finally volume was made up with diluent (Solution 2).
4-aminophenol:
50mg of 4-Aminophenol working standard was accurately weighed and transfered into a 50 ml
Volumetric flask .30ml of diluent was added and sonicated . Then volume was made up with
diluent.10ml of stock solution was pipetted out into a 50 ml volumetric flask and finally
volume was made up with diluent (Solution 3).
Resolution solution: (Diluted standard)
20mg of Phenylephrine HCl WS/RS and 10mg of Dextromethorphan HBr WS/RS were
accurately weighed and transfered into a 50ml volumetric flask. 10ml of Solution 1, 5ml of
Solution 2 and 5ml of Solution 3, were added into a 50ml volumetric flask and finally volume
was made up with diluent.
Method Validation for Related Substances
7. METHOD VALIDATION
VALIDATION
According to ICH guidelines method validation can be defined as “Establishing
documented evidence, which provides a high degree of assurance that a specific activity will
consistently produce a desired result or product meeting its predetermined specifications and
quality characteristics” [18]
. Such validated analytical method for qualitative and quantitative
testing of the drug molecule assume greater importance when they are employed to generate
quality and safety compliance data during development, pre-formulation studies and post
approval of drug products.
The ICH of Technical Requirements for the Registration of Pharmaceutical for human
use has developed a consensus text on the validation of analytical procedures. The document
includes definitions for eight validation characteristics
Parameters Used for Assay Validation
The validation of the assay procedure was carried out using the following parameters.
1) Parameters:
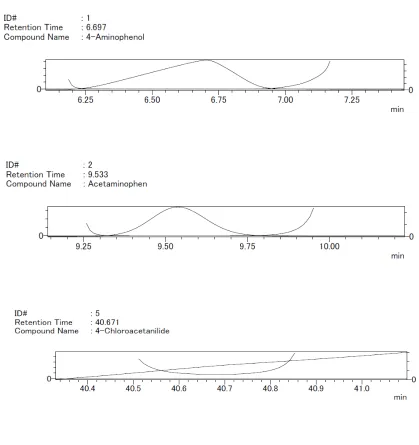
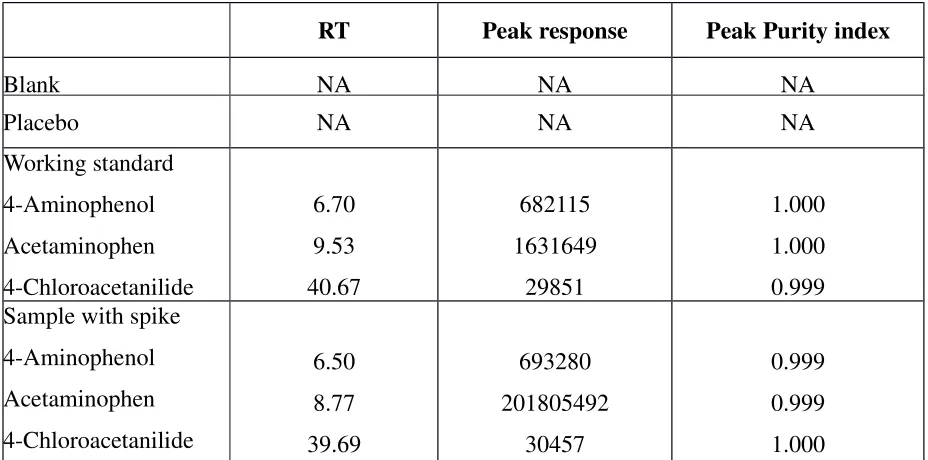
1.1 System suitability
1.2 Specificity
1.3Limit of Detection
1.4Limit of Quantification
1.5Linearity and Range
1.6Accuracy
1.7Precision
1.8Robustness
Reagents:
Buffer preparation – 1
1.92g of 1-Pentane sulphonic acid sodium salt was dissolved in 1000ml distilled Water
followed by the addition of 0.1ml Triethylamine and pH was adjusted to 6.0 with
Orthophosphoric acid.
Buffer preparation - 2:
Method Validation for Related Substances
6.8g of potassium Dihydrogen orthophosphate was dissolved in1000ml distilled water and
pH was adjusted to 3.0 with orthophosphoric acid.
Mobile Phase:
Mobile Phase – A:
850ml of Buffer-1 and 150ml of Methanol were mixed. Then solution was filtered through
0.45µm nylon membrane filter and it was degassed.
Mobile Phase – B:
700ml of Buffer-2 and 300ml of Acetonitrile were mixed. Then solution was filtered
through 0.45µm nylon membrane filter and it was degassed.
Diluent:
Mobile phase – AGradient Program:
Table No:2
Time (mins) Mobile phase-A (%) Mobile phase-B (%)
0.01 100 0
15.0 100 0
30.0 0 100
45.0 0 100
50.0 100 0
55.0 100 0
7.1
PREPARATION OF STANDARD AND SAMPLE SOLUTION:
STANDARD PREPARATION:
Acetaminophen:
Method Validation for Related Substances
50mg of Acetaminophen working standard was accurately weighed and transfered into a
50 ml Volumetric flask, 30ml of diluent was added and sonicated. Then volume was made
up with diluent. 5ml of stock solution was pipetted out into a 50 ml volumetric flask and
finally volume was made up with diluent (Solution 1).
4-Chloroacetanilide:
20mg of 4-Chloroacetanilide working standard was accurately weighed and transferred in
to a 50 ml Volumetric flask. 30ml of diluent was added and sonicated. Then volume was
made up with diluent. 5ml of stock solution was pipetted out into a 50 ml volumetric flask
and volume was made up with diluent. 5ml of resulting solution was pipetted out into a
100ml of volumetric flask and finally volume was made up with diluent (Solution 2).
4-aminophenol:
50mg of 4-Aminophenol working standard was accurately weighed and transfered in to a
50 ml Volumetric flask. 30ml of diluent was added and sonicated. Then volume was made
up with diluent. 10ml of stock solution was pipetted out into a 50 ml volumetric flask and
finally volume was made up with diluent (Solution 3).
Resolution solution: (Diluted standard)
20mg of Phenylephrine HCl WS/RS and 10mg of Dextromethorphan HBr WS/RS were
accurately weighed and transfered into a 50ml volumetric flask. 10ml of Solution 1, 5ml of
Solution 2, and 5ml of Solution 3 were added into a 50ml volumetric flask and finally
volume was made up with diluent.
Sample Preparation:
8000mg of medicament was accurately weighed (equivalent to 2000mg of Acetaminophen)
and transfered into a 100 ml volumetric flask . 70mL of diluent was added and sonicated
for 30minutes. Finally volume was made up with diluent and Filtered the solution
through whatman filter no: 42.
Spiked Sample Preparation:
8000mg of medicament was accurately weighed (equivalent to 2000mg of Acetaminophen)
and transfered into a 100 ml volumetric flask. 10ml of Solution-2, 10ml of Solution-3 and
Method Validation for Related Substances
70mL of diluent were added and sonicated for 30minutes. Finally volume was made up with
diluent and Filtered the solution through whatman filter no: 42.
7.2
CHROMATOGRAPHIC PARAMETERS:
The liquid chromatographic system was set as follows:
Table No: 3
Instrument HPLC with UV/PDA detector
Column C18 – 250 mm x 4.6 mm, 5m (zodiac or
equivalent)
Flow rate 1.0 ml/min.
Oven temperature 30.0°C
Sample temperature Ambient
Diluent Mobile phase
Wavelength 245 nm
Injection volume 20 µl
Calculation:
Calculation of impurities:
(1) 4- Aminophenol
=AKIT1 x WS1 x 10 x 5 x 100 x P1 x Avg.net weight in mg x 100
ADS1 50 50 50 WT 100 LCA
(2)
4- Chloroacetanilide =
AKIT2 x WS2 x 5 x 5 x 5 x 100 x P2 x Avg.net weight in mg x 100
ADS2 50 50 100 50 WT 100 LCA
(3)
Total Unknown impurities =
ATIT1 x WS3 x 5 x 10 x 100 x P3 x Avg.net weight in mg x 100
ADS 50 50 50 WT 100 LCA
AKIT1 = Area of 4-Aminophenol impurity obtained from test preparation. AKIT2 = Area of 4-Chloroacetanilide impurity obtained from test preparation.
ATIT1 = Sum of all peak area in test solution – [Test solution Known impurity peak area + Acetaminophen peak area]
ADS = Area of Acetaminophen peak obtained from Resolution solution. ADS1 = Area of 4- Aminophenol peak obtained from Resolution solution.
Method Validation for Related Substances
ADS2 = Area of 4- Chloroacetanilide peak obtained from Resolution solution. WS1 = Weight of 4- Aminophenol working standard taken in mg.
WS2 = Weight of 4-Chloroacetanilide working standard taken in mg. WS3 = Weight of Acetaminophen working standard taken in mg. WT = Weight of test sample taken in mg for test preparation.
P1 = Purity of 4- Aminophenol working standard as such basis in %.
P2 = Purity of 4-Chloroacetanilide working standard as such basis in %. P3 = Purity of Acetaminophen working standard as such basis in %. LCA = Label claim of Acetaminophen.
Acceptance Criteria:
1. 4-Chloroacetanilide: NMT 0.001
2. 4-aminophenol: NMT 0.1%
3. Total Unknown impurities: NMT 0.1%
SYSTEM SUITABILITY
System suitability parameters and recommendations were shown in the table no.4
Table no. 4 System suitability parameters and recommendations
S.N
o Parameters Recommendations
1 Theoretical plates
(N) >2000
2 Tailing factor (T) ≤ 2
3 Resolution (Rs) > 2 between peak of interest and the closest eluting potential interference
4 Repeatability RSD ≤ 2% for N ≥5 is desirable
5 Capacity factor (k1
) > 2.0
6 Relative retention Not essential as long as the resolution is stated
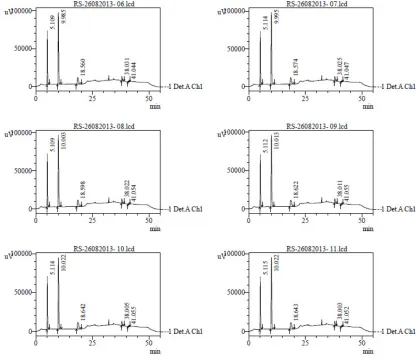
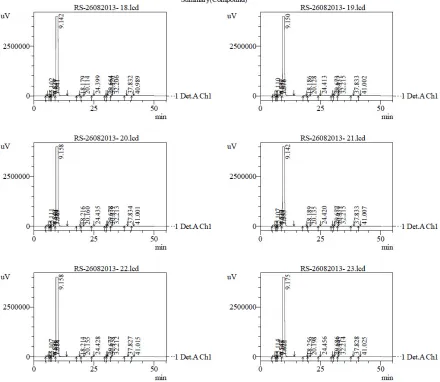
Procedure:
A standard solution (resolution solution) was injected .Six times into HPLC system and
system suitability parameters were evaluated. Chromatograms were shown in the
figure-16 and data was shown in the table no.5, 6and 7.
Method Validation for Related Substances
Figure -16 Chromatogram for system suitability