ISSN 1017-6004
eurostat
%
EXTERNAL TRADE
Monthly statistics
10 D 1991
Part 1: Commentaries
Part 2: External trade
Part 3: Balance of payments
Luxembourg: Office for Official Publications of the European Communities, 1991
Catalogue number: CA-AR-91-010-EN-C
© ECSC-EEC-EAEC, Brussels · Luxembourg, 1991'
NOTE
This edition combines external trade and balance of payments statistics for the Community
the aim being to provide the reader with all statistical information relating to the Community's
external transactions.
Owing to different periodicities of data collection (monthly for external trade, quarterly for
balance of payments), figures for the balance of payments will appear four times a year in this
publication.
The statistical tables will be preceeded by a concise analysis which will comment upon the
main economic trends. To this end, certain Community aggregates will be estimated if the
necessary data is available for most member states.
Commentary: External Trade
Seasonal Adjustment: Results
After their downward trend from mid-1990 onwards,
seasonally adjusted European Community exports
to the rest of the world (extra-EC) now stabilise
around their mid-1989 level. In May 1991,
seasonally adjusted extra-EC exports decreased by
0,5% compared to April 1991.
After stabilising at a high level in 1989 and the first
half of 1990, seasonally adjusted Community
imports from the rest of the world (extra-EC) moved
further upwards during the second half of 1990. For
the first months of 1991, they show marked
fluctuations around this higher level. In May 1991,
seasonally adjusted extra-EC imports were up by
0,4% compared to April 1991.
After an improvement at the beginning of this year,
the European Community's seasonally adjusted
trade deficit seems to deteriorate again. In May
1991, the seasonally adjusted Community trade
deficit stood at a record level of-7,05 mrd. ECU.
After the upward trend registered since 1988, trade
between EC Member States seems to have
stabilised at the beginning of 1991. Seasonally
adjusted trade between European Community
Member States increased by 0,9% in Mai 1991
compared to April 1991.
EUR 12 Exports Extra-EC
EUR 12 Imports Extra-EC
Mrd. ECU1984 1Θ65 1986 1Θ87 1 1989 1990 1991
1984 1985 Unadjusted — Seasonally Adjusted
- Unadjusted Seasonally Adjusted
EUR 12 Imports Intra-EC
Mrd. ECU
EUR 12 Trade Balance Extra-EC
1984 1985 1986 1987 1988 1989 1990 1991
— Unadjusted — Seasonally Adjusted 1984 1985 1986 1987 1988 1989 1990 1991
TABEL O - EUR 12 EXPORTS, IMPORTS, TRADE BALANCE (1)
Seasonally Adjusted Serles(2) - Mrd. ECU
Period
Jan-88
Feb-88
Mar-88
Apr-88
May-88
Jun-88
Jul-88
Exports Extra-EC
Not Adjusted
22,7
27,1
31,5
27,8
29,7
31,9
30,8
Seasonally
Adjusted
25,8
28,3
28,6
29,4
30,2
30,6
30,4
Imports
Not Adjusted
25,9
29,5
34,4
30,2
31,9
33,0
31,9
Extra-EC
Seasonally
Adjusted
26,6
30,0
31,3
30,5
31,9
32,2
33,4
Imports Intra-EC
Not Adjusted
35,2
42,9
49,2
42,4
45,6
47,3
43,2
Seasonally
Adjusted
38,1
42,1
42,8
43,0
45,0
45,2
44,8
Trade Balance Extra-EC
Not Adjusted
-3,2
-2,4
-2,9
-2,4
-2,2
-1,1
-1,2
Seasonally
Adjusted
-0,7
-1,8
-2,7
-1,1
-1,7
-1,7
-3,0
Sep-88
Oct-88
Nov-88
Dec-88
Jan-89
Feb-89
Mar-89
Apr-89
May-89
Jun-89
Jul-89
Aug-89
Sep-89
Oct-89
Nov-89
Dec-89
Jan-90
Feb-90
Mar-90
Apr-90
May-90
Jun-90
Jul-90
Aug-90
Sep-90
Oct-90
Nov-90
Dec-90
Jan-91
Feb-91
Mar-91
Apr-91
May-91
22,7
27,1
31,5
27,8
29,7
31,9
30,8
28,5
31,1
32,6
33,1
35,8
30,3
30,9
34,8
33,7
33,4
37,4
34,0
31,3
34,4
37,6
37,1
37,4
34,1
33,6
37,7
33,3
35,6
35,1
35,5
31,4
31,2
38,8
36,9
35,4
32,6
31,7
34,4
34,5
34,4
25,8
28,3
28,6
29,4
30,2
30,6
30,4
31,4
31,6
31,5
31,1
32,9
33,4
33,1
34,2
33,6
33,5
36,0
34,3
34,1
36,3
34,6
35,0
34,9
36,9
36,0
35,6
35,0
35,2
35,0
34,5
34,5
33,3
35,2
35,0
33,7
34,5
33,9
34,0
34,4
34,2
25,9
29,5
34,4
30,2
31,9
33,0
31,9
31,1
34,2
35,4
34,7
34,1
35,4
34,3
38,0
37,6
39,1
40,1
35,3
34,4
37,7
40,6
39,1
34,8
39,6
35,6
40,2
37,1
39,4
37,8
36,8
35,2
36,6
43,9
41,9
36,0
43,0
37,3
39,2
43,3
42,3
26,6
30,0
31,3
30,5
31,9
32,2
33,4
33,9
33,8
34,2
33,1
35,5
35,2
36,0
36,9
37,0
38,4
38,9
37,6
36,9
38,2
37,6
37,9
37,0
38,5
37,6
38,2
37,7
38,0
37,6
37,3
38,3
37,9
40,2
40,3
38,9
41,1
39,5
38,9
41,1
41,2
35,2
42,9
49,2
42,4
45,6
47,3
43,2
37,5
46,3
50,1
49,3
48,9
47,7
49,1
54,1
52,0
52,5
57,3
50,4
42,5
50,8
58,1
56,4
51,5
53,9
52,3
60,6
54,4
56,6
54,7
54,8
44,5
53,3
62,3
61,1
52,6
59,3
56,0
59,6
60,0
59,1
38,1
42,1
42,8
43,0
45,0
45,2
44,8
46,9
46,1
47,4
47,4
49,2
49,3
49,9
50,5
50,5
51,7
54,1
52,5
52,0
53,0
52,8
53,8
53,6
55,4
53,3
54,5
54,5
54,5
54,0
54,8
55,4
56,0
56,8
56,3
53,2
59,2
57,2
56,8
57,2
57,7
-3,2
-2,4
-2,9
-2,4
-2,2
-1,1
-1,2
-2,6
-3,1
-2,7
-1,7
1,6
-5,1
-3,4
-3,2
-3,9
-5,7
-2,7
-1,3
-3,0
-3,3
-3,0
-2,0
2,5
-5,5
-2,0
-2,5
-3,7
-3,8
-2,7
-1,3
-3,8
-5,3
-5,2
-5,0
-0,6
-10,5
-5,7
-4,9
-8,8
-7,9
-0,7
-1,8
-2,7
-1,1
-1,7
-1,7
-3,0
-2,4
-2,2
-2,7
-2,1
-2,6
-1,8
-2,9
-2,7
-3,3
-4,9
-2,9
^3,2
-2,8
-1,9
-3,0
-2,9
-2,1
-1,6
-1,6
-2,6
-2,7
-2,8
-2,6
-2,8
-3,8
-4,6
-5,0
-5,3
-5,1
-6,6
-5,7
-5,0
-6,7
-7,0
(1 ) As from October 1990, the territory of the Federal Republic of Germany includes the territory of the former German Democratic Republic, including East Berlin.
Community results are drawn up accordingly.
(2) Seasonal Adjustment via X11/ARIMA procedure
GLOBAL TRENDS: Results for June 1991. The cumulative deficit for the first half of 1991
amounted to 43.5 billion ecus, equivalent to the total deficit for 1990.
In June 1991, the Community deficit was 5.8 billion
ecus, a deterioration of 2.7 billion compared with the
June 1990 figure. The gap between the growth rates
for imports and exports was 7.3 points, an improve
ment on the beginning of the year : the average diffe
rence during the first half of 1991 was more than 10
points.
The energy bill weighs heavily on the balance of
Community trade: from $17.4 a barrel over the first six
months of 1990, the cost of the Community's supplies
of crude oil rose to $19.43 in the first half of 1991, an
increase of 11.7% in dollar terms. The dollarecu
exchange rate brings this figure down to 8%.
In the first half of 1991, Community exports suffered
from the slowdown in world trade and from the fact that
German products were directed increasingly to the
domestic market. They fell by 3.7% compared with the
first half of 1990. This drop was particularly marked in
the first quarter of the year, when the hostilities in the
Gulf caused a downturn in activity, whereas the situa
tion stagnated in the second quarter.
Community imports rose in the first half of 1991 (+6.5%
on the same period in 1990), owing to demand from
unified Germany and the increase in energy prices.
There was a slight downturn in the first quarter, when
imports showed an increase of only 3% compared with
the first quarter of 1990, but they picked up again in
the second quarter (+10%). This pattern should be
seen in relation to changes in the cost of the Commu
nity's supplies of crude oil, expressed in ecus. In the
first quarter of 1991, this was 3% higher than in the first
quarter of 1990. In the second quarter of 1991, it fell
compared with the start of the year, but was higher
than the very low level in the second quarter of 1990.
In ecu terms the increase, which was compounded by
the rise in the value of the dollar, was 20% compared
with the second quarter of 1990.
At mid1991 the United States had a cumulative deficit
of 26.7 billion ecus, an improvement of 16 billion on
the first half of 1990. Imports fell by 6.1% in ecus
between these two periods, but by only 2% in dollars.
Exports went up by 2.2% in ecus between the first half
of 1990 and the first half of 1991, corresponding to a
rise of 6% in dollars.
In the first half of 1991, Japan had a cumulative surplus
of 28.8 billion ecus, an increase of 5 billion on the first
half of 1990. Between these two periods, Japanese
imports rose by 4.7% in ecus, which means that they
stagnated in dollar terms and fell by 3% in yen. Ex
ports remained buoyant in ecus (+8.1%) and dollars
(+12%), but rose only slightly in yen (+1%).
GR.
IMPORTS AND EXPORTS (CIF.FOB)
annual % change in value
20
1
1
S
a-I
i$
1
:
;;
:
:
:
:
i
90
91
90
91
90
90 91
0106
06
0106
EUR12
USA
90
91
06
90
91
90 91
0106
06
JAPAN
TABLE I - TRADE BALANCE, IMPORTS AND EXPORTS (1)
COUNTRIES
EUR-12 (2)
United States
Japan
BLEU
Denmark
Germany
Greece
Spain
France
Ireland
Italy
Netherlands
Portugal
United Kingdom
EUR-12 (2)
United States
Japan
BLEU
Denmark
Germany
Greece
Spain
France
Ireland
Italy
Netherlands
Portugal
United Kingdom
EUR-12 (2)
United States
Japan
BLEU
Denmark
Germany
Greece
Spain
France
Ireland
Italy
Nelherlands
Portugal
United Kingdom
Memorandum item
1USD
=
...ECU
1 YEN
=
...ECU
1989
-33,7
-116,1
58,4
-2,2
1,2
64,0
-7,8
-19,3
-14,9
3,1
-11,2
3,5
-5,6
-41,1
15,2
14,6
20,6
15,2
10,5
15,4
40,0
27,3
16,6
19,8
18,7
14,2
13,4
7,8
13,8
21,3
11,3
16,7
11,3
13,1
48,6
16,0
16,2
18,6
17,6
16,7
23,5
11,7
7,3
-0,3
1990
-42,9
-95,2
"
41,2
-5,6
2,4
47,4
-9,2
-20,1
-17,3
2,3
-9,3
0,3
-6,7
-31,9
1991
I
1991
II
1990
01-06
1991
01-06
TRADE BALANCE (Mrd ECU)
-20,9
-13,2
12,9
-1,5
0,5
3,0
-2,5
-4,7
-5,0
0,4
-4,2
-0,2
-1,8
-6,8
%
change on the
3,6
-9,3 "
-3,9
6,0
2,9
10,3
6,0
7,7
4,9
3,8
2,9
5,3
14,0
-1,6
3,0
-13,7 "
1,4
2,6
-0,4
19,8
-2,1
5,4
0,8
3,6
-1,4
2,0
8,1
-6,3
% change on the
1,6
-6,2 "
-9,8
2,3
7,3
2,8
-7,8
9,3
3,9
-0,6
4,7
2,0
11,7
4,6
-6,6
-6,1 "
1,2
1,6
-1,2
-2,4
-12,6
14,7
-0,7
-3,6
4,2
-1,6
0,9
0,3
% change on the
-13,5
-17,3
-10,1
-0,4
-22,5 '
-13,5 "
15,9
-1,6
0,6
-1,0
-2,3
-5,7
-3,2
-3,4
-1,3
-2,2
-5,7
-20,7
-42,9
23,8
-2,9
1,2
31,2
-5,2
-11,2
-8,0
1,5
-7,5
0,8
-3,2
-19,1
IMPORTS
-43,5
-26,7
28,8
-3,1
1,1
2,0
^»,8
-10,5
-8,2
-7,6
-1,4
-3,9
-12,6
1990
06
-3,1
-6,6
5,6
-0,4
0,4
3,9
-0,9
-2,1
-0,4
0,4
0,8
0,1
-0,4
-3,7
corresponding period of the previous year
10,0
'
1,4
"
8,1
5,2
7,6
24,9
-6,5
9,0
4,6
5,4
5,1
6,7
-4,9
2,9
-6,4 "
^1,6
6,7
3,8
6.5
37,8
8,7
4,4
3,5
4,3
6,6
18,2
-1,9
EXPORTS
corresponding period of tl
-0,7 '
10,4
15,5
5,8
7,7
2,0
14,1
13,8
6,2
0,1
0,1
-2,4
3,8
4,4
-2,0 "
-8,7
2,5
9,6
3,8
10,1
4,6
4,6
5,1
8,0
5,6
17,3
3,1
EXCHANGE RATE
6,5 '
-6,1
4,7
3,8
3,7
22,3
-4,4
7,3
2,6
2,0
3,5
7,4
-5,6
-3,3
-13,5 "
-16,5
-2,4
-6,9
-9,0
9,1
26,0
-8,6
-6,0
-6,6
-1,7
0,8
-1,4
ie previous year
-3,7 '
2,2
8,1
3,7
3,3
-0,3
0,3
14,2
2,7
2,0
-0,8
-0,8
2,1
-6,6
-7,3 "
-10,0
-5,0
13,3
-15,9
-27,7
-3,0
-3,4
1,1
4,1
1,3
7,1
-1,3
corresponding period of the previous year
3,0
15,5
-9,4
-20,4
-1,0
7,1
-14,4
-19,9
1991
06
-5,8 '
-4,7 "
6,1
-0,6
0,4
0,2
-0,8
-1,8
-0,9
0,3
-0,1
-0,6
-2,4
5,4 '
2,3 "
14,4
2,3
0,8
26,1
8,8
-0,3
7,0
5,1
1,2
0,7
-8,0
-1,9 '
9,6 "
12,6
0,7
-1,8
6,8
27,4
8,3
3,8
0,3
-1,4
-14,6
0,2
6,2
16,8
(1 ) External Trade Statistics (Imports CIF, Exports FOB).
¡2) EUR-12 includes only extra flows. Figures for Member States include world flows.
' Estimate.
" CIF component estimated.
: Not available.
EXTRA-COMMUNITY TRADE BY PARTNER COUNTRY: Results for June 1991.
Worsening of the balance of trade with Japan, the EFTA countries and the United States
compared with June 1990.
The worsening of the Community's deficit between the
first halves of 1990 and 1991 is attributable largely to
the deteriorating balance of trade with the
industriali-zed countries (-15 billion ecus out of a total figure of
22.8 billion). The deficit with the United States
wide-ned by 6.6 billion ecus compared with the first half of
1990, amounting to 13.5 billion ecus in the first half of
1991. It is now almost the same as the balance of
trade with Japan (-14.7 billion), which worsened by 3
billion ecus. The Community's trade balance with the
EFTA countries fell by almost 4 billion ecus compared
with the first six months of 1990 and was slightly in the
red in the first half of 1991.
Community imports from Japan rose once again
(+10.9% in the first half of 1991 compared with the first
half of 1990). This increase in ecus is attributable to
the appreciation of the yen between these two periods
(+7.1%). At the same time, Community exports to the
United States fell by 13.7%: the average dollar-ecu
exchange rate calculated over this period is to the
disadvantage of European products. In June 1991,
when the dollar rose against the ecu, Community
imports fell by 2.3% compared with June 1990 and
exports by 9.5%; the difference between the growth
rates for imports and exports was reduced to 7 points
in June 1991, compared with a figure of over 15 points
for the first half of the year.
The mid-1991 cumulative balance of trade with the
developing countries was - 7.8 billion ecus, compared
with only -2.2 billion for the same period in 1990. It
worsened with all the zones, especially the OPEC
countries (- 4.8 billion ecus as a result of the increase
in the cost of the Community's supplies of crude oil)
and the Mediterranean countries. In the latter case,
the traditional surplus was cancelled out in the first half
of 1991 : Community imports rose by 6.5% compared
with the corresponding period in 1990, while exports
stagnated (-2.2%). Community imports from the Asian
NICs showed a substantial rise (+15.4% between the
first halves of 1990 and 1991) as a result of European
demand for manufactured products. Community
ex-ports to all groups of developing countries fell, except
in the case of the Asian NICs (+5%). The Community's
balance of trade with the latter group of countries is
around - 2 billion ecus, on a par with the figure for the
ACP countries. Community exports to the latter fell by
more than 10% between the first halves of 1990 and
1991.
The Community's trade with the countries of central
and eastern Europe showed a deficit of 1.9 billion ecus
in the first half of 1991, a similar figure to that for the
first half of 1990. The growth rates for imports and
exports with these countries between the first halves
of 1990 and 1991, which amounted to almost +25%,
can be attributed to the unification of Germany in
October 1990.
The balance for June 1991 stood at - 5.8 billion ecus,
thereby confirming the trend at the beginning of the
year: the widening of the gap compared with June
1990 is attributable to trade with industrialized
coun-tries. The balance of trade with Japan and the EFTA
cou ntries f ell by 0.7 billion ecus in each case compared
with June 1990, to -2.6 billion and 0.1 billion
respecti-vely. The June 1991 balances are negative with all the
groups of countries apart from EFTA (0.1 billion) and
the Mediterranean countries (0.3 billion), but even
these slight surpluses are down on the corresponding
figures for June 1990.
GR . II - EXTRA TRADE BALANCE (MAIN PARTNERS)
(BIO ECU)
JAPAN
JAPAN
90
01-06
91
90
06
TABLE II EUR12 TRADE BALANCE AND TRADE FLOWS BY MAIN PARTNERS
(1)
INTRAEC
EXTRAEC whose
INDUSTRIALIZED THIRD
COUNTRIES
United States
Japan
EFTA
DEVELOPING COUNTRIES
Asian NICs (2)
OPEC
Mediterranean Basin
ACP
COUNTRIES IN MIDDLE
AND EASTERN EUROPE
100,0
59,8
18,2
5,4
26,5
32,0
5,5
8,4
10,9
4,0
6,5
15,5
13,8
12,0
8,7
24,1
12,0
15,5
16,4
12,3
14,9
6,9
24,3
6,3
5,3
6,7
6,5
EXPORTS
6,0
4 , 2
% change on the corresponding period of the previous year
1,6
0,9
1 , 9
7,5
3,2
2,5
1,5
1,2
12,1
0,1
12,6
6,6
8,1
18,7
8,8
2,6
7,7
3,4
7,1
2,1
-13,0
19,9
0,7
5,1
-8,7
-2,4
-4,7
3,0
13,7
4,1
2 , 4
8,5
30,1
4,4
4,2
1,5
13,3
6,8
6,2
4,5
8,4
17,0
5,2
7,1
3 , 7
6 , 6
-13,7
-5,7
-3,6
-2,4
5,0
-1,5
-2,2
-10,7
24,8
-6,6
-6,9
9 , 8
5,5
3,6
3,1
-12,3
3,1
7,0
7,4
13,5
EXTRAEC whose
INDUSTRIALIZED THIRD
COUNTRIES
United States
Japan
EFTA
DEVELOPING COUNTRIES
Asian NICs (2)
OPEC
Mediterranean Basin
ACP
COUNTRIES IN MIDDLE
AND EASTERN EUROPE
EXTRAEC whose
INDUSTRIALIZED THIRD
COUNTRIES
United Slates
Japan
EFTA
DEVELOPING COUNTRIES
Asian NICs (2)
OPEC
Mediterranean Basin
ACP
COUNTRIES IN MIDDLE
AND EASTERN EUROPE
1990
STRUC
TURE
%
100,0
59,7
18,4
10,0
23,2
31,1
6,3
9,7
9,1
4,3
6,5
1989
33,7
22,2
5 , 6
25,2
5,4
5,9
3 , 7
5,8
3,5
3 , 0
3,1
15,2
13,4
22,4
11,3
13,2
17,6
8,3
28,2
23,1
11,7
16,4
1990
42,9
25,5
8,6
23,5
2,8
9,5
3,1
9,5
3,3
3,5
2 , 9
1991
I
1991
II
1990
0106
1991
0106
T R A D E BALANCE (Mrd ECU)
20,9
12,5
5 , 9
6 , 4
0 , 4
5 , 3
1,4
3 , 4
0 , 4
1 , 3
1 , 0
22,5
'
17,0
'
7 , 6
'
8 , 2
'
0,9
'
2 , 6
'
0,8
'
1 , 4
'
0,7
'
0 , 6
'
0,9
'
20,7
14,5
6,9
11,5
2,8
2,2
0,9
2,5
2,2
0,6
1,7
IMPORTS
43,5
'
29,5
"
13,5
'
14,7
'
1 , 2
'
7,8
'
2 , 2
'
4.8
'
0,3
'
2 , 0
'
1,9
'
%
change on the corresponding period of the previo
3,6
2,0
1,8
0 , 2
5,9
5,0
1 , 3
10,1
13,8
2,7
10,1
3,0
0,7
3 , 0
5,5
2,4
1,7
12,5
3,7
5,1
3,3
28,2
10,0
'
8,7
'
8,7
'
16,1
'■
4,9
'
9,9
'
18,5
'
16,9
'
8,2
'
6,6
'
18,9
'
2,9
2,6
4,4
0,5
4,7
3,3
2,8
5,4
11,2
4,5
1,6
6,5
'
4,7
'
3,0
'
10,9
'
3,7
'
5,7
'
15,4
'
9,7
'
6,5
'
4,9
'
23,4
'
1990
06
3 , 1
2,1
1,3
1,9
0,8
0,1
0,1
0,0
0,8
0,0
0,5
us year
3,3
5 , 3
1 , 7
8,9
6 , 0
0,6
9,9
10,8
0,6
17,1
4,9
1991
06
5,8
4,3
1,7
2,6
0,1
0,5
0 , 2
0,4
0,3
0,0
0,3
5,4
4,3
2,3
14,9
3,8
4,4
14,8
19,0
6,4
3,5
15,9
7,6
1,9
5,5
9,5
5,9
3 , 3
1,2
11,2
4,9
-6,0
-5,6
29,8
(1) External Trade Statistics (Imports CIF, Exports FOB),
(2) Asian NICs include the following countries: Singapore, South Korea, Taiwan and Hong Kong.
' Estimate.
[image:13.595.62.542.14.731.2]EXTRACOMMUNITY TRADE BY PRODUCT: Results for June 1991.
Even greater deficits than in June 1990 on machinery/transport equipment and fuel
products.
The increase of 22.8 billion ecus in the deficit for the
first half of 1991,
bringing it to a total of 43.5 billion,
can be ascribed to the following items: machinery and
transport equipment (SITC 7), where the surplus fell
by almost half (9.6 billion), and other manufactured
goods (SITC 6+8), which went from a slight deficit of
1.1 billion ecus in the first half of 1990 to a hefty 9.7
billion in 1991.
Fuel products (SITC 3) contributed 4.7
billion to the increased deficit. Compared with the first
half of 1990, the Community's balance of trade is down
on almost all the groups of products, apart from crude
materials (SITC 2+4), where it rose by 3.3 billion ecus
as a result of the fall in market prices.
There was a surplus of around 8 billion ecus on trade
in machinery/transport equipment and chemicals
(SITC 5) in the first half of 1991, but this was down on
the figure for the first half of 1990.
Imports of the two items responsible for the bulk of the
increased deficit (machinery and transport equipment,
other manufactured goods) showed a substantial in
crease compared with the first half of 1990 (+9.9% and
+7% respectively) and were accompanied by a fall in
exports (3.6% and 5.8% respectively). Imports of
these types of products leapt in the second quarter of
1991 compared with the corresponding period in 1990,
whereas exports, which fell in the first quarter of 1991
compared with the first quarter of 1990, continued to
decline in the second of 1991, although not to the same
extent. Imports of chemicals rose significantly between
the first halves of 1990 and 1991 (+10%), while exports
remained more or less stable (0.3%).
Imports of fuel products went up by 13.7% between
the first halves of 1990 and 1991, the average cost of
the Community's supplies of crude oil having risen by
8%. The balance on food products fell by 1.3 billion
ecus to 3.8 billion for the first six months of 1991.
The June
1991
deficit, which was 2.7 billion ecus more
than in June 1990, suffered from the surge in energy
imports (+20%), the cost of which rose substantially
between these two periods (+25% in ecus). The in
crease in the cost of the Community's supplies of crude
oil in dollars was compounded by the 6% rise in the
value of the dollar against the ecu. This item ac
countedfor 1.1 billion ecus of the increase in the deficit,
while machinery and transport equipment were re
sponsible for 1.4 billion. Imports of this type of product
were in fact 7.7% higher in June 1991 than in June
1990. Moreover, imports of other manufactured goods
seemed to slow down in June 1991, rising by only 2.8%
compared with June 1990, as against 7% between the
first halves of 1990 and 1991. On the export side,
chemicals showed a rise of 2% in June 1991 compared
with June 1990, with the surplus staying at 1.4 billion
ecus.
GR. Ill
EXTRA TRADE BALANCE (PRODUCT GROUPS)
(BIO ECU)
Manufactures
« ■ ·
3 0
15
0
■15 +
■30
45
«
» T
IOTManufactures
■ 5
Manufactures
Prim, goods
90
91
0106
90
91
TABLE III - EUR-12 TRADE BALANCE AND TRADE FLOWS BY BROAD PRODUCT GROUPS (1)
EXTRA-EC
-Food, etc {SITC 0+1)
- Crude materials (SITC 2+4) (2)
- Fuel products (SITC 3)
-Chemicals (SITC5)
- Machinery, transport eq. (SITC 7)
- Other manufacl goods (SITC 6+8)
- Articles not classified (SITC 9)
1990
STRUC-TURE
%
-1989
-33,7
-4,7
-32,7
-52,5
18,7
35,0
3,0
-0,4
1990
-42,9
-5,1
-29,1
-59,3
18,2
37,6
-1,8
-3,4
1991
I
1991
II
1990
01-06
1991
01-06
TRADE BALANCE (Mrd ECU)
-20,9
-1,5
-6,2
-16,1
3,4
6,1
-5,5
-1,0
-22,5
'
-2,3
'
-6,9
'
-14,0
'
4,2
'
2,5 '
-4,1
'
-2,0 '
IMPC
-20,7
-2,5
-16,4
-25,4
9,2
18,3
-1,1
-2,7
RTS
-43,5 '
-3,8 '
-13,1 '
-30,1 '
7,5 "
8,7 '
-9,7 '
-3,0 '
1990
06
-3,1
-0,5
-2,8
-3,7
1,5
2,8
-o,o
-0,3
1991
06
-5,8 '
-0,6 '
-2,2 '
-4,8 '
1,4 '
1,4 '
-0,7 '
-0,4 '
EXTRA-EC
-Food, etc (SITC 0+1)
- Crude materials (SITC 2+4) (2)
-Fuelproducts (SITC3)
-Chemicals (SITC 5)
- Machinery, transport eq. (SITC 7)
- Other manufact. goods (SITC 6+8)
- Articles not classified (SITC 9)
EXTRA-EC
-Food, etc (SITC 0+1)
- Crude materials (SITC 2+4) (2)
- Fuel products (SITC 3)
- Chemicals (SITC 5)
- Machinery, transport eq. (SITC 7)
- Other manufact. goods (SITC 6+8)
- Articles not classified (SITC 9)
100,0
7,3
2,1
2,7
11,6
40,4
31,1
4,8
%
change on the corresponding period of the previous year
100,0
7,7
8,2
15,2
6,6
28,6
28,6
5,1
15,2
3,7
13,4
30,2
17,0
17,2
18,6
-16,2
3,6
-0,1
-10,2
13,6
3,5
5,6
3,1
-0,9
3,0
0,1
-19,9
12,0
10,4
4,5
5,2
-€,2
10,0
7,9
-12,0
15,8
9,7
15,0
9,0
15,7
2,9
-0,1
H O
3,8
2,0
6,2
2,9
2,3
6,5
4,0
-15,9
13,7
10,1
9,9
7,0
4,4
-3,3
-1,2
-6,9
-14,2
-6,2
-2,4
1,4
2,3
5,4 '
-2,1 '
-15,6 '
20,0 '
6,4 '
7,7 '
2,8 '
21,2 '
EXPORTS
% change on the corresponding period of the previous year
13,8
20,0
9,2
14,5
7,9
13,3
15,1
16,8
1,6
-1,1
-7,6
17,3
1,1
6,1
-0,6
-13,8
-6,6
-7,9
-4,6
-11,2
-5,5
-6,0
-8,7
1,3
-0,7
-0,0
6,8
-4,9
5,0
-1,2
-3,0
2,8
4,4
2,5
-7,9
20,5
2,2
8,7
3,1
-11,2
-3,7
-4,1
0,9
-8,1
-0,3
-3,6
-5,8
2,0
-6,6
-3,2
-9,0
12,6
-8,4
-3,4
-8,5
-26,4
-1,9
-6,4
1,4
-19,3
2,0
-2,9
-3,2
25,6
(1) External Trade Statistics (Imports CIF, Exports FOB).
(2) Petroleum not included.
' Estimate.
SITC Rev.3 is in application from 1988.
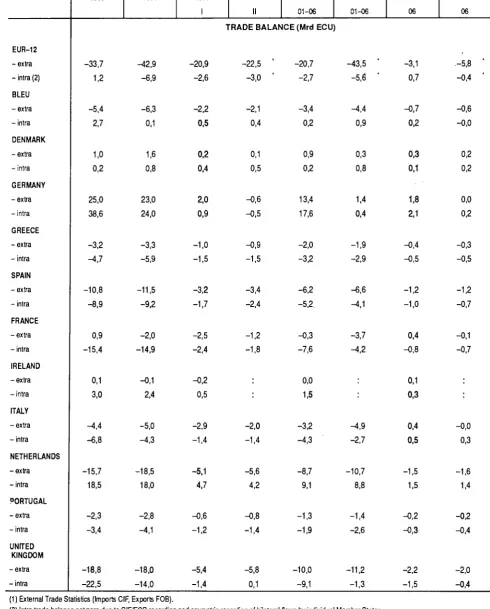
INDIVIDUAL MEMBER STATES' AND INTRACOMMUNITY TRADE: Results for June 1991.
Sharp fall in Germany's surpluses in the first half of 1991 :
extraCommunity balance +1.4 billion ecus, intraCommunity balance +0.4 billion.
In the first half of 1991, the negative extraCommunity
trade balance worsened compared with the first half of
1990, mainly because Germany's surplus on extra
Community trade shrank to 1.4 billion ecus from 13.4
billion in the first half of 1990. France accounted for
3.4 billion ecus of the increased deficit, with a balance
of 3.7 billion, as did to a lesser extent the Netherlands
(balance: 10.7 billion), Italy (4.9 billion) and the Uni
ted Kingdom (11.2 billion). Forthe other countries the
situation remained unchanged.
IntraCommunfty trade increased at a slightly slower
rate than extraCommunity imports in the first half of
1991, which was not the case in June (+7.6% for
intraCommunity trade, as against +5.4% for extra
Community imports). Germany's intraCommunity
trade surplus fell from 17.6 billion ecus in the first half
of 1990 to 0.4 billion in the first six months of 1991,
owing to the rerouting of products to the domestic
market and the surge in imports. The United Kingdom
continued its efforts to balance its intraCommunity
trade books: the cumulative deficit fell from 9.1 billion
ecus in mid1990 to 1.3 billion in mid1991. At the
same time, France reduced its deficit by 3.4 billion
ecus to just over 4 billion.
GR
.
IV
■
MEMBER STATES' EXTRA AND INTRA TRADE BALANCES
(BIO ECU)
E C
Q L
OK
E X T R A
I I
O l D f l / n o
2
O
JUL
i!_a*ua
"UT"
O R o e / g i
*= I R L I
EUR-12
- extra
- intra (2)
BLEU
- extra
- intra
DENMARK
-extra
- intra
GERMANY
-extra
- intra
1989
-33,7
1,2
-5,4
2,7
1,0
0,2
[image:17.595.54.545.52.662.2]25,0
38,6
TABLE IV
1990
-42,9
-6,9
-6,3
0,1
1,6
0,8
23,0
24,0
-
EXTRA - AND INTRA - EC TRADE BALANCE (1
)
1991
I
1991
II
1990
01-06
1991
01-06
TRADE BALANCE (Mrd ECU)
-20,9
-2,6
-2,2
0,5
0,2
0,4
2,0
0,9
-22,5
-3,0 '
-2,1
0,4
0,1
0,5
-0,6
-0,5
-20,7
-2,7
-3,4
0,2
0,9
0,2
13,4
17,6
-43,5
-5,6 '
-4,4
0,9
0,3
0,8
1,4
0,4
1990
06
-3,1
0,7
-0,7
0,2
0,3
0,1
1,8
2,1
1991
06
-5,8
-0,4 '
-0,6
-0,0
0,2
0,2
0,0
0,2
GREECE
- extra
- intra
SPAIN
- extra
- intra
FRANCE
- extra
-intra
IRELAND
-extra
- intra
ITALY
-extra
- intra
NETHERLANDS
-extra
-intra
PORTUGAL
- extra
- intra
UNiïED
KINGDOM
-extra
- intra
-3,2
-4,7
-10,8
-8,9
0,9
-15,4
0,1
3,0
-4,4
-6,8
-15,7
18,5
-2,3
-3,4
-18,8
-22,5
-3,3
-5,9
-11,5
-9,2
-2,0
-14,9
-0,1
2,4
-5,0
-4,3
-18,5
18,0
-2,8
-4,1
-18,0
-14,0
-1,0
-1,5
-3,2
-1,7
-2,5
-2,4
-0,2
0,5
-2,9
-1,4
-5,1
4,7
-0,6
-1,2
-5,4
-1,4
-0,9
-1,5
-3,4
-2,4
-1,2
-1,8
-2,0
-1,4
-5,6
4,2
-0,8
-1,4
-5,8
0,1
-2,0
-3,2
-6,2
-5,2,
-0,3
-7,6
0,0
1,5
-3,2
-4,3
-8,7
9,1
-1,3
-1,9
-10,0
-9,1
-1,9
-2,9
-«,6
-4,1
-3,7
-4,2
-4,9
-2,7
-10,7
8,8
-1,4
-2,6
-11,2
-1,3
-0,4
-0,5
-1,2
-1,0
0,4
-0,8
0,1
0,3
0,4
0,5
-1,5
1,5
-0,2
-0,3
-2,2
-1,5
-0,3
-0,5
-1,2
-0,7
-0,1
-0,7
-0,0
0,3
-1,6
1,4
-0,2
-0,4
-2,0
-0,4
(1 ) External Trade Statistics (Imports CIF, Exports FOB).
(2) Intra trade balance not zero due to CIF/FOB recording and asymétrie recording of bilateral flows by individual Member States.
' Estimate.
GLOBAL TRENDS : First quarter 1991 Sharp drop on the Community's current account
balance; US current deficit contracts significantly; Japanese current surplus also registers
some reduction. Financing of Gulf multinational forces leads to some significant flows of
unilateral transfers.
The Community's current account balance for the
first quarter of 1991 was well below that forthe same
quarter in 1990, showing a deficit of 18.9 billion ecus
compared with a deficit of 5.3 billion the year before.
This development continues the downward trend on
current balance observed throughout 1990, and is
due in major part to the contraction of the German
trade surplus (see below). Both trade and invisibles
balances fell, down 10.5 and 3.1 billion ecus respec
tively.
The current account balance of the USA recorded a
firstquarter surplus of 11.5 billion ecus ($15.4 billion)
compared with a deficit of 14.3 billion ecus ($17.2
billion) for the same three months in 1990. Most of
this improvement was the result of a large increase
in unilateral transfer receipts due to cash contribu
tions from the coalition partners in operation Desert
Storm. There was also a marked reduction in the US
trade deficit which was down 8.5 billion ecus in
yearonyear terms.
Japan's current account surplus for the first quarter
of 1991 was 7.6 billion ecus (1360 billion yen) com
pared with 10.2 billion ecus (1850 billion yen) forthe
same period in 1990. Once again it was the financ
ing of operations in the Gulf which was primarily
responsible, causing the Japanese invisible balance
to drop 6.1 billion ecus in yearonyear terms.
Japan's trade surplus was actually 3.5 billion ecus
up on the same three months of 1990.
Balance of payments of the EC, USA and Japan : developments on main balances (billion ecu)
5 £ —
: current balance
— Q _ : capital balance
— ■ # ■ : reserves
1 2
3 4
E U R 1 2
USA
2
3
1990
1
1991
JAPAN
Current balance
Trade balance
Invisibles balance
Capital (net) (1)
Reserves
Errors and omissions
Current balance
Trade balance
Invisibles balance
Capital (net) (1)
Reserves
Errors and omissions
Current balance
Trade balance
Invisibles balance
Capital (net) (1)
Reserves
[image:21.595.61.545.31.475.2]Errors and omissions
TABLE V - BALANCE OF PAYMENTS: MAJOR ITEMS EUR-12, USA, JAPAN
1989
6,9
2,9
3,9
-13,7
2,9
28,6
-96,8
-105,3
8,5
102,2
-23,2
17,8
51,8
69,9
-18,1
-43,5
11,9
-20,2
1990
-6,4
-2,1
-4,4
36,1
-35,3
39,0
-72,1
-84,6
12,5
23,5
-1,9
50,4
28,4
49,8
-21,4
-18,2
5,7
-16,0
1989
IV
3,2
5,1
-2,0
-28,0
11,3
23,2
-23,3
-27,6
4,3
32,8
-2,8
-6,7
10,5
14,2
-3,7
-7,4
1,4
-4,5
1990
I
EUR-12
-5,3
-0,3
-5,0
20,2
-7,9
-0,1
(Bill)
USA (Billioi
-14,3
-19,5
5,2
5,1
-2,6
11,8
JAPAN
10,2
11,9
-1,7
-15,2
8,6
-3,7
1990 .
II
»n
ECU)
-4,9
-0,5
^ , 4
18,2
-19,1
14,9
ECU)
-16,9
-17,9
1,0
-3,3
0,2
20,0
(Billion ECU)
6,5
11,1
-4,7
-6,0
-0,5
-0,0
1990
III
4,1
0,4
3,6
5,2
-10,5
6,8
-22,5
-24,7
2,2
15,0
1,4
6,1
5,8
13,3
-7,5
0,4
-1,1
-5,1
1990
IV
-0,3
-1,7
1,4
-7,5
2,2
17,4
-18,4
-22,5
4,1
6,7
-0,8
12,5
6,0
13,4
-7,5
2,6
-1,3
-7,2
1991
I
-18,9 '
-10,8 '
-8,1 '
11,5
-11,0
22,5
-0,3
7,6
15,5
-7,8
* Estimates
: Nol available
(1 ) Excluding reserves
INDIVIDUAL MEMBER STATES
Balance of payments by country (Billion ecu)
ν
: current balance
Q
: capital balance
—
%■
: reserves
BLEU: Figures forthe fourth quarter of 1990 showed
some yearonyear improvement on the current ac
count balance, due essentially to a higher trade
surplus. Outflows of BLEU capital in the third and
fourth quarters of 1990 were well up on the same six
months of the previous year. Fourth quarter reser
ves ended little changed.
Denmark: The current account balance for the first
three months of 1991 was slightly up on the same
quarterthe year before, continuing the trend of year
onyear rises set during 1990. However, the factor
behind this increase was not, as during 1990, a
higher trade balance, but rather a significant fall of
the invisibles deficit. Reserves meanwhile de
creased, the first quarterly decrease since 1989.
Germany: The current balance registered a deficit
of 4.5 billion ecus for the firstquarter of 1991, down
20.1 billion in yearonyear terms. This was mainly
the result of a continued decline on the trade balance
(down 14.3 billion ecus), although the German con
tribution to the cost of the Gulf war also led to a sharp
increase in the deficit of unrequited transfers. The
resulting changes on capital account have also been
significant, with German capital outflows continuing
to decline sharply, and reserves showing a first quar
ter fall.
Greece: Despite a substantial increase in the Greek
trade deficit for the first quarter 1991, the current
account deficit was lowerthan that forthe same three
months in 1990. This was due to a yearonyear rise
of 0.8 billion ecus on the invisibles surplus. Greek
official reserves ended the first quarter up 0.4 billion
ecus.
Spain: In the first three months of 1991, the Spanish
current deficit contracted by 1.7 billion ecus in year
onyear terms, with both trade and invisibles balan
ces showing improvements.
2
3
4
France: The first quarter 1991 current deficit was
slightly lower than that for the same period in 1990.
The deficit on visible trade, however, registered a
substantial year-on-year increase. This was
com-pensated for by a higher invisibles balance due
mainly to lower outflows of unrequited transfers
(there having been a particularly large cancellation
of debt in the first quarter of 1990). There was a
modest net inflow of capital in the first three months
of 1991, notable developments being substantial
French purchases of foreign securities and a large
first quarter inflow of direct investment. At the end of
the quarter official reserves showed little change.
Ireland: Ireland's current account balance for the
fourth quarter of 1990 was up on the same three
months of 1989. The year-on-year rise is due
not-ably to a higher surplus on unrequited transfers, the
merchandise trade surplus having decreased in both
third and fourth quarters. On the capital account,
there was a large fourth quarter outflow of capital
emanating primarily from the private non-bank
sec-tor. During the same period, reserves fell by 1.1
billion ecus.
Italy: In the first quarter of 1991, the Italian trade
deficit decreased by 1.7 billion ecus in year-on-year
terms, leading to a similar drop on the current
ac-count deficit. The January-March 1991 invisibles
deficit, which had been rising during 1990, showed
little change on the same period the year before.
After a fall in the fourth quarter, reserves rose by 3.4
billion ecus in the first three months of 1991.
Netherlands: Although the first quarter 1991 trade
deficit was up 0.8 billion ecus on the year before, the
current balance fell slightly due to a drop on the
invisibles balance. During the same quarter, net
outflows of capital were accompanied by a slight
increase in reserves.
Portugal: The Portuguese trade deficit for the first
quarter of 1991 registered an increase of 0.4 billion
ecus on the corresponding period in 1990. The
current balance fell by a similar amount, net
invisi-bles having recorded little movement. Portuguese
official reserves also remained stable in the first
quarter 1991.
United Kingdom: The UK current account deficit was
2.7 billion ecus lower than in January-March 1990
owing to a reduced trade deficit, but this
improve-ment was less marked than that of the preceding six
months. The surplus on invisibles fell only 0.3 billion
ecus in year-on-year terms, but this hid a significant
drop in net investment income (down 1.1 billion ecus)
and a large reduction in net outflows of official
trans-fers (down 1.2 billion, reflecting partners'
contribu-tions towards the cost of the Gulf conflict and
relatively low net payments to the EC). First quarter
capital inflows of 5.3 billion ecus were accompanied
by an increase of 2.3 billion in UK official reserves.
I R L
2 3
1989
1 2 3 4 1 2 3
1989 1990
Part 2: EXTERNAL TRADE
Available data in this issue:
May 1991
June 1991
July 1991
(The tables refer to the sta
Analysis and commentary:
Methodological notes:
EUR 12
X
UEBL
X
X
DK
X
X
X
D
X
X
X
GR
Χ
Χ
Χ
Ε
Χ
Χ
Χ
F
Χ
χ
χ
IRL
Χ
ι
χ
χ
χ
NL
Χ
χ
χ
Ρ
χ
χ
χ
e of the CRONOS database on 9. 10. 1991)
Page VII
See Glossarium 1991
As from the beginning of January 1988: SITC, Revision 3
υκ
χ
χ
Foreword
Two important changes have taken place in 1988 with regard
to the collection of external trade statistics:
(i) The introduction of the Single Administrative Document,
which not only covers trade in Community goods
between Member States but is also intended to be used
for the corresponding formalities in trade with
non-member countries. This simplification of declaration pro
cedures in the exchange of goods marks an important
step towards completion of the internal market.
(ii) The simultaneous entry into force of a new goods classi
fication known as the Combined Nomenclature (CN),
which is intended to meet Common Customs Tariff and
statistical requirements alike. This nomenclature is
based on the Harmonized Commodity Description and
Coding System (HS), whose aim is to enhance the world
wide comparability of external trade statistics.
As a result of both these changes, customs and statistical
departments were faced with a considerable amount of work
until the procedures had been properly introduced and
tested and formed part of normal working practice.
This meant that there were delays in the forwarding of data
in all the Member States. In addition, there was bound to be
a higher quota of errors and corrections, so that the first
month's data are not directly comparable with those of the
preceding year and therefore need to be interpreted with
caution.
In particular, it should be noted that considerable diver
gences have arisen at subheading level between the Combi
ned Nomenclature and the formerly used Nimexe, leading to
a break in the goods-related time series between 1987 and
1988. Up to December 1987 this Bulletin used the SITC Rev.
2, which was worked out using the 6-digit Nimexe, while
from January 1988 it uses the SITC Rev. 3, which has been
drawn up using the 8-digit subheadings of the Combined
Nomenclature.
As an aid to interpretation of the statistics, Eurostat has
published in Theme 6 'Foreign Trade, Series E: Methods'
brochures entitled 'Nomenclature of goods, CN-Nimexe cor
relation tables'. These provide a comparison between the old
and new nomenclatures as well as showing the links bet
ween the Combined Nomenclature (CN) and its offshoots.
Eurostat will be glad to provide users of European statistics
with any further information or explanations they may require
with regard to these new developments.
Important note
As from October 1990 the foreign trade figures of the Federal Republic of Germany, the other Member States and of EUR 12
concern the Federal Republic of Germany as constituted from 3 October 1990.
In Tables Β and C the reader will find the trade of the Federal Republic of Germany, including West Berlin, as constituted
prior to 3 October 1990.
Table of contents
Commentary
Charts
General summary of trade by country:
Tab. 1: Yearly and quarterly data .
Tab. 2: Monthly data
General summary of trade by commodities:
Tab. 3: Yearly and quarterly data
Tab. 4: Monthly data
Trends in trade by country:
Tab. 5
Tab. 6
Tab. 7
World, intra- and extra-EC . . .
Intra-EC by member countries
Major areas
Trends in trade by commodities:
Tab. 8: SITC sections
Trade by partner countries:
Tab. 9: All commodities (monthly cumulative data)
Tab. 10: SITC sections and main partner countries (quarterly cumulative data)
Indices:
Tab. 11: Volume and unit value indices
Trade of main non-Community countries:
Tab. 12: Trends in total trade and with the EC (EUR 12)
Conversion rates:
Tab. 13: Member countries, United States of America, Japan and Switzerland
EC trade in agricultural products:
Tab. 14: Main product groups
Tab. 15: Products subject to common agricultural policy regulations
EC trade in petroleum products:
Tab. 16: Petroleum and petroleum products
EC and world trade:
Tab. A: World, Community and main non-Community countries
Trade of the FR of Germany, including West Berlin, as constituted prior to 3 October 1990:
Tab. B: Trade by countries
Tab. C: Trade by products
VII
XXIX
2
5
8
11
16
24
30
52
92
100
102
106
Catalogue of regular publications of external trade
108
109
112
188
Symbols and abbreviations used
EUR 12: Total of the EC member countries
UEBL: Belgo-Luxembourg Economic Union
DK: Denmark
D: Federal Republic of Germany
GR: Greece
E: Spain
F: France
IRL: Ireland
I: Italy
NL: Netherlands
P: Portugal
UK: United Kingdom
USA: United States of America
0: Data less than half the unit used
Mio: Million
Mrd: 1 000 million
ECU: European currency unit
Eurostat: Statistical Office of the European Communities
SITC: Standard International Trade Classification
Trade of the EC with the United States of America
Mio ECU
2 400
2 200
2 000
1 800
1 600
1 400
1 200
Mio ECU
14 000
1 000
800
600
400
200
Oils and fats Cereals Wine Tobacco Fresh fruit and Live swine Fish
vegetables and meat
Rice
TRADE OF THE EG BT MAJOR COUNTRIES
MIO ECU
Impor te
E x p o r t β
3000
2500
2000
1750
1500
1250
1000
—
— -•y
—\^Λ
Χ
/
—
\ y '
, , 1
Sweden
\ X/'
i
*■· ·» — ^ ~ "* "
—
—
ι Ι ι ι
1989
1990
1991
3000
2500
2000
1750
1500
1250
1000
Swi tze rI a n d
1989
1990
1991
5000
4500
4000
3500
3000
2500
2000
1750
1500
—
/·
s
s
*
—
—
y.
—
/**>^/
^""^
ι ι I ι ι Ι ι ι Ι ι ι
J a p a n
ι ι I ι ι Ι ι ι Ι ι ι
Λ
/ *
/
v
ι ι I ι ι Ι ι
—
—
—
—
—
ι Ι ι ι
1989
1990
1991
5000
4500
4000
- 3500
3000
- 2500
2000
1750
1500
1250
eurostat
TRADE OF THE EC BY MAJOR COUNTRIES
MIO ECU
" I m p o r t s
E x p o r t β
Aus t r i a
3000
2500
2000
1500
—
, .
1200 —
1000
\
/
ν
_ι
Ι
ι
ι
Ι
ι
ι
Ι
ι
ι
Ι
ι
ι
I
ι
ι
Ι
ι
ι
Ι
ι
— 3000
2500
2000
ι Ι ι ι Ι ι ι Ι
1500
1200
1000
1989
1990
1991
N o r w a y
1989
1990
1991
Sov i e t Un I on
1989
1990
1991
\3ñ
eurostat
GENERAL SUMMARY
of EC trade by country
Values in Mio ECU
1 0 0 0 1 0 1 0 1011 1 0 2 0 1021 1 0 2 2 1 0 2 3 1 0 2 8 1 0 3 0 1031 1 0 3 2 1 0 3 3 1 0 3 8 1 0 6 0 1 0 7 0 1 0 9 0 1051
1 0 5 3
1 0 5 7
1 0 5 8
024 028 030 032 036 038 043 046 048 052 056 060 062 064 066 068 204 208 212 216 220 248 268 272 ' 2 7 6 288 302 314 318 322 330 346 352 372 373 382 388 400 404 412 436 442 448 458 462 464 460 484 496 500 504 508 512 520 524 528 600 604 608 616 624 628 632 640 644 647 649 653 662 664 666 669 680 700 701 706 708 720 728 732 736 740 800 804 809 996 Partner countries
W O R L D
IntratC ( E U R 1 2 ) E x t r a - E C
Class 1
E F T A
Other W e s t . Europe U S A a n d C a n a d a Other class 1
Class 2
A C P (68 countries) D O M
T O M Other class 2
Class 4 Class 5 Miscellaneous
Mediterranean Basin O P E C
A S E A N Latin America
Main countries :
I c e l a n d
Norway
S w e d e n Finland Switzerland Austria Andorra Malta Yugoslavia Turkey Soviet Union Poland Czechoslovakia H u n g a r y R o m a n i a Bulgaria
M o r o c c o Algeria Tunisia Libya Egypt Senegal Liberia Ivory Coast G h a n a Nigeria C a m e r o o n G a b o n C o n g o Zaire Angola K e n y a Tanzania Reunion Mauritius Z i m b a b w e South Alrica (1)
United States ol America C a n a d a
Mexico Costa Rica P a n a m a C u b a Guadeloupe Martinique Jamaica Colombia Venezuela French Guiana Ecuador Peru Brazil Chile Paraguay U r u g u a y Argentina
C y p r u s L e b a n o n Syria Iran Israel Jordan Saudi Arabia Bahrein Qatar
United Arab Emirates O m a n
Y e m e n Pakistan India Bangladesh Sri Lanka Thailand Indonesia Malaysia Singapore Philippines China South Korea Japan Taiwan Hong Kong
Australia N e w Zealand N e w Caledonia and dep.
Inter-zone trade
1988
9 3 0 S 9 4 5 4 0 8 3 3 3 8 7 8 9 1 2 3 8 8 9 8
90 653 10 907 76 765 60 573 116 617 17 541 1 3 6 3 740 96 973
2 3 4 8 7 7 4 8 6 1 8 6 9
30 196 31 851 12 203 23 047 731 12 507 21 965 8 996 29 572 16 881 29 390 5 892 4 346 12 990 3 361 2 211 2 158 2 234 462 2 271 4 864
1 527 5 223
1 646 384 679 1 615 497 2 876 1 105 1 092 403 1 284 713 532 183 128 667 603 12 528 68 349 8 415 2 466 355 400 374 133 166 208 1 322 1 155 28 328 684 9 329 2 187 366 884 2 624 400 112 421 3 106 2 885 121 5 470 109 68 649 316 1 230 3 266 371 349 2 966 2 134 2 687 2 993
1 209 7 005 7 240 41 618 8 067 6 317
4 881
1 546
246
3 273 1989
1 0 7 3 5 5 2 6 2 4 4 8 8 4 4 6 7 1 6 2 7 0 8 9 3
102 589 13 436 93 472 61 396 137 113 19 597 1 4 1 3 878 115 225
27 3 4 8 9 715 2 3 4 7
37 174 40 843 15 173 26 047 779 15 365 25 406 9 918 32 029 19 092 33 568 6 997 5 536 15 166 3 858 2 558 2 587 2 548 531 2 674 5 848 1 980 6 304 2 441 413 1 055 1 622 642 3 472
1 096 1 002 569
1 348 538 588 207 110 718 752 8 185 83 660 9 812 2 760 397 401 •133 122 169 301 1 525 1 559 72 326 1 0 4 0 10 446 2 752 427 659 2 787 524 101 775 5 352 3 197 102 6 666 98 121 1 553 144 1 271 4 181 427 419 3 362 2 553 3 507 4 023 1 325 9 149 6 953 46 337 9 259 6 432 5 271
1 602
327
3 481 1990
1 1 2 9 0 5 5 6 6 3 7 9 7 4 6 2 7 2 0 2 7 6 3 8 0
108 597 14 648 94 591 58 545
143 9 4 8
20 125 1 5 8 8
712 121 523
2 9 2 1 6 11 0 9 5
2 538 42 298 44 982 16 748 25 356 936 16 465 25 432 10 438 34 338 20 989 36 649 7 684 5 943 16 749 5 278 2 786 3 004 1 617 593 3 043 6 940 2 250 7 888 2 299 411 702 1 677 730 4 386
1 379
1 095 602
1 142
1 092 520 177 125 756 577 5 929 85 182 9 409 2 947 433 490 325 97 194 278 1 465 1 784 75 354 803 9 203 2 617 445 567 3 474 581 97 1 239 5 798 3 467 92 8 224 90 74 1 509 153
1 461
4 553 501 440
4 105 2 863 3 606 4 694 1 257 10 603 6 557 46 224 9 159 5 916 4 822 1 569 185 4 032 I
2 5 9 7 3 7 1 5 0 9 1 4 1 0 8 3 2 4 6 6 2 3 6
2 4 9 7 9 3 472
23 285 14 500
3 3 1 3 9
4 713
424
188 2 7 814
6 2 6 6 2 2 6 9 499 8 967 9 731 3 769 5 979 191 3 633 6 301 2 467 7 822 4 565 6 149 1 790 1 454
3 472
903 585 586 600 134 650
1 342 495 1 322 560 93 279 397 168 847 290 175 126 314 163 142 67 33 141 186
1 972 20 947 2 338 674 98 86 115 49 46 57 388 334 8 72 214 2 330 690 33 222 602 152 33 118 1 394 847 25 1 769 29 21 455 62 350 1 098 105 98 891 652 851 829 361 2 127
1 771
10 877 2 200 1 592 1 319 332 89 820 1989 II 2 7 8 7 0 4 1 6 2 1 7 0 1 1 5 9 2 9 71 5 7 6
26 695 3 335 25 309 16 238
34 329
4 912
369 228 2 8 8 2 0
7 2 8 6 2 3 3 7
606 9 508 9 812 3 666 7 041 194
3 971
6 753 2 608 8 247
4 922
7
136 1 751
1 366
4 129 1 015 649 618 696 126 678 1 638 470 1 569 625 110 227 437 138 782 290 255 133 364 86 159 59 33 177 180 2 191 22 600 2 708
747 118 118 115 29 ■III 82 387 ■153 22 108 336 2 804 765 116 1 11 678 142 21 221 1 058 824 27 1 307 24 36 274 25 319 1 132 109 107 845 637 839 1 010 319 2 187 1 710 12 174 2 383 1 462
1 411
■161
97 860
I m p o III 253 1 7 8 144 712 107 785 63 7 1 7 23 808 3 133 21 441 15 335 34 464 4 782 280 234 29 168 6 565 2 636 682 8 919 9 8