White Rose Research Online URL for this paper: http://eprints.whiterose.ac.uk/100681/
Version: Accepted Version
Article:
Chari, S, Tarkiainen, A and Salojärvi, H (2016) Alternative pathways to utilizing customer knowledge: A fuzzy-set qualitative comparative analysis. Journal of Business Research, 69 (11). pp. 5494-5499. ISSN 0148-2963
https://doi.org/10.1016/j.jbusres.2016.04.160
© 2016, Crown Copyright. Published by Elsevier. Licensed under the Creative Commons Attribution-NonCommercial-NoDerivatives 4.0 International
http://creativecommons.org/licenses/by-nc-nd/4.0/
[email protected] https://eprints.whiterose.ac.uk/
Reuse
Unless indicated otherwise, fulltext items are protected by copyright with all rights reserved. The copyright exception in section 29 of the Copyright, Designs and Patents Act 1988 allows the making of a single copy solely for the purpose of non-commercial research or private study within the limits of fair dealing. The publisher or other rights-holder may allow further reproduction and re-use of this version - refer to the White Rose Research Online record for this item. Where records identify the publisher as the copyright holder, users can verify any specific terms of use on the publisher’s website.
Takedown
If you consider content in White Rose Research Online to be in breach of UK law, please notify us by
Alternative pathways to utilizing customer knowledge: A fuzzy-set
qualitative comparative analysis
Simos Chari, University of Leeds
Anssi Tarkiainen, Lappeenranta University of Technology
Hanna Salojärvi, Lappeenranta University of Technology
March, 2016
Acknowledgements:
The authors are grateful to contributions from Associate Professor Charalambos Saridakis,
Leeds University Business School, and Associate Professors Katrina Lintukangas and
Anni-Kaisa Kähkönen, Lappeenranta University of Technology for their suggestions on revising this
paper. Please send correspondence to: Simos Chari, Leeds University Business
School, Maurice Keyworth Building, University of Leeds, Leeds, LS2 9JT, UK
([email protected]); Anssi Tarkiainen, Lappeenranta University of Technology, School of
Business and Management, P.O. Box 20, FI-53851, Lappeenranta, Finland
([email protected]); Hanna Salojärvi, Lappeenranta University of Technology, School of
Business and Management, P.O. Box 20, FI-53851, Lappeenranta, Finland
Abstract
This study explores alternative configurations of causes to customer knowledge utilization
using a set theoretic approach with fuzzy set qualitative comparative analysis. The study uses
a previous empirical dataset of Salojärvi, Sainio, and Tarkiainen (2010) to assess organizational
factors that enhance customer knowledge utilization. The results show that use of key account
management teams and customer relationship management systems are core predictors for high
degrees of customer knowledge utilization. However, these core causes are not sufficient on
their own; they need to be accompanied by different degrees (i.e. high/low) and combinations
of other peripheral antecedents, such as customer relationship orientation, top management
involvement, and formalization. This study shows that many firms make trade-off decisions
regarding the use of these core and peripheral conditions. The present study identifies
alternative pathways to customer knowledge utilization, discuss their differences, and suggest
managerial implications and future research directions.
Keywords: customer knowledge utilization; qualitative comparative analysis, fuzzy-set,
1. Introduction
Customer knowledge – comprising knowledge about and from customers – is increasingly
being recognized as a strategic asset for firms and a predictor of customer and new product
performance (e.g. Salojärvi, Sainio, & Tarkiainen, 2010; Rollins, Bellenger, & Johnston,
2012b; Joshi & Sharma, 2004). However, customer knowledge is complex to manage, dynamic
in nature, and quickly goes out of date (Rollins et al., 2012b). Prior studies indicate that in
general, firms tend be better at generating new customer knowledge than at utilizing it
(Campbell, 2003), and yet, the need for customer knowledge generation and utilization is of
utmost importance in business markets and in the context of key account management (KAM).
This is because key account customers are often complex to manage and are associated with
high costs and risks (Stein, Smith, & Lancioni, 2013).
The marketing literature categorizes customer knowledge utilization (CKU) into two
knowledge types: enhancing and action-oriented (e.g. Jayachandran, Sharma, Kaufman, &
Raman, 2005). Knowledge-enhancing utilization refers to long-term oriented learning about
customers’ needs and behaviour and may not result in immediate action, whereas, the nature
of action-oriented utilization is short term and refers to knowledge utilization for resolving
customer-specific problems (Rollins et al., 2012b). However, CKU has been studied
empirically either as one-dimensional, covering both knowledge types (i.e. enhancing and
action), or modelled as separate dimensions. Regardless, overall, CKU has been found to be
positively related to customer performance as it supports systematic management of customer
relationships and value creation for customers (Rollins, Bellenger, & Johnston, 2012a;
Salojärvi & Sainio, 2010).
Various organizational processes, systems, and managerial actions affect utilization of
knowledge (Moorman, 1995). Drawing on Homburg, Workman, and Jensen (2002), the
SST proposes different KAM dimensions as drivers of CKU and provides several implications
for managers overseeing key account relationships. Specifically, it asserts that CKU can
enhanced by: increasing the level of top management involvement (TMI) in managing key
account relationships, implementing KAM teams (TEAMS), adopting customer relationship
orientation (CRO), investing in customer relationship management technologies (CRMI), and
formalizing KAM rules and procedures (FORM). While realization of factors that drive CKU
is of paramount importance, the implications suggested by the SST study may be limited. The
SST study considers individual and not combinatory effects of drivers of CKU; thus, its
findings may be oversimplified to be reflective of the strategic reality facing firms. This issue
of oversimplification raises further questions. Should managers consider investing in all of the
suggested drivers or just some of them? If only some are sufficient for high CKU, then which
ones?
In fact, recent studies on KAM show that firms use different combinations of organizational
factors in their attempt to reach desirable performance outcomes (Marcos-Cuevas, Nätti, Palo,
& Ryals, 2014). In the same vein, it appears highly likely that firms may adopt different
configurations of organizational practices in their pursuit of high CKU. Potential reasons for
different configurations may vary; such as, firms may need to take resource allocation and
trade-off decisions between which organizational factors to invest in (Le Breton-Miller &
Miller, 2015). Alternatively, firms may opt to use different configurations of drivers, depending
on what their objectives are. For instance, while firms strive to reach high levels of CKU, they
may attempt to eliminate factors that could lead to undesirable outcomes. Theory argues (e.g.,
Guesalaga, 2014) that under specific circumstances, high levels of TMI and FORM may deter
relationship quality and hinder KAM effectiveness, respectively. Whatever the underlying
reason is, the firms are likely to adopt different combinations of organizational factors.
combinations of antecedents for higher CKU levels. Thus, the present study uses the dataset of
the SST study and aims to re-examine the SST study’s hypotheses (see Figure 1) and clarify
its findings by implementing a fuzzy-set qualitative comparative analysis (fsQCA). This study
aims to highlight how different antecedents interplay or combine to predict CKU. As a
technique, fsQCA has been attracting increasing interest due to its ability to provide increased
understanding of the configurational pathways needed for reaching an outcome (Fiss, 2011).
The present study aims to contribute to prior research in multiple ways. First, the present
study provides a methodological contribution by highlighting the benefits of fsQCA technique.
The present study shows that in comparison to traditional correlation-based methods (e.g.
multiple regression analyses, MRA); fsQCA proposes a configurational perspective to
associations between independent and dependent variables. Second, this study contributes to
the prior literature on KAM and CKU by expanding the findings of SST. The main objective
of the study is to identify solutions and combinations of causes (e.g. TMI, TEAMS, CRO,
CRMI, and FORM) leading to high levels of CKU in the context of KAM. Knowledge of such
solutions serves as the starting point to understand better how predictors of CKU intertwine. In
addition, the findings of this study provide managerial implications for ensuring higher levels
of CKU.
2. Customer Knowledge Utilization: SST study
Key account customers are those that suppliers regard as strategically important based on their
attractiveness and strength of business relationship (McDonald, Millman, & Rogers, 1997). As
firms cannot afford to lose key accounts, they strive to find ways – through customized
customer service or by having in place processes to support and enhance relationships – to
provide additional value to key accounts (Gounaris & Tzempelikos, 2014). Prior studies in the
in-depth key account–related knowledge. Efficient knowledge processes facilitate
decision-making (SST). Despite its increasing strategic importance, there is little research focusing on
the intra-organizational aspects of customer knowledge processing. In order to address this gap,
the SST study draws on Homburg et al. (2002) and proposes a conceptual model in which CKU
is a central activity within the dimensions of KAM. The conceptual framework of the SST
study and associations is shown in Figure 1.
Figure 1 here
The data for the SST study consists of a cross-industrial sample of 169 firms of 200
employees and more. The sampling frame is drawn from the Amadeus database; 361 firms were
identified initially. After contacting each firm by telephone, 171 were eligible to participate.
Each firm had business-to-business sales coordinated from Finland and KAM practices in
place. A single informant approach (i.e. key account managers) was used for collecting data.
Key respondents were mainly sales managers (37%), key account managers (27%), or leaders
of business units (13%). Each respondent answered the survey from the perspective of the most
important strategic key account relationship for which he/she is personally responsible. Data
collection resulted 169 received responses from 97 companies. Multiple key informants
represented different business units and answered the questionnaire from the perspective of
different key account customers. Of a total of 395, 169 questionnaires were received (42.8%
response rate). The measurement scales were adapted from prior studies and modified to fit the
context of the SST study (see Appendix). The SST study used MRA to test hypotheses and its
findings reveal that the strongest predictor of CKU is CRMI; FORM, TEAMS, and TMI,
follow. Contrary to the authors’ expectations, the SST study fails to support the effects of CRO.
The present study re-examines the proposed relationships of the SST study using a set-theoretic
approach with fsQCA.
Conventional multivariate methods (e.g. MRA) are less able to capture complex interdependent
relationships between a set of predictors and an outcome (Fiss, 2011). Hypotheses testing that
relies on such methods cannot always be trusted. For instance, MRA follow net effect
estimations and its findings can be affected by the existence of high multicollinearity
(Skarmeas, Leonidou, & Saridakis, 2014). Even when researchers control for high
multicollinearity, net effects may change direction and level of significance when additional
predictors are added in the equation (Armstrong, 2012). Furthermore, in a given dataset, some
cases may not always support an exclusive positive or a negative association between the
predictor and outcome variables (Woodside, 2013).
In addition, MRA make assumptions of the following characteristics among associations:
(a) symmetry – that is, low (high) degrees of the independent variable always correspond to
low (high) degrees of the dependent variable; and (b) linearity – that is, an increase
(decrease) in an independent variable will result in a corresponding increase (decrease) in
the dependent variable (Skarmeas et al., 2014). However, in reality, relationships could be
asymmetric and non-linear. Scholars (e.g. Armstrong, 2012) demonstrate that most observed
relationships are in fact non-linear. Ragin (2000, 2008) argues that high degrees of the
dependent variable may also occur when the independent variable display low values.
By contrast, fsQCA is uniquely suitable for exploring intertwined relationships between
multiple predictors. In effect, fsQCA is an analysis of sets of relationships among causes.
Contrary to MRA, fsQCA models the concept of conjunctural causation. In other words, it
allows a detailed analysis of how alternative conditions of causes combine and contribute to
high membership scores of the outcome (Rihoux & Ragin, 2009). Instead of one predictor
condition alone, fsQCA may detect multiple solution paths that can lead to high levels of the
same outcome. Thus, it fully captures the concept of equifinality (Katz & Kahn, 1978). The
not be enough) and sufficient (i.e. those that always lead to the outcome) conditions and
combinations that are associated with high degrees of the outcome (Ragin, 2000, 2008).
4. The fsQCA procedure
This section outlines how fsQCA proceeds in four steps: (1) calibration of data; (2) construction
of a truth table; (3) identification of relevant causal combinations; and (4) simplification of
combinations and assessment of solutions.
4.1. Calibration of data
The first step in performing a fsQCA is calibrating all variables involved into sets. Unlike
conventional techniques that treat all variance as equal, data calibration aims to identify
meaningful groupings of cases (Crilly, 2011). Sets represent the degree of membership that a
particular variable (e.g. a predictor) takes in a specific category; sets may take any value
between 0 and 1 (Woodside & Zhang, 2013). Variables in the dataset can be calibrated to either
crisp sets (i.e. the membership of a variable in the category is binary: 0 for non-membership
and 1 for membership) or fuzzy sets (i.e. variables take varying degrees of memberships from
0 to 1) (Skarmeas et al., 2014). Fuzzy set analysis usually uses three threshold breakpoints for
set calibration: 0.05 for full non-membership, 0.50 as the crossover point of maximum
ambiguity, and 0.95 for full membership (Ragin, 2008).
4.2. Construction of the truth table
The second step comprises the construction of the truth table to identify causal combinations
of predictors with the outcome (Crilly, 2011). The truth table has 2k rows, where k is the number of causal conditions used in the analysis. Rows on the truth table are associated with specific
combinations (Ragin, 2008). The dataset cases are sorted into rows according to the values they
display on these cause variables; it is expected that some rows may have many cases, some
rows may have a few cases, and other rows no cases whatsoever (Fiss, 2011).
4.3. Identification of relevant causal combinations
The next step involves identifying relevant combinations that are associated with at least one
observation between the predictors and outcome. The number of rows of the truth table are
reduced on the basis of (a) minimum number of cases needed for a solution to be deliberated
and (b) minimum consistency level needed for a particular solution (Ragin, 2000). Consistency
represents the “degree to which a combination of causal conditions is reliably associated with
the outcome” (Crilly, 2011, p. 705). Consistency ranges from 0 to 1; it should be close to 1 to
enable inferences that a subset relationship exists, indicating that all cases (when consistency
= 1) sharing a condition also share the outcome (Greckhamer, 2011). In other words,
consistency indicates whether the derived solution as a whole and separate pathways are indeed
subsets of the outcome (Ragin, 2008).
4.4. Simplification of combinations and assessment of solutions
According to Fiss (2011, p. 402), fsQCA uses Boolean algebra and algorithms that allow a
“logical reduction of numerous, causal conditions into a reduced set of configurations that lead
to the outcome”. The truth table algorithm generates a range of plausible solutions; to speculate
about these, the algorithm uses counterfactual analysis (Fiss, 2011), which allows
classifications of core and peripheral connections between causes and the outcome (Ragin,
2008). Core refer to the essential causes that have a strong causal relationship with the outcome
of interest, whereas peripheral are more expendable or exchangeable, as they reveal a weaker
Distinguishing between easy and difficult counterfactuals, fsQCA provides three types of
solutions: complex, intermediate, and parsimonious (Rihoux & Ragin, 2009). Each solution
provides pathways for high membership of the outcome of interest (Skarmeas et al., 2014). A
complex solution reflects only the empirically observed combinations of causal conditions; the
remainders (i.e. those lacking empirical instances) are omitted from the reduction process
(Schneider, Schulze-Bentrop, & Paunescu, 2010). An intermediate solution distinguishes
between easy and difficult counterfactuals and integrates only simplifying assumptions of easy
cases (Greckhamer, 2011). An intermediate solution results in both core and peripheral
conditions (Crilly, 2011). The parsimonious solution is the simplest; it contains only core
conditions and takes into consideration a number of simplifying assumptions, regardless
whether they are based on easy or difficult counterfactuals (Fiss, 2011).
The derived solutions of fsQCA are assessed on the basis of two measures: consistency and
coverage. Adequate consistency is a precondition for examining set-theoretic coverage. A
consistency threshold of at least 0.75 and up to 0.95 is recommended (Ragin, 2008).
Researchers may choose a consistency threshold by observing the distribution scores of
consistency and selecting the one that corresponds to a gap (Schneider et al., 2010). In the final
solution, researchers should retain all the combinations of causes that demonstrate values above
the selected consistency threshold point. Apart from consistency measures, coverage statistics
are used to interpret fsQCA findings (Ragin, 2008). Coverage gauges the empirical importance
of solutions for reaching the outcome of interest; specifically, it demonstrates how much of the
outcome is explained by the solution as a whole and by each solution pathway separately
(Skarmeas et al., 2014). A model solution is perceived as explanatory when coverage is
between 0.25 and 0.65 (Rihoux & Ragin, 2009). The higher the consistency threshold chosen,
5. Results
5.1. Analysis of results
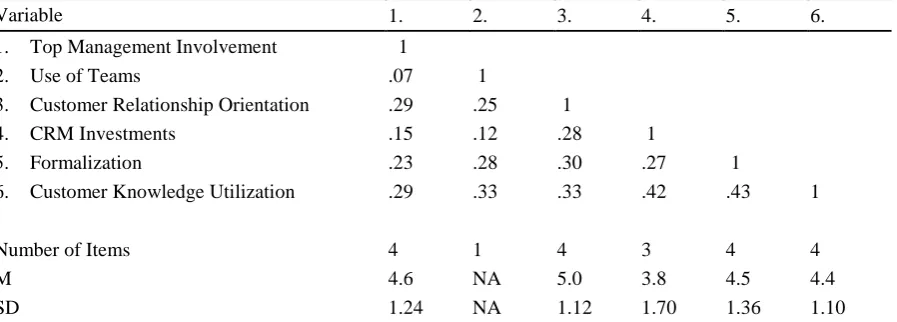
Table 1 depicts construct correlations and key descriptive statistics. Correlations among
constructs are below the recommended threshold of 0.60 (see Hair, Black, Babin, Anderson, &
Tatham, 2006), which indicates that the associations between constructs are asymmetric.
Evidently, asymmetry implies the existence of alternative conditions and combinations of
predictors that may lead to the same outcome (Woodside, 2013). Thus, there is a need for
alternative analytical methods to examine such effects.
Table 1 here
Prior to implementing fsQCA, all cases in the dataset (i.e. N = 169) were calibrated into
fuzzy-sets. The three recommended threshold breakpoints (i.e. 0.95, 0.50, and 0.05) were used
for set calibration. The truth table was then constructed, with 25 possible combinations for high degrees of CKU; the rows of the truth table were reduced by applying a consistency threshold
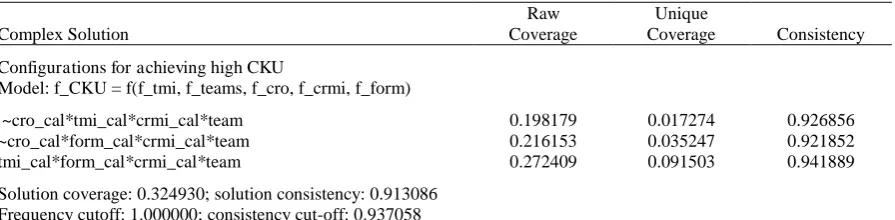
of 0.937. Table 2 shows the derived alternative solutions for high membership of CKU. For the
purposes of this study, it is appropriate to use complex solutions, as they make no particular
assumptions and include neither easy nor difficult counterfactuals (Elliott, 2013).
Table 2 here
The fsQCA demonstrate three solution pathways that lead to high membership of CKU. The
solution as a whole reveals acceptable consistency (i.e. ≥ .80) and explains a satisfactory
number of cases in high CKU (i.e. ≥ .25 coverage ≤ .65). The first pathway indicates that the
use of TEAMS, high levels of CRMI and TMI, and low levels of CRO leads to high degrees
of CKU. The second pathway indicates that a combination of TEAMS, high levels of CRMI
pathway indicates that a combination of TEAMS with high levels of CRMI, FORM, and TMI
lead to high degrees of CKU.
The fsQCA findings demonstrate core and peripheral conditions that lead to high CKU
memberships. The use of TEAMS and high CRMI are necessary – although not sufficient on
their own – conditions to obtain high levels of CKU. On the other hand, CRO, TMI, and FORM
are peripheral for reaching the same outcome. Specifically, high levels of FORM and TMI and
low levels of CRO appear in two of three pathways. This finding implies that TEAMS and high
levels of CRMI need to co-exist with different combinations and levels (i.e. high/low) of
FORM, TMI, and CRO. The following subsection discusses these findings.
5.2. Interpretation of results
The original SST study suggests that managers should consider allocating resources to TMI,
TEAMS, CRMI, and FORM for generating desirable levels of CKU. However, in modern
business environments, managers are often challenged to choose between different alternatives
scenarios and make decisions about where scarce resources should be allocated. This study
uses fsQCA to understand further the findings of the SST and seeks to deepen current
understanding of how different conditions intertwine to lead to higher levels of CKU. The
strength of the fsQCA technique is that it examines and provides complex causal combinations
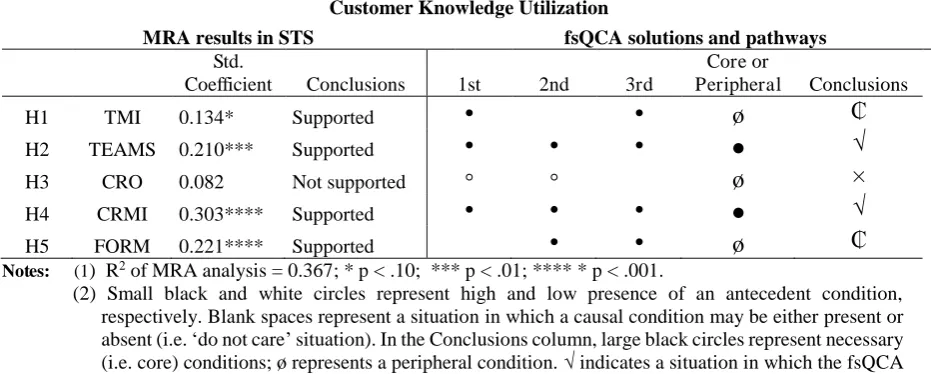
of predictors that lead to high levels of the same outcome. Table 3 draws a comparison between
the MRA results of the original SST study and the fsQCA findings of the present study.
Table 3 here
The main conclusion from the fsQCA analysis is that TEAMS and high levels of CRMI are
core conditions for ensuring high levels of CKU. The existence and deployment of teams that
manage key accounts and investments in CRM systems are essential. TEAMS serve as an
& Smith, 2005). This mechanism works through efficient knowledge sharing among team
members (Geiger & Turley, 2005). Furthermore, TEAMS offer a forum for discussing
customer-specific issues (Nätti et al., 2006). On the other hand, use of TEAMS ensures
discussion of customer-related issues, and CRM systems provide the needed customer-specific
knowledge for these discussions. The more available knowledge there is, the more it is actually
used. Thus, the fact that both TEAMS and high CRMI are core conditions for high degrees of
CKU imply that both are needed, so that there is a large base of customer-specific knowledge
available in the CRM systems and this knowledge is discussed within KAM teams. These
findings are consistent with the SST study (i.e. original H2 and H4).
However, the fsQCA findings suggest that while teams and CRMI are necessary conditions
for high levels of CKU, their existence alone is not sufficient for high CKU. The original SST
study found TMI (i.e. original H1) and FORM (i.e. original H5) are significant predictors of
CKU, whereas the effect of CRO (i.e. original H3) is not supported. However, the individual
pathways of the derived fsQCA solutions provide partial support for the effects of TMI and
FORM; in addition, it appears that CRO is not entirely irrelevant to CKU. This part of the
fsQCA findings expands current understanding of the factors that lead to high CKU.
In addition to core conditions, the first two pathways include low levels of CRO as a
peripheral condition for high levels of CKU. In the first pathway, low levels of CRO are
combined with high levels of TMI; in the second pathway, low levels of CRO are combined
with high levels of FORM. This finding suggests that under certain conditions, CRO may
actually be harmful for the achievement of high levels of CKU. The first pathway, in which
CRMI and TEAMS are accompanied with high levels of TMI and low levels of CRO, illustrates
one such condition. Guesalaga (2014) notes that high levels of TMI may under certain
circumstances deter relationship quality, which in turn creates conflict in KAM teams with
pathway, in which CRMI and TEAMS are accompanied with low CRO and high levels of
FORM, illustrates another case of conditions that may harm CKU. FORM may impede
flexibility and thereby limit a firm’s ability to give special attention to key accounts, which
again may create conflict in KAM teams showing high levels of CRO; consequently, this may
prevent CKU.
Even though levels of FORM and TMI often go hand in hand in KAM organizations (see
Homburg et al., 2002), sometimes companies may need to choose between one of these two
approaches to maximize CKU. Firms may adopt the second pathway (e.g. high levels of FORM
and varying levels of TMI) for higher CKU levels, if top management do not have sufficient
time to be involved in all relationships with key account customers or when intensive
involvement may have negative consequences. According to Homburg et al. (2002), this
configuration is referred to as operating-level KAM. Alternatively, firms may adopt the first
pathway (e.g. high levels of TMI and varying levels of FORM) if key account coordinators are
locally based (i.e. isolated KAM in the taxonomy of Homburg et al., 2002).
The third pathway suggests that for high levels of CKU, the use of teams and high levels of
CRMI need to be accompanied with high levels of both TMI and FORM. In this pathway, the
level of CRO is irrelevant. Examples in Homburg et al.’s (2002) taxonomy include
top-management and cross-functional, dominant KAM. This finding implies that the best way to
achieve high levels of CKU is to use highly formalized KAM programs with high levels of top
management support, together with TEAMS and high levels of CRMI.
7. Conclusions and future research directions
This study assesses configurations of causes for high CKU, using empirical data from the SST
study. Three solution pathways are identified. The first conclusion that can be drawn from the
firms should invest in CRM technologies and assign teams of experts for managing key
accounts. The second conclusion reflects the differences identified between the three solutions.
The first two pathways suggest that firms can achieve high levels of CKU even when they lack
a company-wide CRO; in these cases, managers need to accompany CRMI and TEAMS with
high levels of either TMI or FORM. Interestingly, the third pathway describes a configuration
in which firms accompany CRMI and TEAMS with both TMI and FORM. These pathways are
examples of firms that have made trade-off decisions between TMI and FORM.
The findings of the present study open up several interesting directions for future research.
First, since firms can reach high levels of CKU with different configurations of causes, there
is a need to understand the underlying logic of resource allocation for each solution pathway.
Second, if there are potential suboptimal consequences of causes (e.g. FORM or TMI), it is
possible that the path with which CKU is created dictates its performance implications. It is
reasonable to argue that CKU is not a firm’s final goal but rather a means to an end, such as
key customer performance (see Salojärvi & Sainio, 2010). Thus, the future research should
examine how the pathway with which firms have created CKU impacts account performance
outcomes.
References
Armstrong, J. (2012). Illusions in regression analysis. Int. J. Forecast., 28(3), 689–694.
Campbell, A. J. (2003). Creating customer knowledge competence: Managing customer
relationship management programs strategically. Ind. Mark. Manag., 32(5), 375–383.
Crilly, D. (2011). Predicting stakeholder orientation in the multinational enterprise: A
mid-range theory. J. Int. Bus. Stud., 42(5), 694–717.
Elliott, T. (2013). Fuzzy set qualitative comparative analysis: An introduction. Research notes,
Fiss, P. C. (2011). Building better causal theories: A fuzzy set approach to typologies in
organization research. Acad. Manag. J., 54(2), 393–420.
Geiger, S., & Turley, D. (2005). Personal selling as a knowledge-based activity: Communities
of practice in the sales force. Irish J. of Manag., 26(1), 61-70.
Gounaris, S., & Tzempelikos, N. (2014). Relational key account management: Building key
account management effectiveness through structural reformations and relationship
management skills. Ind. Mark. Manag., 43(7), 1110–1123.
Greckhamer, T. (2011). Cross-cultural differences in compensation level and inequality across
occupations: A set-theoretic analysis. Organ. Stud., 32(1), 85–115.
Guesalaga, R. (2014). Top management involvement with key accounts: The concept, its
dimensions, and strategic outcomes. Ind. Mark. Manag., 43(7), 1146–1156.
Hair, F. J., Black, C. W., Babin, J. B., Anderson, E. R., & Tatham, L. R. (2006), Multivariate
data analysis. (6th ed.). New Jersey: Pearson Education.
Homburg, C., Workman, J. P. Jr., & Jensen, O. (2002). A configurational perspective on key
account management. J. Mark., 66(2), 38–60.
Jayachandran, S., Sharma, S, Kaufman, P., & Raman, P. (2005) The role of relational
information processes and technology use in customer relationship management. J.
Mark., 69(4), 177–192.
Joshi, A. W., & Sharma, S. (2004). Customer knowledge development: Antecedents and impact
on new product performance. J. Mark., 68(4), 47–59.
Katz, D., & Kahn, R. L. (1978). The social psychology of organizations. (2nd ed.). New York:
Wiley.
Katzenbach, J. R., & Smith, D. K. (2005). The discipline of teams. Harvard Bus. Rev., 83(7/8),
Le Breton-Miller, I. & Miller, D. (2015). The paradox of resource vulnerability: Considerations
for organizational curatorship. Strat. Manag. J., 36(3), 397–415.
Marcos-Cuevas, J., Nätti, S., Palo, T., & Ryals, L. J. (2014). Implementing key account
management: Intraorganizational practices and associated dilemmas. Ind. Mark.
Manag., 43(7), 1216–1224.
McDonald, M., Millman, T., & Rogers, B. (1997). Key account management: Theory, practice
and challenges. J. Mark. Manag., 13(8), 737–757.
Moorman, C. (1995). Organizational market information processes: Cultural antecedents and
new product outcomes. J. Mar. Res., 32(3), 318-335.
Nätti, S., Halinen, A. & Hanttu, N. (2006). Customer knowledge transfer and key account
management in professional service organizations. Int. J. Serv. Ind. Manag., 17(4),
304-319.
Ragin, C. C. (2000). Fuzzy-set social science. Chicago: University of Chicago Press.
Ragin, C. C. (2008). Redesigning social inquiry: Fuzzy sets and beyond. Chicago: University
of Chicago Press.
Rihoux, B., & Ragin, C. C. (2009). Configurational comparative methods: Qualitative
comparative analysis (QCA) and related techniques. Thousand Oaks, CA: Sage.
Rollins, M., Bellenger, D. N., & Johnston, W. J. (2012a). Does customer information usage
improve a firm’s performance in business-to-business markets? Ind. Mark. Manag.,
41(6), 984–994.
Rollins, M., Bellenger, D. N., & Johnston, W. J. (2012b). Customer information utilization in
business-to-business markets: Muddling through process? J. Bus. Res., 65(6), 758–764.
Salojärvi, H., & Sainio, L. M. (2010). Customer knowledge processing and key account
Salojärvi, H., Sainio, L. M., & Tarkiainen, A. (2010). Organizational factors enhancing
customer knowledge utilization in the management of key account relationships. Ind.
Mark. Manag., 39(8), 1395–1402.
Schneider, M. R., Schulze-Bentrop, C., & Paunescu, M. (2010). Mapping the institutional
capital of high-tech firms: A fuzzy-set analysis of capitalist variety and export
performance. J. Int. Bus. Stud., 41(2), 246–266.
Shi, L. H, Zou, S., White, J. C., McNally, R. C., & Cavusgil, T. (2005). Executive insights:
Global account management capability: Insights from leading suppliers. J. Int. Mark.,
13(2), 3–113.
Skarmeas, D., Leonidou, C. N., & Saridakis, C., (2014). Examining the role of CSR skepticism
using fuzzy-set qualitative comparative analysis. J. Bus. Res., 67(9), 1796–1805.
Stein, A. D., Smith, M. F., & Lancioni, R. A. (2013). The development and diffusion of
customer relationship management (CRM) intelligence in business-to-business
environment. Ind. Mark. Manag., 42(6), 855–861.
Woodside, A. G. (2013). Moving beyond multiple regression analysis to algorithms: Calling
for adoption of a paradigm shift from symmetric to asymmetric thinking in data analysis
and crafting theory. J. Bus. Res., 66(4), 463–472.
Woodside, A. G., & Zhang, M. (2013). Cultural diversity and marketing transactions: Are
market integration, large community size, and world religions necessary for fairness in
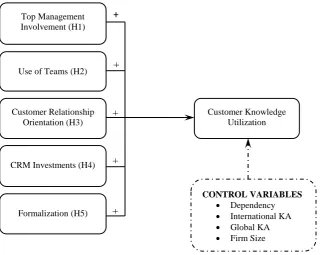
Note: H1: Top management involvement is positively related to CKU; H2: The use of teams is positively related to CKU; H3: Customer relationship orientation is positively related to CKU; H4: Investment in CRM technology is positively related
[image:20.595.73.395.333.588.2]to CKU; H5: Key account management formalization is positively related to CKU.
Figure 1. Conceptual framework and hypotheses of the SST study +
+ + + +
Customer Relationship Orientation (H3)
CRM Investments (H4)
Customer Knowledge Utilization Top Management
Involvement (H1)
Use of Teams (H2)
Formalization (H5)
CONTROL VARIABLES
Dependency
International KA
Global KA
Table 1. Correlation matrix and summary statistics
Variable 1. 2. 3. 4. 5. 6.
1. Top Management Involvement 1
2. Use of Teams .07 1
3. Customer Relationship Orientation .29 .25 1
4. CRM Investments .15 .12 .28 1
5. Formalization .23 .28 .30 .27 1
6. Customer Knowledge Utilization .29 .33 .33 .42 .43 1
Number of Items 4 1 4 3 4 4
M 4.6 NA 5.0 3.8 4.5 4.4
SD 1.24 NA 1.12 1.70 1.36 1.10
Notes: (1) Sample size = 169.
(2) Correlations greater than |± .23| are significant at the p < .001 level.
Table 2. Complex solutions for high CKU
Complex Solution
Raw Coverage
Unique
Coverage Consistency Configurations for achieving high CKU
Model: f_CKU = f(f_tmi, f_teams, f_cro, f_crmi, f_form)
~cro_cal*tmi_cal*crmi_cal*team 0.198179 0.017274 0.926856
~cro_cal*form_cal*crmi_cal*team 0.216153 0.035247 0.921852
tmi_cal*form_cal*crmi_cal*team 0.272409 0.091503 0.941889
Solution coverage: 0.324930; solution consistency: 0.913086 Frequency cutoff: 1.000000; consistency cut-off: 0.937058
Note: tmi = top management involvement; teams = use of KAM teams; cro = customer relationship orientation; crmi =
Table 3. Comparison of SST’s MRA with fsQCA findings
Customer Knowledge Utilization
MRA results in STS fsQCA solutions and pathways
Std.
Coefficient Conclusions 1st 2nd 3rd
Core or
Peripheral Conclusions
H1 TMI 0.134* Supported
•
•
øH2 TEAMS 0.210*** Supported
•
•
•
√H3 CRO 0.082 Not supported ø ×
H4 CRMI 0.303**** Supported
•
•
•
√H5 FORM 0.221**** Supported
•
•
øNotes: (1) R2 of MRA analysis = 0.367; * p < .10; *** p < .01; **** * p < .001.
Appendix: Measurement Development
Scales Std.
Loadings
Customer relationship orientation ( = 0.82)
The people involved in the management of the key account relationship….
are willing to put extra effort beyond expected to make key account management successful 0.833 consider retaining the key account relationship as their top priority 0.854
consider the key account relationship as a valuable asset 0.798
Top management involvement ( = 0.74)
Top management often deals with the management of the key account relationship 0.848
Top management have close relationships with the key account’s top management 0.790
Top management encourages employees to pay special attention to the key account relationship 0.669 The key account manager is often left alone when key account-related decisions need to be made 0.605
Formalization ( = 0.80)
To coordinate parts of our organization working with key accounts, standard operating procedures have been established
0.825
We have put a lot of effort into developing guidelines for working with our key accounts 0.774 Within our organization, formal internal communication channels are followed when working on
key accounts
0.725
We have established criteria for selecting key accounts 0.774
CRM investment ( = 0.80)
We have invested in technology to acquire and manage ‘real time’ customer-related information 0.863
We have dedicated CRM technology in place for analysing customer information 0.858
Our CRM technology does not meet our needs 0.763
Customer knowledge utilization ( = 0.84)
We constantly assess our key account relationship strategy with the help of new key account-related knowledge
0.830
We regularly assess our sales processes to ensure it meets the key account’s expectations 0.798 We exploit key account-related knowledge actively in developing new value-added solutions for
the key account
0.781
We continually exploit the key account-related knowledge when assessing our successes and failures in managing the key account relationship