This is a repository copy of
Physical model tests and numerical simulation for assessing
the stability of brick-lined tunnels
.
White Rose Research Online URL for this paper:
http://eprints.whiterose.ac.uk/123926/
Version: Accepted Version
Article:
Chen, H-M, Yu, H-S and Smith, MJ (2016) Physical model tests and numerical simulation
for assessing the stability of brick-lined tunnels. Tunnelling and Underground Space
Technology, 53. pp. 109-119. ISSN 0886-7798
https://doi.org/10.1016/j.tust.2016.01.016
© 2016, Elsevier. Licensed under the Creative Commons
Attribution-NonCommercial-NoDerivatives 4.0 International
http://creativecommons.org/licenses/by-nc-nd/4.0/
[email protected] https://eprints.whiterose.ac.uk/
Reuse
Unless indicated otherwise, fulltext items are protected by copyright with all rights reserved. The copyright exception in section 29 of the Copyright, Designs and Patents Act 1988 allows the making of a single copy solely for the purpose of non-commercial research or private study within the limits of fair dealing. The publisher or other rights-holder may allow further reproduction and re-use of this version - refer to the White Rose Research Online record for this item. Where records identify the publisher as the copyright holder, users can verify any specific terms of use on the publisher’s website.
Takedown
If you consider content in White Rose Research Online to be in breach of UK law, please notify us by
Physical model tests and numerical simulation for
assessing the stability of tunnels
Han-Mei Chena,*, Hai-Sui Yua, Martin J. Smithb
aNottingham Centre for Geomechanics, The University of Nottingham, NG7 2RD, UK
bNottingham Geospatial Institute, The University of Nottingham, NG7 2TU, UK
*Corresponding author. Tel.: +44 (0) 191 208 8657
E-address: [email protected] (H-M Chen), [email protected] (H-S Yu),
[email protected] (M. Smith)
Abstract
Nowadays, numerical modelling is increasingly used to assess the stability of
tunnels and underground caverns. However, an analysis of the mechanical
behaviour of existing brick-lined tunnels remains challenging due to the complex
material components. In order to study the mechanical behaviour of the masonry
in brick-lined tunnels, this paper proposes a series of small scale physical tunnel
model tests to represent the true behaviour of a real tunnel under extreme loading.
Advanced monitoring techniques of laser scanning and photogrammetry are used
to record tunnel deformation and lining defects. This investigation shows how
these techniques may substitute or supplement the conventional monitoring
procedures. Simultaneously, the corresponding numerical models of these small
scale physical models have been developed using FLAC and UDEC software and
verified by the experimental results to assess the overall stability of these tunnels.
Predictions using numerical models under various conditions have also been
carried out to show the mechanical behaviour of a masonry tunnel and to quantify
the influence of the surrounding and loading conditions.
KEYWORDS: Physical models, Numerical simulation, Tunnel Stability,
1 INTRODUCTION
Most old tunnels in UK were built decades ago; some are even over a
hundred years old. These ageing infrastructures pose significant risk to safety and
the efficiency of communication and utilities which can directly impact on the
economy. Tunnels are usually lined with bricks or stones which may suffer from
material degradation and changing loading conditions after many years of service.
Reliable assessment of stability of such tunnels is important for designing
maintenance and refurbishment measures.
However, quantitative safety assessment is very difficult to undertake since
many factors are unknown, for example the behaviour of construction materials
and the underground conditions. Although several numerical models have been
proposed to study the structural behaviour of masonry infrastructure, for example
old tunnel masonry structures (Idris et al., 2008 and 2009), masonry bridges (Betti
et al., 2008), and masonry structures (Giordano et al., 2002; Lourenço, 1996, 1998;
Sutcliffe, 2003; Valluzzi et al., 2005), the modelling and the mechanical behaviour
analysis of existing brick-lined tunnels remains challenging due to the complex
material components. The engineering practice of tunnel refurbishment is still
largely dominated by ad-hoc stabilizing measures based on experience. Tunnel
monitoring has predominantly been a manual process, which is time-consuming
and subjective, giving rise to variance in the standards and quality of examination.
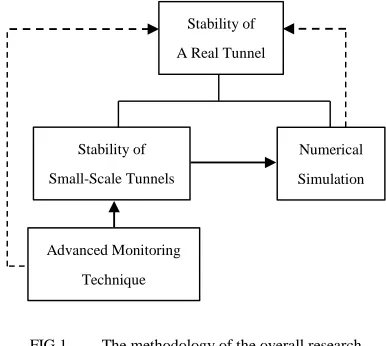
To develop an understanding at the performance of brick-lined tunnels, the
overall aim of this research is to develop a numerical approach for the modelling
of a series of small scale physical model tunnels under extreme loading. The
deformation of the brick-lined tunnels is assessed through both the physical test
models and the numerical modelling.
During the physical model tests, advanced monitoring techniques of laser
scanning and photogrammetry are used to record tunnel deformation and lining
defects, which may substitute or supplement the conventional manual procedures.
This is explained in Chen et al. (2013), Chen (2014), and Chen et al. (2014). The
numerical models are developed to simulate the corresponding physical models.
These numerical models and advanced monitoring techniques then have the
potential to be applied to field studies to enable accurate prediction of the actual
These physical model tests are not required to closely replicate the real tunnel
behaviour with its many and varied conditions, but should provide similar
boundary and loading conditions, which can be controlled and measured.
FIG 1. The methodology of the overall research
2 PHYSICAL MODEL PREPARATION AND TEST SETUP
2.1 Brief introduction
Physical model testing in the laboratory is an invaluable procedure in
masonry research to demonstrate the performance of real masonry structures. It is
often advisable to undertake the testing of small scale physical models prior to
field studies for safety and economic reasons.
In this study a series of small scale physical tunnel models were built up in
the laboratory to assess the stability of brick-lined railway tunnels and their
mechanical behaviours under controlled conditions. In order to simulate the
behaviour of both deep seated (e.g. mountain tunnels) and shallow tunnels
affected by traffic load, the physical model tests were subjected to static uniform
and concentrated load applied to the surface of the overburden soil.
2.2 Test variations
For the first physical model, a comparatively higher strength mortar mix
Stability of A Real Tunnel
Stability of Small-Scale Tunnels
Numerical Simulation
[image:4.451.128.321.135.308.2]physical model, a mortar mix proportion of lower strength (1:2:9) was used. Table
I shows the different combinations of variables investigated for the three physical
model tests conducted.
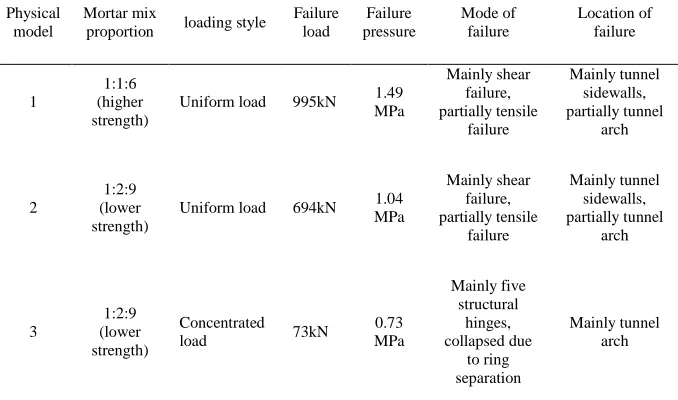
TABLE I. LOADING OUTPUTS FROM THREE PHYSICAL MODELS
2.3 Model constructions
All the physical models investigated in this study followed an identical
process to ensure consistency and comparability. The key elements of the
construction process were the brickwork liner, rigid box, plastic sheeting, and
surrounding soil.
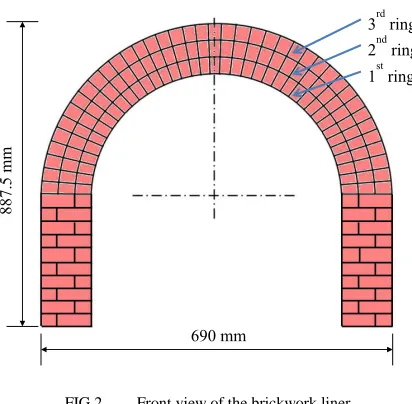
Bricks used in constructing the physical models in this investigation were
half the size of a ‘Mellowed red stock brick’ and had dimensions of 107.5 × 51.25
× 32.5 mm (L × W × H). Each brick was separated by a 5 mm mortar joint. As
shown in Fig. 2, the tunnel’s brick lining consists of three layers of bricks situated
at the arched region. The sidewalls, on the other hand comprise one and a half
bricks juxtaposed to each other but layered alternately. For consistency this
research utilised the stretcher bond along the longitudinal direction of the entire
tunnel.
Test number Mortar mix proportion loading style
Physical model test 1 1:1:6 (higher strength) Uniform load
Physical model test 2 1:2:9 (lower strength) Uniform load
FIG 2. Front view of the brickwork liner
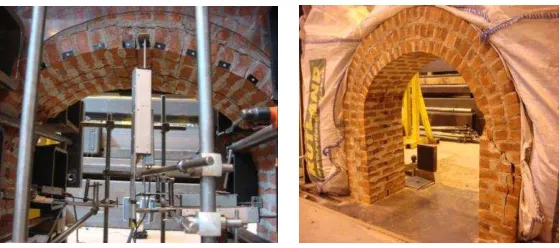
A rigid support fashioned mainly from wood was utilised to support the soil
surrounding the brick liner and to behave like a boundary restriction. The support
was in the form of a box with the exposed faces of the second and the third ring of
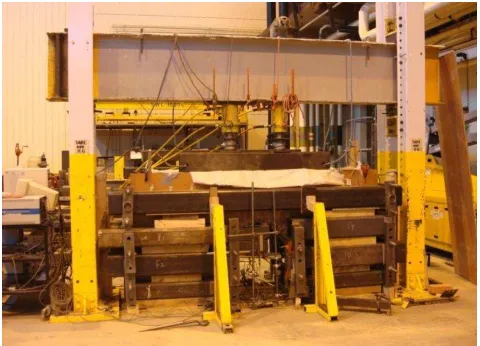
the brickwork tunnel covered with Perspex. After a full analysis of potential loads,
deflections and factors of safety, a set of hot finished square and rectangular
hollow section steel beams were designed and bolted at the front and back of the
box to increase its stiffness, see Fig. 3.
To avoid the surrounding soil slipping out of the box, the tunnel was covered
with plastic sheeting all around the rigid box. Moreover, plastic sheeting played an
important role in reducing the friction between the soil and the box during loading.
Portaway sand was used as the soil and compacted in layers. The surrounding
soil density of 1832 kg/m3 and the depth of 1075 mm from the tunnel toe was kept
the same for all physical model tests.
In addition to the advanced measurement techniques, potentiometers were
used to provide a reference for monitoring of the deformation of the tunnel. rd
ring
1st ring
nd
ring
0 mm
7.
5
m
[image:6.451.122.328.77.279.2]FIG 3. Loading system installation for uniform load
3 TEST RESULTS OF THE FIRST AND THE SECOND MODELS UNDER UNIFORM LOAD
Results from the mechanical testing of the first and second physical models
were compared to ascertain the relative effects of the different mortar mix
proportions used in the construction of their brick linings. The data obtained
proved useful for establishing typical behavioural characteristics for a uniformly
loaded tunnel and determining specific tunnel failure criterion. Furthermore, the
outputs of the mechanical tests acted as a benchmark for the numerical validation.
3.1 Ultimate load capacity and tunnel mode of failure
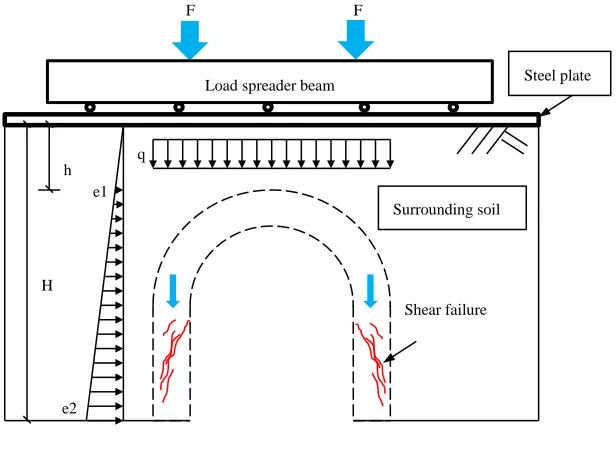
Fig. 4 demonstrates the transmitting path of the uniform load from the steel
plate on top of the overburden soil to the tunnel. In this figure, H is the soil depth
from the surface to the tunnel’s toe, h is the soil depth above the tunnel crown, q is
the uniformly distributed load acting on the tunnel arch and e is the horizontal
stress acting on the tunnel, from the top to the bottom of the tunnel (e1 to e2). By
virtue of its shape, the uniformly distributed load on the arch of the tunnel caused
the tunnel to act as a monolith thereby forcing the applied load to be transmitted to
the sidewalls, initiating the shear failure on the tunnel sidewalls as the primary
[image:7.451.116.356.83.256.2]shear failure caused diagonal cracks among the sidewalls and excessive
deformations, and finally the collapse of the tunnel.
FIG 4. Tunnel model of failure under uniform load
The first physical model failed at a load of 995 kN when the tunnel could no
longer support the load. The major shear failure was observed on the two
sidewalls together with evidence of minor tensile failure on the tunnel’s crown. A
similar failure mode was observed in the second physical model test, the model’s
ultimate load at failure was found to be 69.7% of that of the firstmodel as shown
in Table II. The result is consistent with the comparatively higher compressive
strength of the brickwork in the first physical model. It also suggests a correlation
between compressive strength of constituent brickwork and the tunnels’ ultimate
load capacities, in that the tunnel comprising higher strength brickwork failed later
than its counterpart when both were subject to identical load regimes. The result is
also consistent with previous research by Hogg (1997), that the first physical
model could withstand a larger uniform load than the second physical model,
possibly because it comprised brickwork of higher compressive strength.
Steel plate F
F
Surrounding soil e1
e2
q
H h
Load spreader beam
[image:8.451.72.380.123.349.2]
3.2 Deflection behaviour
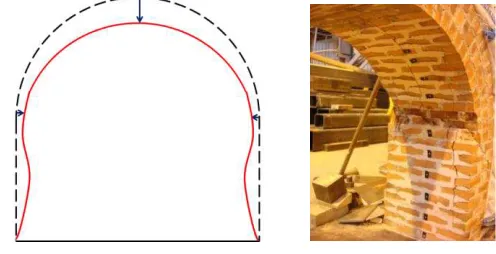
The observed deformation pattern of the tunnel under uniform load can be
represented as shown by Fig. 5 (a). It shows that it generally deforms inwards with
the tunnel arch transferring the imposed uniform load downwards to the sidewalls,
resulting in a crushing phenomenon near the springing, see Fig. 5 (b).
FIG 5. (a) Deformation tendency of the tunnel; (b) Crushing phenomenon at the arch springing
The pressure-crown deflection relationship observed from the two models is
shown in Fig. 6 (a) revealing similar arch structural stiffness of the two models. It
suggests that the stiffness (Young’s modulus) of the brickwork does not have
significant effect on brick-lined tunnels. However, the first physical model test
with comparatively stronger ultimate load capacity corresponded with more
deformation (62.3 mm) at failure, while the crown displacement at failure of the
second physical model test was 67.6% of that of the former test.
It is observed from Fig. 6 (b) that the springing structural stiffness of the
second physical model reduced to around 3/4 of that of the first physical model. It
indicated that the brickwork stiffness of the second model had a great influence on
the springing structural stiffness when the lateral load from the surrounding soil
was parallel to the bed joints (horizontal joint in masonry). The smaller
development of the springing deformation at the same load level in the first
physical model test implied that the springing of the tunnel arch connected to the
sidewall started to crush early than in the second physical model test, which
[image:9.451.107.355.170.297.2]FIG 6. (a) Pressure-crown displacement curves under uniform load; (b) Pressure springing
displacement curves under uniform load
3.3 Cracking behaviour
Initial radial and stepped cracking was observed in the outwardly facing
mortar joints of the first, second and third arch rings during the process of loading.
These were noted to occur at 59% (594 kN) and 56% (392 kN) of the total loading
regime for the first and the second physical models respectively. As the loading
progressed, the cracks were noted to propagate at the intrados of the tunnel arch
(i.e. the inner surface of the tunnel arch). Subsequently, there was an increase in
growth of radial cracking at the intrados of the tunnel arch, see Fig. 7 (a).
Additionally, the onset of diagonal cracking cutting through the two tunnel
sidewalls and leading to imminent shear failure was evidenced by Fig. 7 (b).
FIG 7. (a) Crack failure under uniform load; (b) Shear failure at sidewalls
0 0.2 0.4 0.6 0.8 1 1.2 1.4 1.6
0 20 40 60 80
P re ss u re ( M P a)
Crown displacement (mm) Physical model test 1 Physical model test 2
0 0.2 0.4 0.6 0.8 1 1.2 1.4 1.6
0 5 10 15 20
P re ss u re ( M P a)
Springing displacement (mm) Physical model test 1
[image:10.451.64.389.96.207.2] [image:10.451.86.366.432.556.2]4 TEST RESULTS OF THE THIRD MODEL UNDER CONCENTRATED LOAD
The third physical model was subjected to concentrated loading above the
centre of the tunnel crown. The mortar of the same mix proportion (1:2:9) as the
second physical model was used in the construction of the third physical model.
Consequently, it was possible to compare the mechanical behaviour of tunnel
structures subjected to two different load types i.e. the second physical model
under uniform load and the third physical model under concentrated load.
4.1 Ultimate capacity and tunnel mode of failure
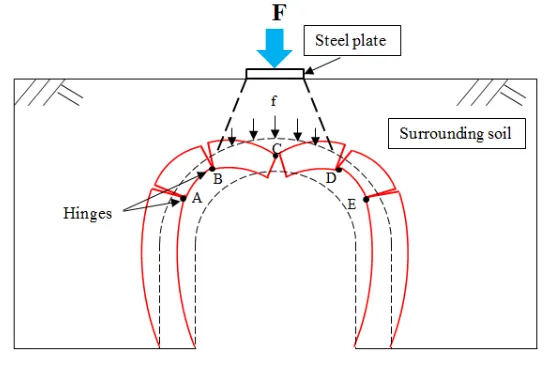
FIG 8. Tunnel model of failure under concentrated load
Fig. 8 illustrates the third physical model under concentrated load acting on
the overburden soil area just above the tunnel crown, transmitted by a steel plate.
During loading, the formation of structural hinges at the tunnel arch with cracking
was noted at 62% of the loading programme. The third physical model
experienced a sudden failure at the pressure of 0.73 MPa which was 70% of the
failure pressure of the second physical model test as shown in Table II. The failure
was due to the development of five structural hinges, point A to E shown in Fig. 9
(a), this agreed with Page (1993). In addition, the collapse of partial ring sections
due to ring separation of three arch rings at the tunnel crown, occurred suddenly at
[image:11.451.88.360.233.419.2](2011). Data result from the concentrated load test on the third physical model is
shown in Table II.
FIG 9. (a) Collapse during the physical model test under concentrated load; (b) Deformation
[image:12.451.78.373.120.245.2]tendency of the tunnel profile under concentrated load
TABLE II. LOADING OUTPUTS FROM THREE PHYSICAL MODELS
4.2 Deflection and cracking behaviour
A simplistic depiction of the deformation tendency to failure is shown in Fig.
9 (b) where the sidewalls deformed outwards from the tunnel profile and the
Physical model
Mortar mix
proportion loading style
Failure load Failure pressure Mode of failure Location of failure 1 1:1:6 (higher strength)
Uniform load 995kN 1.49 MPa Mainly shear failure, partially tensile failure Mainly tunnel sidewalls, partially tunnel arch 2 1:2:9 (lower strength)
Uniform load 694kN 1.04 MPa Mainly shear failure, partially tensile failure Mainly tunnel sidewalls, partially tunnel arch 3 1:2:9 (lower strength) Concentrated
load 73kN
[image:12.451.57.396.341.541.2]For the same mortar mix ratio (1:2:9), the third physical model was placed
under concentrated load where it experienced only half vertical movement of the
crown at failure, compared to that of the second physical model under uniform
load as shown in Fig. 10 (a). In the third physical model, the tunnel crown at the
first (inner) arch ring recorded diagonal deformation, developing a structural hinge
at the third (outer) arch ring and cracks through three arch rings at the tunnel
crown. In the second physical model, the tunnel crown only moved vertically.
With regards to springing deflection at failure, the third physical model had
comparable springing displacement within 5% difference from that of the second
[image:13.451.68.388.243.358.2]physical model as can be seen in Fig. 10 (b).
FIG 10. (a) crown displacement curves under uniform and concentrated load; (b)
Pressure-springing displacement curves under uniform and concentrated load
5 NUMERICAL SIMULATION
5.1 General introduction
Numerical models were developed using FLAC (Finite Difference Method)
and UDEC (Distinct Element Method) programmes and used to simulate and
compare the mechanical behaviour of the corresponding physical models after
loading. This would then allow these numerical models to be applied to future
field studies to enable accurate predictions of the actual mechanical behaviour of a
masonry tunnel.
In FLAC, the macro-modelling strategy (Idris et al., 2008) was used, which
was to consider the brick, mortar and brick / mortar interface smeared out in a
homogeneous anisotropic continuum; while the simplified micro-modelling 0 0.2 0.4 0.6 0.8 1 1.2
0 20 40 60
P re ss u re ( M P a)
Crown displacement (mm) Physical model test 2
Physical model test 3
0 0.2 0.4 0.6 0.8 1 1.2
0 5 10 15 20
P re ss u re ( M P a)
Springing displacement (mm) Physical model test 2
strategy (Idris et al., 2008) was applied to UDEC which assumed the continuum
part of detailed micro-modelling expands to zero thickness interfaces.
5.2 Parametric study
Take the parametric study of the first physical model under uniform load
using FLAC for example, the stiffness and strength properties of the brickwork
and the brickwork / soil joint were selected: Poisson’s ratio (v), Young’s modulus
(E), cohesion (c), friction angle ( ) and density ( ). The effects of these properties
on the stress and deformation conditions have been investigated with both uniform
and concentrated loading until failure.
Table III lists the mechanical properties assigned to brickwork with mortar
mix proportion of 1:1:6 and interface properties of brickwork and soil as a
baseline model from the laboratory work, analytical solutions and some estimation,
such as joint friction and joint cohesion. The properties of surrounding soil were
always kept the same during the whole process of numerical simulation, based on
the laboratory tests. After a sophisticated parametric analysis (details listed in
Table IV, Table V and Table VI) FLAC model A7 (see Table V for details) was
proved to be the one to simulate the physical model test 1, since its performance
i.e. deformation and failure characteristics under loading was very similar to the
physical model test 1. Similarly, parametric study for the second and the third
[image:14.451.53.402.452.538.2]physical models were conducted using FLAC and UDEC software.
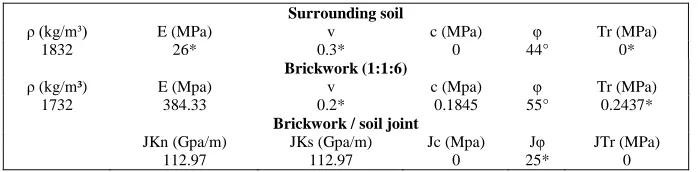
TABLE III. SURROUNDING SOIL, BRICKWORK (MIX PROPORTION 1:1:6) AND
BRICKWORK / SOIL JOINT PROPERTIES
Surrounding soil
(kg/m³) E (MPa) v c (MPa) Tr (MPa)
1832 26* 0.3* 0 44° 0*
Brickwork (1:1:6)
(kg/m³) E (Mpa) v c (Mpa) Tr (MPa)
1732 384.33 0.2* 0.1845 55° 0.2437*
Brickwork / soil joint
JKn (Gpa/m) JKs (Gpa/m) Jc (Mpa) J JTr (MPa)
112.97 112.97 0 25* 0
*: Young’s modulus and Poisson’s ratio of the surrounding soil were referring to Juspi, 2008; Poisson’s ratio of the brickwork
TABLE IV. BRICKWORK PARAMETRIC STUDY OF POISSON’S RATIO, YOUNG’S
MODULUS AND FRICTION ANGLE (MIX PROPORTION OF 1:1:6)
E (MPa) v c (MPa) JKn = JKs (GPa/m) J
Baseline A 384.33 0.2 0.1845 55° 112.97 25°
FLAC A1 384.33 0.3 0.1845 55° 136.87 25°
FLAC A2 553 0.2 0.1845 55° 162.55 25°
FLAC A3 249 0.2 0.1845 55° 73.19 25°
FLAC A4 384.33 0.2 0.1845 50° 112.97 25°
[image:15.451.54.397.103.320.2] [image:15.451.56.397.348.496.2]FLAC A5 384.33 0.2 0.1845 52° 112.97 25°
TABLE V. PARAMETRIC STUDY OF THE BRICKWORK COHESION (1:1:6)
E (MPa) v c (MPa) JKn = JKs
(GPa/m) J
FLAC A4 384.33 0.2 0.1845 50° 112.97 25°
FLAC A6 384.33 0.2 0.2 (8%) 50° 112.97 25°
FLAC A7 384.33 0.2 0.16 (13.3%) 50° 112.97 25°
FLAC A8 384.33 0.2 0.14 (24.1%) 50° 112.97 25°
TABLE VI. PARAMETRIC STUDY OF BRICKWORK YOUNG’S MODULUS, JOINT
FRICTION ANGLE AND STIFFNESS (1:1:6)
E (MPa) v c (MPa) JKn = JKs (GPa/m) J
FLAC A7 384.33 0.2 0.16 50° 112.97 25°
FLAC A9 384.33 0.2 0.16 50° 112.97 30°
FLAC A10 384.33 0.2 0.16 50° 112.97 35°
FLAC A11 384.33 0.2 0.16 50° 112.97 40°
FLAC A12 553 0.2 0.16 50° 162.55 25°
FLAC A13 249 0.2 0.16 50° 73.19 25°
FLAC A14 384.33 0.2 0.16 50° 56.49 25°
6 RESULTS AND DISCUSSIONS
6.1 The effect of stiffness and strength properties
In numerical models (1:1:6) the results showed there was little change on the
crown displacement due to the increase in the Poisson’s ratio of the brickwork and
FLAC baseline A. The interface stiffness of brickwork / soil (JKn & JKs)
reduction in value to 50% decreased the overall stiffness to some extent.
The decrease in friction angle of the brickwork increased the crown
displacement up to 75% of the FLAC baseline A; also the cohesion of the
brickwork changed largely because of the affect the mechanical behaviour of the
brickwork tunnel. The increase in joint friction angle slightly changed the crown
displacement curve.
The results of the parametric study indicate that both the friction angle and
the cohesion the brickwork have a significant influence on the brick-lined tunnel
mechanical behaviour with the most important parameter being cohesion. It shows
a good agreement with Idris et al. (2008) on the property study of masonry blocks.
The rest of the factors considered (Poisson’s ratio, Young’s modulus of the
brickwork, joint stiffness and friction angle) do not have a significant influence on
the mechanical behaviour of the brick-lined tunnel.
6.2 Comparison with physical model tests
Numerical modelling results using both FLAC and UDEC software were
analysed and compared with physical model tests of brick-lined tunnels, as shown
in Fig. 11 and Fig. 12. In terms of both deformation characteristics and failure
pattern, the numerical modelling results have a good agreement with the
mechanical behaviour of the physical model tests, thus proving that they could be
effectively used in the study of masonry tunnel stability. For example, Fig. 13 and
Fig. 14 illustrate the displacement vectors and plastic state of the FLAC numerical
model simulating the first physical model. The image in the lower left-hand corner
of each figure shows the physical effect of the model test result. Both of the
figures are coincident with the first physical model test, with a similar deformation
trend and shear failure at the tunnel sides.
These good agreements with physical model tests 1 - 3 encouraged further
predictions of performance using numerical modelling under various conditions,
FIG 11. Physical model test 1 (a) & physical model test 2 (b) vs. numerical curves
FIG 12. Physical model test 3 vs. numerical curves
FIG 13. Displacement vectors of numerical model (1:1:6) during uniform static load compared with
0 0.2 0.4 0.6 0.8 1 1.2 1.4 1.6
0 20 40 60 80
P re ss u re ( M P a)
Crown disp (mm) Physical model test 1 FLAC UDEC 0 0.2 0.4 0.6 0.8 1 1.2
0 20 40 60
P re ss u re ( M P a)
Crown disp (mm) Physical model test 2 FLAC' UDEC' 0 0.2 0.4 0.6 0.8
0 10 20 30
P re ss u re ( M P a)
Crown disp (mm)
Physical model test 3 FLAC''
UDEC''
(a)
Physical model test 1
FLAC A
UDEC A
Physical model test 2
FLAC B
UDEC B
Physical model test 3
FLAC C
UDEC C
[image:17.451.123.345.421.570.2]FIG 14. Plastic state of numerical model (1:1:6) compared with the physical model
7 PREDICTION OF NUMERICAL SIMULATIONS
7.1 Introduction
Based on the previous numerical modelling, the deformation characteristics,
mechanical behaviour and probable failure mechanisms of the brick-lined tunnels
under different conditions are predicted by FLAC and UDEC software separately.
TABLE VII. PREDICTION OF NUMERICAL MODELS UNDER UNIFORM AND
CONCENTRATED LOAD
7.2 Overburden soil depth
In order to figure out the interaction of the overburden soil on brick-lined Numerical
model No.
Overburden soil depth (mm)
Depth difference
(mm) loading style
Mortar mix proportion
1 980
Uniform load 1:1:6 (higher strength)
2 1075 95
3 1265 190
4 1455 190
7 980
Concentrated load
1:2:9 (weaker strength)
8 1075 95
9 1170 95
[image:18.451.58.392.427.542.2]models. Depths from 980 mm to 1455 mm in increments of 95 mm or 190 mm
were added each time, as can be seen in Table VII.
For the model under uniform load, the increase in soil depth gradually
decreases the overall stiffness and failure load of the brick-lined tunnel, as can be
seen in Fig. 15 (a). The shear failure not only occurs at the tunnel sidewalls, but
also extends to the tunnel arch as the soil depth rises. On the contrary, for the
model under concentrated load, an increase in the soil depth leads to an increase in
the overall stiffness of the brick-lined tunnel dramatically, see Fig. 15 (b). Beyond
a soil depth of 1265 mm, it is very hard to disperse the concentrated load to the
tunnel since most of the concentrated load would only be dispersed to the soil
[image:19.451.71.384.262.394.2]below.
FIG 15. Prediction of crown displacement curves under (a) uniform load & (b) concentrated load
7.3 Concentrated load
In order to simulate the overloading and failure of ‘Brickwork Bridge’ due to
heavy vehicles, numerical models are then developed to study the failure
mechanism of the brick-lined tunnels under concentrated load at different
locations.
The performance of numerical modelling under concentrated load at different
positions is predicted as followed, especially at one quarter across the tunnel arch
and at the middle of the tunnel arch which are usually considered to be the critical
loading position (Robinson and Kapoor, 2009). With the load 0.1 m wide, the
UDEC modelling was used to predict better local mechanical behaviour.
As an application of ‘Brickwork Bridge’ under a pavement, Fig. 16 0 0.2 0.4 0.6 0.8 1 1.2 1.4 1.6
0 20 40 60 80
P re ss u re ( M P a)
Crown disp (mm) FLAC P1_980mm FLAC_Original_1075mm FLAC P2_1265mm FLAC P3_1455mm 0 0.2 0.4 0.6 0.8
0 10 20 30 40
P re ss u re ( M P a)
Crown disp (mm) FLAC'' P1_980mm
FLAC''_Original_1075mm
FLAC'' P2_1170mm
FLAC'' P3_1265mm
concentrated load at 1/4 way across the tunnel arch. Compared to the concentrated
[image:20.451.98.344.143.466.2]load at 1/2 way across the arch with direct tensile failure at the crown as shown in
Fig. 17, the load at 1/4 way across the arch has been transferred to one side of the
tunnel arch. The failure load is larger with tensile failure at one side of the arch.
FIG 16. Prediction of plastic state under concentrated load at 1/4 of the arch
FIG 17. Prediction of plastic state under concentrated load at 1/2 of the arch
8 CONCLUSION
The test results from physical scale models clearly indicated the mechanical
behaviour of the brick-lined tunnels, e.g. deflection pattern of brick lining,
force-displacement relationship, crack formation and failure mechanism. The failure
pattern of physical models under uniform and concentrated load differed. The first
UDEC (Version 4.00)
LEGEND 2-Apr-13 21:13 cycle 16875 time = 1.117E+00 sec
no. zones : total 1318
at yield surface (*) 349
yielded in past (X) 647
tensile failure (o) 34 block plot
-0.200 0.200 0.600 1.000 1.400
-0.800 -0.400 0.000 0.400 0.800 JOB TITLE : Plastic state at 1/4
Itasca Consulting Group, Inc. Minneapolis, Minnesota USA
UDEC (Version 4.00)
LEGEND 2-Apr-13 21:09 cycle 20799 time = 1.383E+00 sec
no. zones : total 1318 at yield surface (*) 379 yielded in past (X) 617 tensile failure (o) 46
block plot
-0.200 0.200 0.600 1.000 1.400
-0.800 -0.400 0.000 0.400 0.800 JOB TITLE : Plastic state at 1/2
[image:20.451.108.338.146.297.2]physical model, which was under concentrated load, failed due to the formation of
five structural hinges at the tunnel arch. The strength of mortar has a large
influence on the overall behaviour. The model test under concentrated load
showed more brittle behaviour than under uniform load.
Numerical simulations were presented with continuum and discontinuum
methods. Quantitative agreement with the physical tests was achieved from
parameter studies. The deflection and failure mechanism could be reasonably
simulated. Results from the parametric analysis confirmed that, in both numerical
methods, the cohesion of brickwork (blocks in UDEC) was the dominant factor,
followed by the friction angle of brickwork. These results agreed with the findings
of Idris et al. (2008). However, numerical models were not very sensitive to the
Poisson’s ratio, Young’s modulus of the brickwork, joint stiffness, joint cohesion
or the joint friction angle. Generally, the micro-modelling strategy (used in UDEC)
shows a better agreement with the physical model test of the local failure
behaviour of brickwork structures. The failure pattern of the UDEC model under
concentrated load clearly demonstrates the hinges and cracks at certain positions
of the tunnel arch. The macro-modelling strategy applied in FLAC simulates
reasonably well the deformation characteristics and shows a good agreement with
the three physical model tests.
Prediction of numerical models at various soil depths under uniform load
showed the interaction between a brick-lined tunnel and the overburdened soil;
prediction at different locations under concentrated load was linked to the
engineering application of a ‘Brickwork Bridge’ under a pavement. It was shown that, under uniform load, shear failure not only occurred at the tunnel sidewalls,
but also extended to the tunnel arch. As the soil depth increased, the concentrated
load at the middle of the arch failed easier due to direct tensile failure at the crown,
compared to the load one quarter across the arch.
As a recommendation for further modelling work, it would be interesting to
introduce other constitutive models related to masonry structures to simulate the
longer term deformation and stress conditions of brick-lined tunnels after years of
degradation. More realistic conditions could be applied, such as tunnels
surrounded by anisotropic geotechnical materials and cyclic loading, representing
ACKNOWLEDGEMENTS
The research was conducted while Dr. Han-Mei Chen was studying at The
University of Nottingham towards a PhD. The authors are grateful to all
technicians working in the Nottingham Centre for Geomechanics and the
laboratory of Civil Engineering for providing their assistance throughout the
experimental work, and to the staff from Nottingham Geospatial Institute
especially Dr. Nikolaos Kokkas for providing advice on this research.
REFERENCES
BETTI, M., DROSOPOULOS, G. A. & STAVROULAKIS, G. E., 2008. Two non-linear finite element
models developed for the assessment of failure of masonry arches. Comptes Rendus Mécanique,
336 (1-2), 42-53.
BS4551:1980, 1980. Methods of testing mortars, screeds and plasters. London: British Standards
Institution.
CASAS, J. R., 2011. Reliability-based assessment of masonry arch bridges. Construction and Building
Materials, 25(4), 1621-1631.
CHEN H-M, YU H-S, SMITH M J, KOKKAS N, 2013. Advanced monitoring techniques for assessing
the stability of small-scale tunnels. 2nd Joint International Symposium on Deformation
Monitoring (JISDM), The University of Nottingham on 9-11 September 2013.
CHEN H-M., 2014. Physical model tests and numerical simulation for assessing the stability of tunnels.
Ph.D. Thesis, Faculty of Engineering, University of Nottingham, UK.
CHEN H-M, SMITH M J, YU H-S, KOKKAS N, 2014. Monitoring the deformation of small scale
model tunnels under load testing. Survey Review 2014 Vol. 46 No 339 pages 417-425.
GIORDANO, A., MELE, E. & DE LUCA, A., 2002. Modelling of historical masonry structures:
comparison of different approaches through a case study. Engineering Structures, 24, 1057-1069.
HOGG, V., 1997. Effects of repeated loading on masonry arch bridges and implications for the
serviceability limit state, Ph.D. Thesis, Department of Civil Engineering, University of
Nottingham.
IDRIS, J., VERDEL, T. & AL-HEIB, M., 2008. Numerical modelling and mechanical behaviour
analysis of ancient tunnel masonry structures. Tunnelling and Underground Space Technology, 23,
251-263.
JUSPI, S., 2007. Experimental validation of the shakedown concept for pavement analysis and design,
Ph.D. Thesis, Department of Civil Engineering, University of Nottingham.
LOURENÇO, P. B., 1996. Computational strategies for masonry structures, Ph.D. Thesis, Department
of Civil Engineering, Delft University of Technology.
LOURENÇO, P.B., 1998. Experimental and numerical issues in the modelling of the mechanical
behaviour of masonry, In: ROCA, P., GONZÁLEZ, J. L., OÑATE, E. & LOURENÇO, P.B,
editors. Structural analysis of historical constructions II. Possibilities of numerical and
experimental techniques. CIMNE, 57-92.
PAGE, J., 1993. State-of-the-art-review: Masonry Arch Bridges. Transport Research Laboratory.
HMSO publications.
ROBINSON, A.M., & KAPOOR, A. (Eds.), 2009. Fatigue in railway infrastructure. Woodhead
Publishing.
SUTCLIFFE, D. J., 2003. Masonry shear walls: a limit analysis approach, Ph.D. Thesis, Discipline of
Civil, Surveying and Environmental Engineering, University of Newcastle, Australia.
VALLUZZI, M. R., BINDA, L. & MODENA, C., 2005. Mechanical behaviour of historic masonry
structures strengthened by bed joints structural repointing. Construction and Building Materials,