R E S E A R C H A R T I C L E
Open Access
Assessing the context of health care utilization in
Ecuador: A spatial and multilevel analysis
Daniel F López-Cevallos
1*, Chunhuei Chi
2Abstract
Background:There are few studies that have analyzed the context of health care utilization, particularly in Latin America. This study examines the context of utilization of health services in Ecuador; focusing on the relationship between provision of services and use of both preventive and curative services.
Methods:This study is cross-sectional and analyzes data from the 2004 National Demographic and Maternal & Child Health dataset. Provider variables come from the Ecuadorian System of Social Indicators (SIISE). Global Moran’s I statistic is used to assess spatial autocorrelation of the provider variables. Multilevel modeling is used for the simultaneous analysis of provision of services at the province-level with use of services at the individual level.
Results:Spatial analysis indicates no significant differences in the density of health care providers among
Ecuadorian provinces. After adjusting for various predisposing, enabling, need factors and interaction terms, density of public practice health personnel was positively associated with use of preventive care, particularly among rural households. On the other hand, density of private practice physicians was positively associated with use of curative care, particularly among urban households.
Conclusions:There are significant public/private, urban/rural gaps in provision of services in Ecuador; which in turn affect people’s use of services. It is necessary to strengthen the public health care delivery system (which includes addressing distribution of health workers) and national health information systems. These efforts could improve access to health care, and inform the civil society and policymakers on the advances of health care reform.
Background
Over the past few years Ecuador has slowly emerged from a deep political, economic, and social crisis that has had a heavy impact on all sectors, with vulnerable groups being the hardest hit. The main political and social problems that have a direct impact on the health situation include high levels of poverty, limited access to health services, and low health insurance coverage [1]. This is due in part to the lack of a national health care system structured as indicated in the National Constitution (which was recently revisited by the 2008 Constitutional Assembly). The health care sector in Ecuador is constituted by a mix of public and private providers. The majority (85%) of health care facilities operate under public institutions: the Ministry of Public Health (MPH), the Ecuadorian Social Security Institute (IESS), the Military and Police Health Services (under
the Ministries of Defense and Government, respectively), and the health services of certain provinces and municipalities [2]. The Ecuadorian Congress approved in 2000 a health care reform law in order to establish a National Health Care System (NHCS). Although there are important pieces missing (such as how to finance Universal Health Insurance; connection with local and regional services, etc.), it provided a basic agreement to work on for the future of a NHCS. In its report about Health Reform in Andean Countries, Pan American Health Organization (PAHO) mentions that Ecuador has not shown evidence that health care reform influenced any indicators selected to evaluate access or use of health care resources, including distribution of services [3]. Moreover, the political instability of the past decade has caused problems in governance and continuity in public management, which in turn has affected the health sector reform process [4].
* Correspondence: [email protected]
1Division of Health and Physical Education, Western Oregon University, 345
N Monmouth Ave, Monmouth, Oregon, 97361, USA
From a public health and ecological perspective, it is important to analyze contextual factors affecting the use of health services at the community, institutional and policy levels [5,6]. During the last 40 years, Andersen’s Health Care Utilization Behavior model has been adapted to consider more system-level measures, focusing on the availability, organization and financing of services [7,8]. Further, these literature indicated that besides predisposing, enabling and need factors, the environment and provider-related factors also affect healthcare utilization [9]. From a programmatic and policy perspective, connecting peoples’perceptions of health services and health care delivery system characteristics can contribute to our understanding of utilization behavior in a more comprehensive manner. In a systematic review of the literature, Phillips et al. (1998) found that the majority of studies that included environmental variables measured only urban/rural location, or region, which may be imprecise proxies for more specific measures such as supply of services. Hence, characteristics such as physician supply and
availability of physicians in the community would be important contextual variables to be considered within the health services utilization model [9,10]. There are few studies that have analyzed the context of health care utilization in Latin America. Most studies have focused on the relationship between income inequality and health outcomes [11-13]. However, advances in health geography have improved our understanding of the role played by geographic distribution of health services on access to health services [14,15]. Notably, a study in Costa Rica linked census data with an inventory of health facilities allowing the researcher to analyze the impact of reform expansions on equity in provision of health care services[16].
The purpose of the present study is to analyze the context in which utilization of health services in Ecuador takes place, focusing on the provision of services. More specifically, this inquiry is focused on two research questions: 1) What is the spatial distribution of health care providers at the province level in Ecuador?, 2) What is the influence of provider measures (adjusting for predisposing, enabling, and need factors) in use of health care services in Ecuador?
Methods
Data
The main dataset analyzed in this study was the 2004 Demographic and Maternal & Child Health Survey (2004 ENDEMAIN) [17]. Using a multistage clustering design, ENDEMAIN 2004 provided a nationally representative sample of 28,908 households in Ecuador. The 2001 National Census was utilized as the sampling frame for selecting individual non-institutionalized
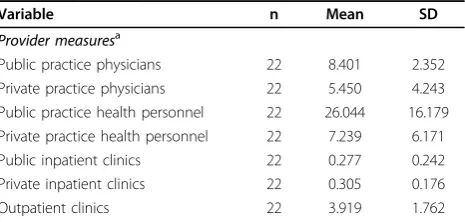
households within census sectors. Two separate questionnaires were applied to different sub-samples: 1) an interview with a woman of reproductive age about sexual and reproductive health issues was completed in 10,813 households; and 2) an interview with an adult about health utilization and expenditures of all household members was completed in 10,985 households. For the later, ENDEMAIN 2004 gathered information on utilization of health services, and health care and consumption expenditures. In this survey, the response rate was 88.7% [17,18]. Various provider measures at the province level were extracted from the Ecuadorian System of Social Indicators (SIISE, v4.0, 2005). All provider-level measures were tabulated by SIISE from the Health Care Resources Survey (ERAS) 2001 data. The number of outpatient clinics per 10.000 inhabitants is the only measure that is not disaggregated into public/private due to data constraints. Public health care services include those provided by: Ministry of Health, IESS, ISSFA, ISSPOL, province and municipality governments; while private health care services include non-for-profit and for-profit providers. Health personnel measures comprised dentists, obstetricians, nurses, and health aides. The provider measures included density of: a) public practice physicians, b) private practice physicians, c) public practice health personnel, d) private practice health personnel, e) public inpatient clinics, f) private inpatient clinics, g) outpatient clinics, per 10 000 inhabitants [19]. Table 1 presents a summary of province level measures.
[image:2.595.306.539.610.721.2]Following the proposed research questions, this study includes two components. First, an ecological analysis of provider measures at the province level was conducted using both correlation and spatial clustering. The spatial analysis verified the distribution of provider measures across space. Second, a multilevel analysis of the relationship between provider measures and use of health services was conducted. Using 2004 ENDEMAIN, Andersen’s model of health care utilization served as a framework to classify predictors of health care utilization in three categories: predisposing
Table 1 Summary statistics of province level measures.
Variable n Mean SD
Provider measuresa
Public practice physicians 22 8.401 2.352 Private practice physicians 22 5.450 4.243 Public practice health personnel 22 26.044 16.179 Private practice health personnel 22 7.239 6.171
Public inpatient clinics 22 0.277 0.242
Private inpatient clinics 22 0.305 0.176
Outpatient clinics 22 3.919 1.762
a
(demographic), enabling (socioeconomic), and need factors.Predisposing factors included age, sex, ethnicity, and marital status. ENDEMAIN 2004 asked for marital status of individuals over 12 years of age. We assigned the category single to these individuals (to capture young children’s health care utilization).Enabling factors
consisted of area of residence, assets quintile, consumption quintile, educational level, and health insurance status. Since ENDEMAIN 2004 asked for educational level of individuals 5 years of age and older, we assigned the categorynone to these individuals (to capture young children’s health care utilization). In ENDEMAIN 2004, two indexes were created as a ranking (quintiles) of household economic status: 1) an economic index based on household characteristics and durable goods availability (Assets quintiles); and 2) an economic index based on household consumption of goods and services (Consumption quintiles). Further explanation on the development of both variables can be found at: http://www.cepar.org.ec/endemain_04/ nuevo05/informe/anexos/anexo1.htm. Perceived need
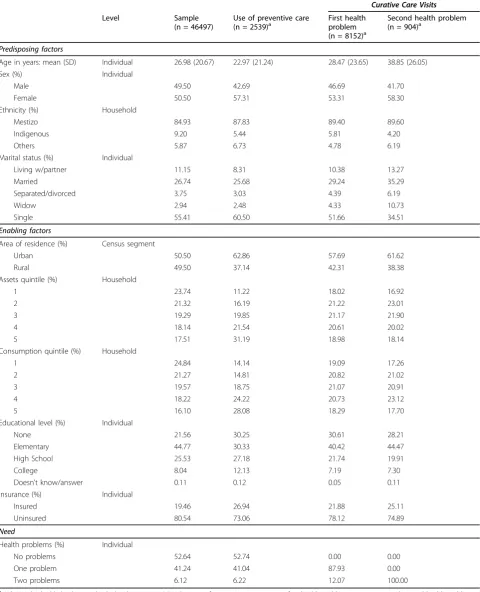
was defined as the reported number of health problems by respondents. Participants were asked for the two most important health problems during the previous 30 days. Health care utilization was measured by use of preventive services and curative care visits. Due to the way the survey was designed, curative visits were specific to each of the two health problems reported. Table 2 summarizes the predictors included in the analysis for use of preventive and curative care.
Statistical Analysis
The first part of the analysis included both a non-spatial measure of correlation (r) and a spatial measure of correlation (Global Moran’s I statistic). The correlation matrix (Table 3) showed that density of outpatient services, public inpatient services, and private inpatient services were highly correlated with public practice physicians (r = 0.64), public practice health personnel (r = 0.70), and private practice physicians (r = 0.78); respectively. Therefore, further analyses included only the following four predictors: public and private practice physicians; and public and private practice health personnel.
Global Moran’s I statistic is a measure of spatial autocorrelation (SA), which is the correlation of a variable with itself through space (i.e. it compares the value of the variable at any single location with the value at all other locations). SA can assess any systematic pattern (clustering) in the spatial distribution of that variable (i.e. the two dimensional equivalent of redundancy) [20,21]. If neighboring areas are more similar, we would obtain a positive spatial autocorrelation which might violate the assumption that
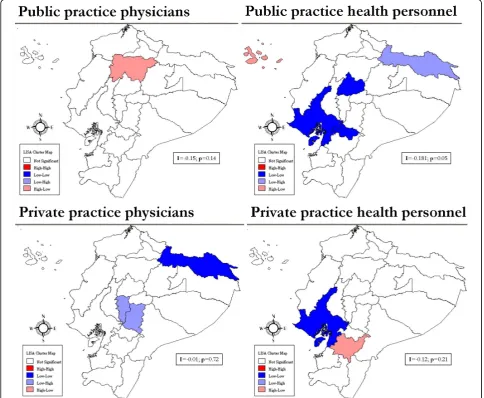
the observation values in each sample are independent of each other. A Moran’s I value near +1.0 indicates clustering; 0 indicates randomness; and a value near -1.0 indicates dispersion. This analysis also produced univariate LISA (Local Indicator of Spatial Autocorrelation) maps to assess specific spatial patterns of provider variables (Figure 1).
The second part of the analysis used multilevel models to examine the relationship between provider level measures and individual health care utilization (adjusting for various relevant predisposing, enabling and need factors). The multilevel analysis was better suited to account for the four levels in ENDEMAIN sampling frame. The highest level consisted of 17 strata which included two regions (Amazon and Galapagos Islands) and 15 provinces (10 from Sierra region and 5 from Costa region). Consequently, the term province/ region refers to this particular level of analysis. The four levels included: 1) 17 provinces; 2) 692 census segments; 3) 10 985 households; and 4) 46 497 individuals. In doing so, this study explicitly accounted for clustering in such a complex sample design [22-24]. Furthermore, multilevel modeling offered the possibility of merging provider measures at the province/region level to the analysis. Since ENDEMAIN 2004 reduced theOriente
provinces (Sucumbíos, Orellana, Napo, Pastaza, Morona Santiago, and Zamora Chinchipe) to a single stratum, an average was calculated for each Oriente provider measure to be included in multilevel models. Provider measures were linked with the ENDEMAIN dataset using the Stata mergecommand. After checking for accuracy of merging, the new dataset was imported into MLwiN for multilevel analyses. This is advantageous for our analysis given that the ENDEMAIN data does not include local level provider information. Given that 97% of private practice physicians are concentrated in urban areas (86% among public practice physicians) [19], the final conditional models included interaction terms between provider measures and the urban/rural dummy variable.
A common way of specifying multilevel models is to build them in a sequential manner [13], starting with a
Table 2 Unweighted summary statistics for use of preventive and curative care.
Curative Care Visits
Level Sample
(n = 46497)
Use of preventive care (n = 2539)a
First health problem (n = 8152)a
Second health problem (n = 904)a
Predisposing factors
Age in years: mean (SD) Individual 26.98 (20.67) 22.97 (21.24) 28.47 (23.65) 38.85 (26.05)
Sex (%) Individual
Male 49.50 42.69 46.69 41.70
Female 50.50 57.31 53.31 58.30
Ethnicity (%) Household
Mestizo 84.93 87.83 89.40 89.60
Indigenous 9.20 5.44 5.81 4.20
Others 5.87 6.73 4.78 6.19
Marital status (%) Individual
Living w/partner 11.15 8.31 10.38 13.27
Married 26.74 25.68 29.24 35.29
Separated/divorced 3.75 3.03 4.39 6.19
Widow 2.94 2.48 4.33 10.73
Single 55.41 60.50 51.66 34.51
Enabling factors
Area of residence (%) Census segment
Urban 50.50 62.86 57.69 61.62
Rural 49.50 37.14 42.31 38.38
Assets quintile (%) Household
1 23.74 11.22 18.02 16.92
2 21.32 16.19 21.22 23.01
3 19.29 19.85 21.17 21.90
4 18.14 21.54 20.61 20.02
5 17.51 31.19 18.98 18.14
Consumption quintile (%) Household
1 24.84 14.14 19.09 17.26
2 21.27 14.81 20.82 21.02
3 19.57 18.75 21.07 20.91
4 18.22 24.22 20.73 23.12
5 16.10 28.08 18.29 17.70
Educational level (%) Individual
None 21.56 30.25 30.61 28.21
Elementary 44.77 30.33 40.42 44.47
High School 25.53 27.18 21.74 19.91
College 8.04 12.13 7.19 7.30
Doesn’t know/answer 0.11 0.12 0.05 0.11
Insurance (%) Individual
Insured 19.46 26.94 21.88 25.11
Uninsured 80.54 73.06 78.12 74.89
Need
Health problems (%) Individual
No problems 52.64 52.74 0.00 0.00
One problem 41.24 41.04 87.93 0.00
Two problems 6.12 6.22 12.07 100.00
a
Table 3 Bivariate Pearson correlation coefficients for provider measures.
Outpatient Services
Public Inpatient
Services
Private Inpatient
Services
Public Practice Physicians
Public Practice
Health Personnel
Private Practice Physicians
Private Practice
Health Personnel
Outpatient Services
[per 10 000 inhabitants]a 1.000
Public Inpatient Services 0.744*** 1.000
Private Inpatient Services -0.496** -0.472** 1.000
Public Practice Physicians 0.644*** 0.580*** -0.299* 1.000 Public Practice
Health Personnel
0.482** 0.695*** -0.373** 0.583*** 1.000
Private Practice Physicians -0.487** -0.513*** 0.778*** -0.003 -0.295* 1.000 Private Practice
Health Personnel
-0.148 -0.055 0.121 0.150 0.360* 0.320* 1.000
* p < 0.1, ** p < 0.05, *** p < 0.01. a
All provider measures have the same denominator.
[image:5.595.56.541.303.701.2](at p < 0.1) with the outcomes of interest. Only these provider measures were utilized in further analyses. The final multivariate multilevel models were adjusted for predisposing, enabling, need factors, and interaction terms. For data preparation, descriptive statistics, and merging we used Stata MP v9.2 [26]. To calculate the Global Moran’s I and LISA functions we used GeoDa 0.9.5-i5 [27]. Lastly, we used MLwiN 2.02 to fit all multilevel models [28].
Results
Spatial autocorrelation (Moran’s I) scores revealed no significant spatial clustering of provider measures by province. For public practice health personnel, although the initial Global Moran’s I showed no clustering (I = -0.18, p < 0.05), it became somewhat clustered when the provinces of Galapagos and Sucumbíos (outliers) were excluded (I = 0.09, p < 0.05). Moreover, LISA analysis showed there was a cluster of low density of public practice health personnel in Guayas, Cañar, and Cotopaxi (provinces in blue, Figure 1). In summary, the preliminary ecological analysis showed that, for the most part, the provider measures were randomly distributed across space. In other words, in this study provider density seemed equally distributed across provinces in Ecuador.
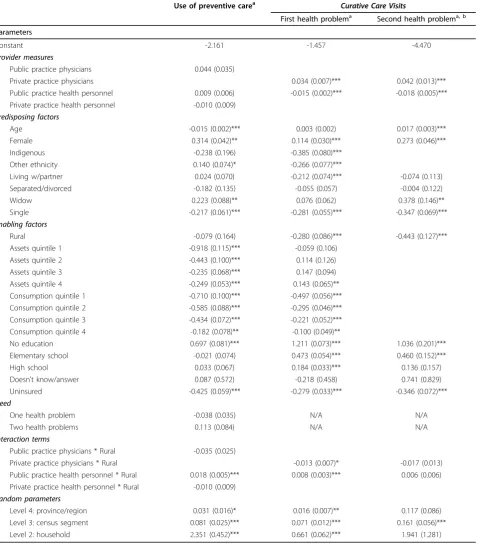
Table 4 presents the final conditional multilevel models for use of preventive and curative care. Except for provider measures and age, all explanatory variables were entered in the models as indicator dummy variables. In bivariate analyses, three provider measures were significantly associated with use of preventive care (public practice physicians, public practice health personnel, and private practice health personnel). After the model adjusted for predisposing, enabling, and need factors, the density of public practice health personnel had a significant positive association with use of preventive care (OR = 1.015, 95%CI: 1.003-1.027). This result suggests that for a 1-unit increase in the density of public practice health personnel, the odds of using preventive care by Ecuadorians increased 1.5%. The final model included three interaction terms. The public practice health personnel*rural was the only statistically significant interaction term (OR = 1.018, 95%CI: 1.008- 1.028). In other words, density of public practice health personnel has a bigger impact among rural households, by increasing to 1.8% the odds of using preventive care (notice how public practice health personnel is no longer statistically significant when including the interaction term). This is an interesting finding, considering that initially there was no significant difference in use of preventive care between urban and rural households (OR = 0.92, 95%CI: 0.67 - 1.27). Both
assets and consumption quintiles show a gradient where the poorest households are least likely to use preventive care (ORassets = 0.40, 95%CI = 0.32-0.50;
ORconsu mption = 0.49, 95%CI = 0.40-0.60) in
comparison with the wealthiest households (i.e. use of preventive services increases with wealth).
In bivariate analyses, two provider measures were significantly associated with both measures of curative care: private practice physicians, and public practice health personnel. The density of private practice physicians had a positive association with first health problem curative visit (OR = 1.027, 95%CI = 1.013-1.042), even after adjusting for predisposing and enabling factors. In contrast, the density of public practice health personnel was negatively associated with the outcome of interest (OR = 0.987, 95%CI = 0.983-0.991). Interestingly, the interaction terms showed almost the opposite. Among rural households, density of public practice health personnel was positively related to use of curative services for the first reported health problem (OR = 1.008, 95%CI = 1.002-1.014). In contrast with use of preventive care, consumption seemed to play a bigger role than assets when utilizing curative services, particularly for the poorest households (ORassets
= 0.94, 95%CI = 0.77-1.16; ORconsumption= 0.61, 95%CI
= 0.55-0.68). Both private practice physicians and public practice health personnel had a similar behavior with both curative care outcomes. The density of private practice physicians was also positively associated with
second health problem curative visit (OR = 1.034, 95% CI: 1.008 - 1.060) after adjusting for predisposing and enabling factors. In contrast, public practice health personnel was negatively related to second health problem curative visit (OR = 0.984, 95%CI: 0.973 -0.996). In this case, however, none of the interaction terms were statistically significant. It is important to highlight that rural households were less likely to use curative care for both the first health problem (OR = 0.76, 95%CI = 0.64-0.89) and the second health problem (OR = 0.64, 95%CI = 0.50-0.82). Similarly, the lack of health insurance was a strong barrier to utilizing both preventive (OR = 0.65, 95%CI = 0.58-0.73) and curative care services (OR = 0.76, 95%CI = 0.71-0.81; OR = 0.71, 95%CI = 0.61-0.81, for first and second reported health problem, respectively).
Discussion
Table 4 Multilevel weighted regression estimates for use of preventive and curative care.
Use of preventive carea Curative Care Visits
First health problema Second health problema, b
Parameters
Constant -2.161 -1.457 -4.470
Provider measures
Public practice physicians 0.044 (0.035)
Private practice physicians 0.034 (0.007)*** 0.042 (0.013)***
Public practice health personnel 0.009 (0.006) -0.015 (0.002)*** -0.018 (0.005)*** Private practice health personnel -0.010 (0.009)
Predisposing factors
Age -0.015 (0.002)*** 0.003 (0.002) 0.017 (0.003)***
Female 0.314 (0.042)** 0.114 (0.030)*** 0.273 (0.046)***
Indigenous -0.238 (0.196) -0.385 (0.080)***
Other ethnicity 0.140 (0.074)* -0.266 (0.077)***
Living w/partner 0.024 (0.070) -0.212 (0.074)*** -0.074 (0.113)
Separated/divorced -0.182 (0.135) -0.055 (0.057) -0.004 (0.122)
Widow 0.223 (0.088)** 0.076 (0.062) 0.378 (0.146)**
Single -0.217 (0.061)*** -0.281 (0.055)*** -0.347 (0.069)***
Enabling factors
Rural -0.079 (0.164) -0.280 (0.086)*** -0.443 (0.127)***
Assets quintile 1 -0.918 (0.115)*** -0.059 (0.106)
Assets quintile 2 -0.443 (0.100)*** 0.114 (0.126)
Assets quintile 3 -0.235 (0.068)*** 0.147 (0.094)
Assets quintile 4 -0.249 (0.053)*** 0.143 (0.065)**
Consumption quintile 1 -0.710 (0.100)*** -0.497 (0.056)***
Consumption quintile 2 -0.585 (0.088)*** -0.295 (0.046)***
Consumption quintile 3 -0.434 (0.072)*** -0.221 (0.052)***
Consumption quintile 4 -0.182 (0.078)** -0.100 (0.049)**
No education 0.697 (0.081)*** 1.211 (0.073)*** 1.036 (0.201)***
Elementary school -0.021 (0.074) 0.473 (0.054)*** 0.460 (0.152)***
High school 0.033 (0.067) 0.184 (0.033)*** 0.136 (0.157)
Doesn’t know/answer 0.087 (0.572) -0.218 (0.458) 0.741 (0.829)
Uninsured -0.425 (0.059)*** -0.279 (0.033)*** -0.346 (0.072)***
Need
One health problem -0.038 (0.035) N/A N/A
Two health problems 0.113 (0.084) N/A N/A
Interaction terms
Public practice physicians * Rural -0.035 (0.025)
Private practice physicians * Rural -0.013 (0.007)* -0.017 (0.013)
Public practice health personnel * Rural 0.018 (0.005)*** 0.008 (0.003)*** 0.006 (0.006) Private practice health personnel * Rural -0.010 (0.009)
Random parameters
Level 4: province/region 0.031 (0.016)* 0.016 (0.007)** 0.117 (0.086)
Level 3: census segment 0.081 (0.025)*** 0.071 (0.012)*** 0.161 (0.056)***
Level 2: household 2.351 (0.452)*** 0.661 (0.062)*** 1.941 (1.281)
* p < 0.1, ** p < 0.05, *** p < 0.01. N/A = Not applicable. a
A four-level binomial logit model (IGLS, MQL1) was run for each outcome. The final conditional model was fitted with health care need, predisposing and enabling factors as fixed effects, and random variance at the household, census segment and province/region levels. Interaction terms were included between the provider measures and urban/rural. Figures in parentheses represent the standard errors.
b
and curative care at the individual level in a multilevel model, to advance our understanding of the context of health care utilization [6,29]. After adjusting for various predisposing, enabling, need factors and interaction terms, density of public practice health personnel was positively associated with use of preventive care, particularly among rural households. In turn, density of private practice physicians was positively associated with use of curative care, particularly among urban households (Table 5).
There seems to be a drastic difference in the effect of provision of private physician services among rural households. No significant effect was found for curative care of first (OR = 0.987, 95%CI = 0.974-1.001) and second health problem (OR = 0.983, 95%CI = 0.958-1.009). On the other hand, density of public practice health personnel was positively associated with use of preventive and curative care (first health problem), particularly among rural households. This dichotomy confirms our initial concerns regarding the distribution of health services and professionals in Ecuador. As mentioned before, urban areas in Ecuador concentrate 97% of private practice physicians (86% among public practice physicians), and 96% of private practice health personnel work in urban areas (88% among public practice health personnel). However, 39% of the population still lives in rural areas [19]. Although the disparity is wider than global indicators, the lack of health providers in rural and remote areas is a worldwide issue [30,31]. In the case of Ecuador, there is a double burden as reflected by an unequal distribution of providers both between public and private sectors, and between urban and rural areas [32], which may be aggravated by the international migration of health workers [31].
Strengthening the public health care delivery system, then, could significantly impact people’s ability to access health care services, particularly for rural households in Ecuador. Dussault and Franceschini (2006) identified five categories of determinants of geographical
distribution of health workers: individual, organizational, health care and educational systems, institutional structures, and broader socio-cultural environments. More succinctly, remuneration seems to be a predominant driving force in health workers retention. However, other factors may play an equally important role. For instance, the current model of medical education (mostly urban-based, curative, specialized, hospital-centered) has been found to influence the composition of the workforce and ultimately promote a
“cosmopolitan ethics” concerned more with individual success rather than overall public health system improvement [33]. Cuba’s Latin American School of Medicine (ELAM), Huish points out, presents an alternative model of medical education in which medical personnel are trained for community-oriented service in marginalized areas. Other similar (albeit more recent) initiatives in Latin America include the Family Health Program in Brazil, the Right to Health Reform in Chile,
the Barrio Adentro mission and the Integrated
Community Physicians Training Program in Venezuela. What these programs seem to have in common is the combination of redistributive approaches and educational processes associated with the right to health as a guiding principle [34]. In that context, Ecuador recently introduced the so called Basic Health Care Teams(EBAS) which intend to work at the community level with a focus on health promotion and disease prevention [2]. Another program (in place since 1970), the one-year obligatory rural medical service for recent graduates, has had mixed results and continues to face many challenges [35].
[image:8.595.56.542.113.225.2]The following caveats should be considered when interpreting the empirical findings of this study. First, in terms of data availability, this study relied primarily on secondary national survey data (ENDEMAIN 2004). In survey design, an important assumption is that although questions are usually asked about temporal (dynamic) processes,“fixed” populations are studied [36]. Second, the presence of facilities and providers was measured at
Table 5 Odds Ratios (and 95% confidence intervals) of the association between provider measures and use of preventive and curative care.
Curative Care Visits
Provider measures Preventive carea First health problema Second health problema
Public practice physicians 1.045
(0.976–1.119)
Private practice physicians 1.035
(1.020–1.049)
1.043 (1.017–1.070) Public practice health personnel 1.009
(0.997–1.021)
0.985 (0.981–0.989)
0.982 (0.973–0.992) Private practice health personnel 0.990
(0.973–1.008)
a
the province/region level. Such level of aggregation prohibits its use for local decision-making. Besides, it does not account for issues such as overlapping coverage, redundant services, potential for overcrowded facilities, and variation in quality of services [16]. Also, regression model results were susceptible to the modifiable areal unit problem (MAUP) since space was fragmented in administrative province/regions [37,38]. MAUP is present on spatial data and can be defined as the imposition of artificial units (e.g. provinces) on a rather continuous geographical phenomenon, such as density of providers, producing an scale or aggregation problem [21].
Yet, this study analyzed preliminary data at the province level, calculated Moran’s I (both globally and locally), which provided empirical evidence of spatial randomness in the geographical distribution of provider measures. Concurring with previous research, spatial visualization of provider measures proved to be an important complement to tabular ecological analysis [39]. Future research should consider utilizing a more
“relational” perspective that may reinforce the idea of a reciprocal connection of people-space [40]; and refining the administrative division (probably at the canton or parroquia levels) to facilitate linkages with provider data at those levels [6], and allow more accurate empirical analyses [41-43]. Also, public participation in health care policy planning and evaluation is an issue not addressed in this study. However, it is one that requires further inspection. In Ecuador, the active involvement of health care users in monitoring and evaluation of the health care system is promoted at local health councils. To date, however, no formal evaluation of its effectiveness in advancing health care decision making (including distribution of health facilities and workers) has been conducted. Recent research suggests the need to balance an expert-led process and one “that emphasizes public involvement in decision making”[44]. Public Participation GIS could be an important tool to involve local communities in a more collaborative decision-making process [45].
Conclusions
This study was one of few attempting to connect use of health services with the context in which utilization occurs, by including health care provider measures. This approach acknowledged the important connections between individual health care utilization behaviors and contextual factors [46]. In other words, this study went beyond the “population at risk” perspective of the original Andersen’s model, to assess delivery system measures that allowed us to contrast utilization with provision of services [6,8]. For Latin America, this study adds to recent empirical work on the context of health
care utilization [16], by combining preliminary ecological analysis (at the province level) with a multilevel regression framework. Finally, the present study supports the rationale for building stronger national health care and health information systems [16,42]. Such an infrastructure could improve people’s access to health care and more transparently inform the public and policymakers on the advances of health care reform in Ecuador and other low- and middle-income countries [32,47].
Acknowledgements
This research was supported by a SYLFF Graduate Fellowship for International Research from the Oregon University System and a Diversity Fellowship from Western Oregon University. The funding organizations had no involvement in the preparation of the present manuscript. The authors are grateful to Dr. Paul Stupp of the Centers for Disease Control; Dan Williams of the University of North Carolina-Chapel Hill; and Drs. Nelson Oviedo and Jose Ordonez of CEPAR, for their guidance in understanding the 2004 ENDEMAIN survey. Drs. Terry Duncan and Dawn Wright at Oregon State University are thanked for providing assistance with multilevel modeling; and conceptual and editorial support, respectively.
Author details
1Division of Health and Physical Education, Western Oregon University, 345
N Monmouth Ave, Monmouth, Oregon, 97361, USA.2International Health Program, Department of Public Health, Oregon State University, 254 Waldo Hall, Corvallis, Oregon, 97331, USA.
Authors’contributions
DFLC conceptualized the study, measures, and conducted all data analyses presented. CC supported the study conceptualization, measures, and provided editorial comments and suggestions on the interpretation of findings. Both authors read and approved the final manuscript.
Competing interests
The authors declare that they have no competing interests.
Received: 7 August 2009 Accepted: 12 March 2010 Published: 12 March 2010
References
1. Pan-American Health Organization:Profile of the Health Services System of Ecuador.Washington, D.C.: Author2001, 29.
2. Organizacion Panamericana de la Salud:Perfil del Sistema de Salud del Ecuador.Washington, DC: Author2008, 56.
3. Pan-American Health Organization:Analysis of Health Sector Reforms in the Andean Countries.Washington, D.C.: Author2002, 30.
4. Pan-American Health Organization:Health in the Americas: Ecuador.
Washington, D.C.: Author2007, 304-321.
5. National Cancer Institute:Theory at a Glance: A Guide for Health Promotion Practice.Washington, D.C.: National Cancer Institute, 2 2005. 6. Phillips KA, Morrison KR, Andersen R, Aday LA:Understanding the Context
of Healthcare Utilization: Assessing Environmental and Provider-Related Variables in the Behavioral Model of Utilization.Health Services Research 1998,33(3):571-596.
7. Aday LA, Andersen RM:A framework for the study of access to medical care.Health Services Research1974,9:208-220.
8. Aday LA, Begley CE, Lairson DR, Balkrishnan R:Evaluating the healthcare system: effectiveness, efficiency, and equity.Chicago, IL: Health Administration Press; Academy Health, 3 2004.
9. Aday LA, Awe WC:Health Services Utilization Models.Handbook of Health
Behavior Research: Personal and Social DeterminantsNew York: Plenum
PressGochman DS 1997,1:153-172.
10. Andersen RM, Davidson PL:Measuring Access and Trends.Changing the
US Health Care SystemSan Francisco, CA: Jossey-BassAndersen RM, Rice TH,
11. De Maio FG:Ecological Analysis of the Health Effects of Income Inequality in Argentina.Public Health2008,122(5):487-496.
12. Larrea C, Kawachi I:Does economic inequality affect child malnutrition? The case of Ecuador.Social Science & Medicine2005,60(1):165-178. 13. Subramanian SV, Delgado I, Jadue L, Vega J, Kawachi I:Income inequality
and health: multilevel analysis of Chilean communities.J Epidemiol
Community Health2003,57(11):844-848.
14. Arcury TA, Gesler WM, Preisser JS, Sherman J, Spencer J, Perin J:The Effects of Geography and Spatial Behavior on Health Care Utilization among the Residents of a Rural Region.Health Services Research2005, 40(1):135-156.
15. Luo W:Using a GIS-based floating catchment method to assess areas with shortage of physicians.Health and Place2004,10(1):1-11. 16. Rosero-Bixby L:Spatial access to health care in Costa Rica and its equity:
a GIS-based study.Social Science & Medicine2004,58(7):1271-1284. 17. CEPAR:Informe Final: ENDEMAIN 2004.Quito, Ecuador: Centro de Estudios
de Población y Desarrollo Social (CEPAR) 2005, 625.
18. CDC International Reproductive Health Surveys and Comparative Reports: ENDEMAIN 2004.[http://www.cdc.gov/reproductivehealth/ Surveys/SurveyList.htm].
19. Ministerio de Bienestar Social:Sistema Integrado de Indicadores Sociales (SIISE), versión 4.0.Quito2005.
20. Cromley EK, McLafferty SL:GIS and Public Health.New York, NY: The Guilford Press 2002.
21. Langley P, Goodchild MF, Maguire DJ, Rhind DW:Geographical information systems and science.Sussex, UK: John Wiley & Sons, 2 2005. 22. Subramanian SV, Jones K, Duncan C:Multilevel methods for public health
research.Neighborhoods and HealthNew York: Oxford University PressKawachi I, Berkman LF 2003, 65-111.
23. Rodriguez G, Goldman N:Improved Estimation Procedures for Multilevel Models with Binary Response: A Case-Study.Journal of the Royal Statistical
Society Series A (Statistics in Society)2001,164(2):339-355.
24. Rodriguez G, Goldman N:An Assessment of Estimation Procedures for Multilevel Models with Binary Responses.Journal of the Royal Statistical
Society Series A (Statistics in Society)1995,158(1):73-89.
25. Duncan TE, Duncan SC, Hayrettin O, Strycker LA, Hix-Small H:A Multilevel Contextual Model of Neighborhood Collective Efficacy.American Journal
of Community Psychology2003,32(3/4):245-252.
26. StataCorp:Stata/MP 9.2 for Windows.College Station, TX: Stata Corp LP 2007.
27. Anselin L:GeoDa™0.9 User’s Guide.Urbana, IL: Center for Spatially Integrated Social Science 2003.
28. Rasbash J, Steele F, Browne W, Prosser B:A User’s Guide to MLwiN. London: Centre for Multilevel Modelling, University of Bristol 2004. 29. Diez Roux AV:Investigating Neighborhood and Area Effects on Health.
Am J Public Health2001,91(11):1783-1789.
30. World Health Organization:The World Health Report 2006 - Working Together for Health.Geneva: Author2006, 237.
31. Dussault G, Franceschini M:Not enough there, too many here: understanding geographical imbalances in the distribution of the health workforce.Human Resources for Health2006,4(1):12.
32. Chen L, Evans T, Anand S, Boufford JI, Brown H, Chowdhury M, Cueto M, Dare L, Dussault G, Elzinga G,et al:Human resources for health: overcoming the crisis.Lancet2004,364(9449):1984.
33. Huish R:How Cuba’s Latin American School of Medicine challenges the ethics of physician migration.Social Science & Medicine2009,
69(3):301-304.
34. Organizacion Panamericana de la Salud:Plan Andino de Recursos Humanos en Salud.Washington, DC: Author2008, 24.
35. Cavender A, Albán M:Compulsory medical service in Ecuador: the physician’s perspective.Social Science & Medicine1998,47(12):1937-1946. 36. Blalock HM:Implicit Theoretical Assumptions in Research Designs.
Methodology for Population Studies and DevelopmentNew Delhi: Sage
Publications Inc.Mahadevan K, Krishnan P 1993, 21-35.
37. Chaix B, Merlo J, Subramanian SV, Lynch J, Chauvin P:Comparison of a Spatial Perspective with the Multilevel Analytical Approach in Neighborhood Studies: The Case of Mental and Behavioral Disorders due to Psychoactive Substance Use in Malmo, Sweden, 2001.American
Journal of Epidemiology2005,162(2):171-182.
38. Maheswaran R, Craglia M:GIS in Public Health Practice.Boca Raton: CRC Press 2004.
39. Farrow A, Larrea C, Hyman G, Lema G:Exploring the spatial variation of food poverty in Ecuador.Food Policy2005,30(5-6):510-531.
40. Cummins S, Curtis S, Diez-Roux AV, Macintyre S:Understanding and representing‘place’in health research: A relational approach.Social
Science & Medicine2007,65(9):1825-1838.
41. Sridharan S, Tunstall H, Lawder R, Mitchell R:An exploratory spatial data analysis approach to understanding the relationship between deprivation and mortality in Scotland.Social Science & Medicine2007, 65(9):1942-1952.
42. Chaix B, Merlo J, Chauvin P:Comparison of a spatial approach with the multilevel approach for investigating place effects on health: the example of healthcare utilization in France.Journal of Epidemiology and
Community Health2005,59(6):517-526.
43. Higgs G:The role of GIS for health utilization studies: literature review.
Health Services and Outcomes Research Methodology2009,9(2):84-99.
44. Sabik LM, Lie RK:Priority setting in health care: Lessons from the experiences of eight countries.International Journal for Equity in Health 2008,7:4.
45. Plescia M, Koontz S, Laurent S:Community assessment in a vertically integrated health care system.American Journal of Public Health2001, 91(5):811-814.
46. Dunn JR, Cummins S:Placing health in context.Social Science & Medicine 2007,65(9):1821-1824.
47. Bambas L, Braveman P, Dachs JNW, Delgado I, Gakidou E, Moser K, Rolfe L, Vega J, Zarowsky C:Strengthening health information systems to address health equity challenges.Bulletin of the World Health Organization2005, 83(8):561-640.
Pre-publication history
The pre-publication history for this paper can be accessed here: http://www. biomedcentral.com/1472-6963/10/64/prepub
doi:10.1186/1472-6963-10-64
Cite this article as:López-Cevallos and Chi:Assessing the context of health care utilization in Ecuador: A spatial and multilevel analysis.BMC Health Services Research201010:64.
Submit your next manuscript to BioMed Central and take full advantage of:
• Convenient online submission
• Thorough peer review
• No space constraints or color figure charges
• Immediate publication on acceptance
• Inclusion in PubMed, CAS, Scopus and Google Scholar
• Research which is freely available for redistribution